Hi there!
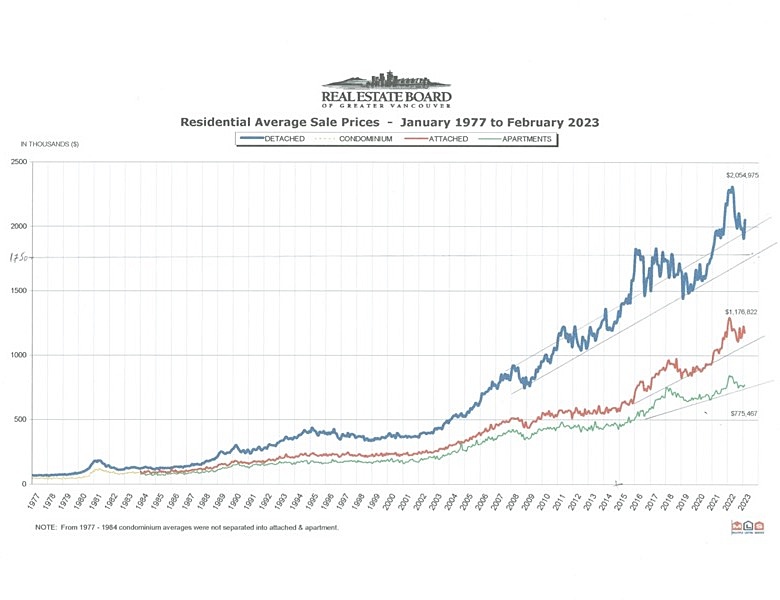
Here is the REBGV House Price Chart for Feb 2023
I added trend lines on the graph so you can see where we are now relative to the trend line. It appears that there was a slight uptick in the detached house average price ( blue line) which broke the downtrend in price which commenced in March 2022 when interest rates started to increase. The townhouse market ( the red line) is showing a slight rebound from the 2022 decline as buyer are bidding against each other for the few decent townhouse listings hitting the market this spring. Apartment condos ( green line) have had their downturn almost come to and end and I think the condo apartment market will be undersupplied for resale listings and new development units for the next few years until the economy gets used to the higher borrowing costs.This should keep the more attractive (less than 5 yr old) condos in steady demand from buyers who don't want to wait 2-4 years before the condo developments are built but instead would rather buy something that is ready to move-in. The graph shown here is for the Average price which can be influenced by very few sales or sales at the higher end of the price spectrum so I'd hesitate to conclude small month to movements being a major change in trend. I heard of a $19.6 million condo apartment sale this month so I expect that will influence the average condo apt chart next month! See my previous article from a year ago for more insight on how timing is important when buying and selling your home.