Hi !
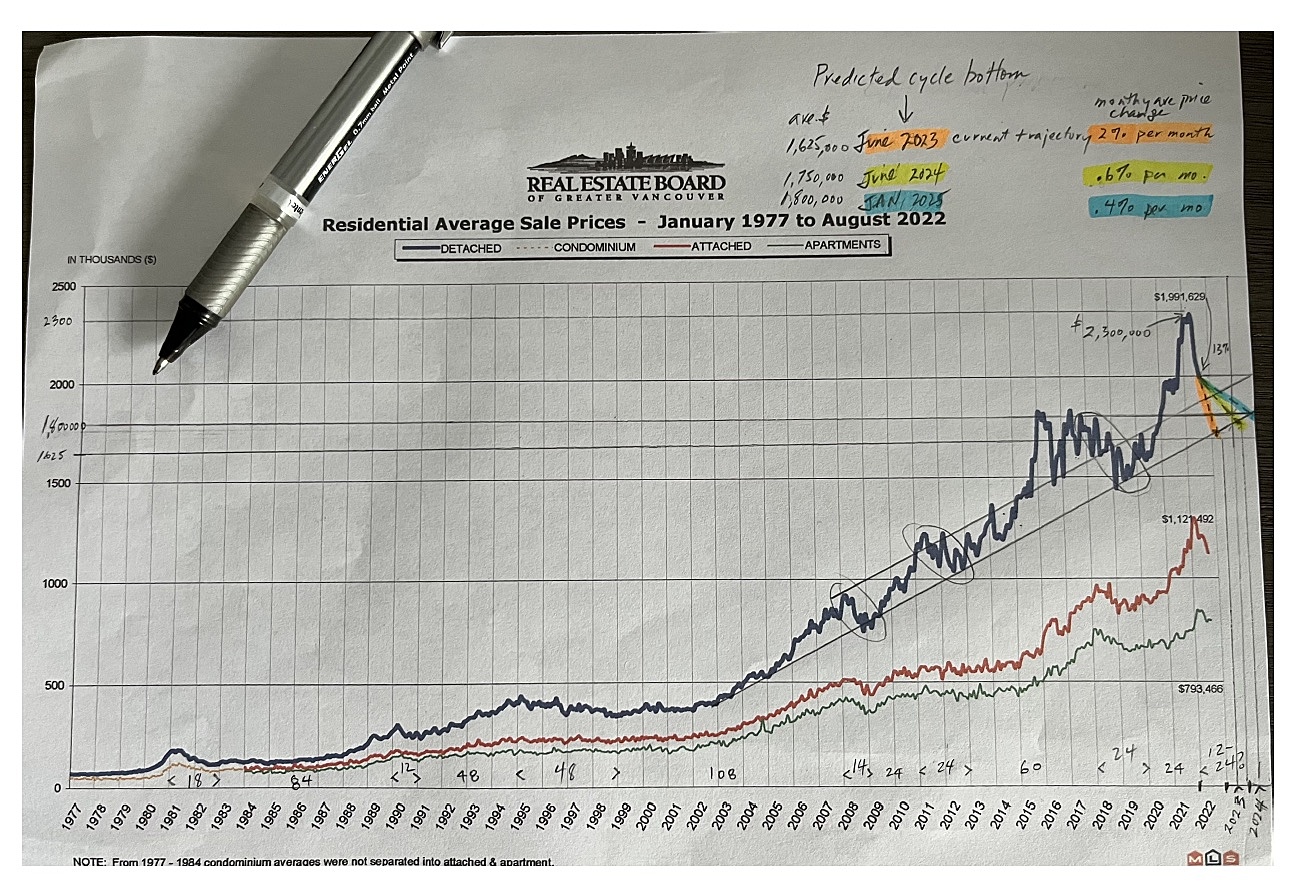
After spending the last 41 years working in the Vancouver real estate business as a member of the Real Estate Board of Vancouver , I have access to the long term price graphs going back to 1977! At a glance you see that over the long term prices rise due to more demand (population growth)than supply(new homes built). Because of its geography , Metro Vancouver has very limited areas to expand housing for the ever-growing population. The desire to own a home has never really changed. Interest rates were recently at historically low levels and many buyers were qualified to borrow more money than they could ever have imagined. Early in 2023, western governments began raising interest rates to slow down the rising costs due to inflation. Too much cheap money chasing a limited supply of goods. That includes real estate!
That said, we have all heard that house prices can sometimes go up really fast and then fall back down just as quickly! So, if you could make your buying and selling decisions for real estate based on historical patterns that look likely to repeat, you might be able to avoid the stress of losing your equity very quickly(especially if your loan overtakes the value of your home!). I've seen this before in 1981,2008,2012,2018 and potentially right now in 2022 where we have seen at least 13% decline since the March 2022 cycle top. Consequently, if you could buy near the cycle bottom, you could see outsized returns on your real estate investment in just a few years!
3 timeline scenarios where we could go from here
I put pen on paper and drew the trend lines since 2003 and connected the cycle highs on the upper line and the cycle lows at the bottom line creating a parallel set of lines I call the "channel". The average house price tends to gravitate back inside the channel over the long term. Lots of variables cause the change in direction. Obviously most recently interest rates doubling since Feb 2022 started the chart turning back toward the long term channel. After steady rate hikes we see the prices have declined by about 13% over 6 months or a trajectory of say 2% a month. Looking at the channel lines I can make a guess that depending in the month to month average price decline rate I can project that the price line should touch the bottom line of the channel at a predicted time! If prices remain on the same decline trajectory the average house price that intersects the orange colored trend line is at about $1.625 M occurring in June 2023. If things don't decline as fast as the last 6 months we look at the yellow line and it intersects at about $1.75 m in June 2024 or if the monthly price declines goes to .4% a month we can see the blue line intersect the lower line in January 2025 at $1.8 m.
So what does this mean to home sellers? Peak was $2.3 m in March 2022 and I predict the price will bottom out around $1.65 for a total drop in price of about $700,000 or approx 30%. Wow, it went too high too fast and gravity is bringing us down to the channel like a skier coming down from the peak of the mountain! Historically, Vancouver prices drop 12-24 months from top to bottom. See the years along the bottom of the chart with cycle duration in brackets to see the circled down cycles. Therefore consider selling now before the price ends up in at the bottom of channel ( expect another 17% fall from Oct 2022)
How about for buyers? Consider watching from the grandstand until the average price nears the bottom trend line of the Channel. You might never sell at the top (which lasts only a few weeks!) or buy at the bottom ( same few weeks) but this analysis might help you to do your research and be ready +- 3 months from the predicted dates that are shown in my chart analysis!
Call me to discuss your current needs and we can get working together!