


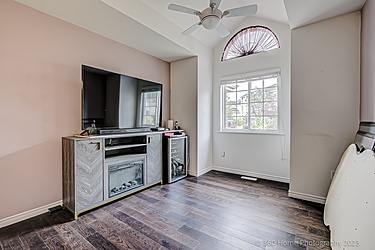


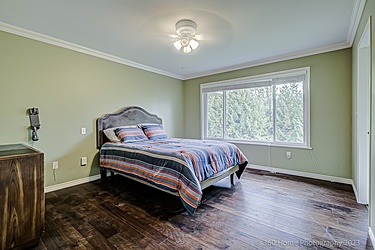


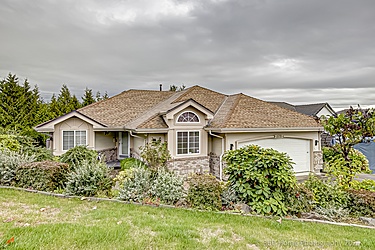
1533 Eagle Mountain Drive
Ask a Question
Need more information on this property? Let us connect you with one of our advisors.
- {{error}}
| Property Type | Residential Detached | Property Style | 2 level |
|---|
| Main Level SF | — | Year Built | 1996 |
| Floor Levels | 2 | Total SF | 2,929 |
| Lot Area | 13681.0 | Taxes | $5,160 |
| Storeys | 2 | Basement Area | — |
| Land Title | freehold | Frontage | 54.0 |
| Depth | 255 FT | Views | — |
| Site Influences | — | Listed By | — |
1533 Eagle Mountain Drive is in the Westwood Plateau Neighbourhood
View full neighbourhood profileWestwood Plateau Overview
Westwood Plateau is part of Coquitlam and is 23.9 km from Downtown Vancouver and 31.1 km from the Vancouver International Airport. There are 5 schools in Westwood Plateau including Summit Middle School, Ecole Panorama Heights Elementary, and Pinetree Way Elementary.
There are currently 52 homes for sale in Westwood Plateau made up of condos, townhomes and houses with an average list price of $1,761,267. An average House in Westwood Plateau has 6 bedrooms, is 3,832 SF and lists for $2,238,045. House prices range from $1,599,000 - $3,680,000.
Market Summary
Average Sale Price
Sales
Active Listings
Average Days On Market

Local Schools
Market Insights for Houses
Last updated January 04, 2025 at 11:31pm UTC
Average Sale Price
Chart Information

Neighbourhood Sales Summary
Chart Information
Average Sale Price
Coquitlam
sample
sample
Dwelling Size (SF)
Coquitlam
sample
sample
Price / SF (Lot)
Coquitlam
sample
sample
Average Year Built
Coquitlam
sample
sample
Neighbourhood Price Trend
Chart Information

Houses
Connect with one of our Advisors to learn more about 1533 Eagle Mountain Drive.
- {{error}}