Benchmark Prices - April 2020
Apr 07, 2020
Written by
Ryan BerlinSHARE THIS
Here are the latest Benchmark Price Infographics for the areas of the Lower Mainland covered in the monthly rennie review. Greater Vancouver Board Area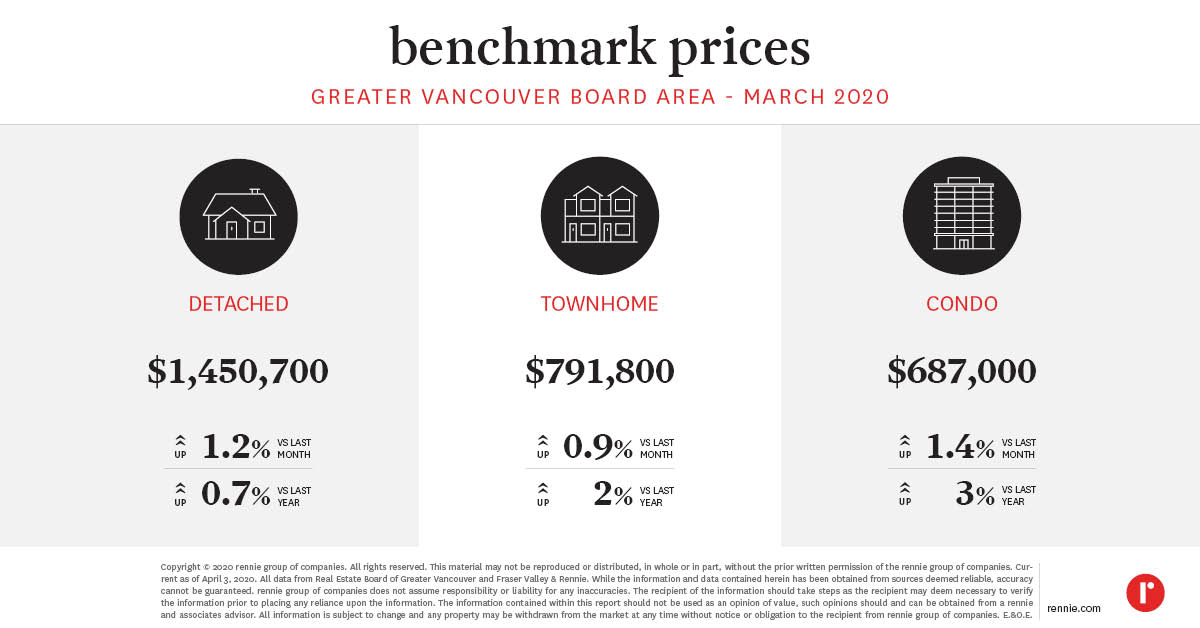 Vancouver East
 Vancouver West
 Burnaby East
 Burnaby South
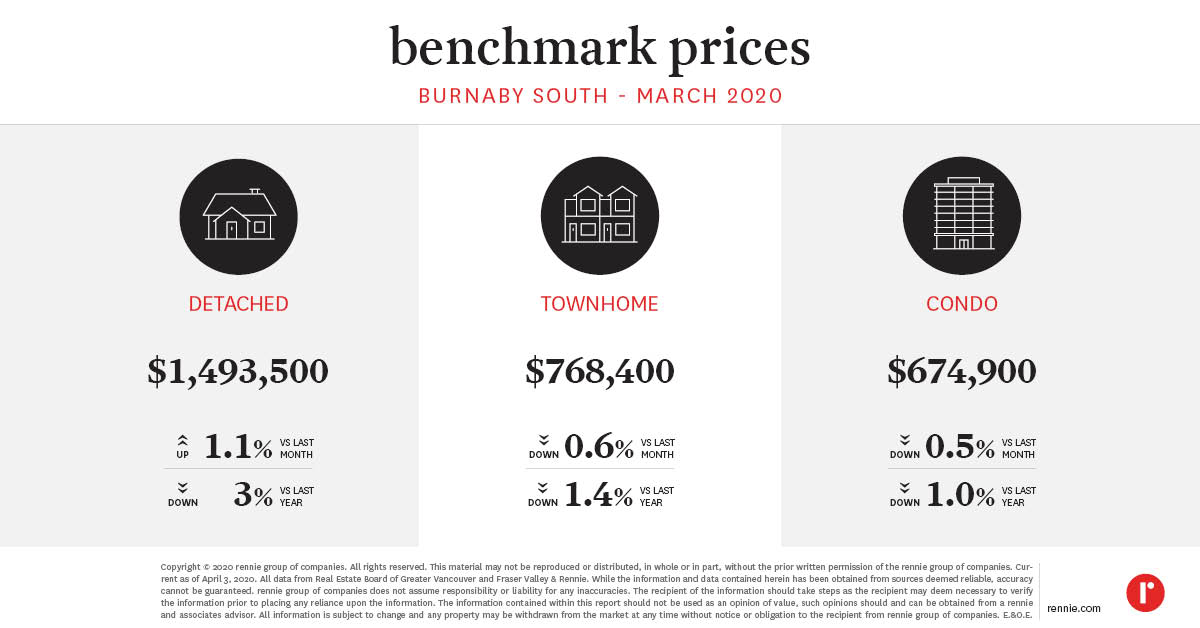 Richmond
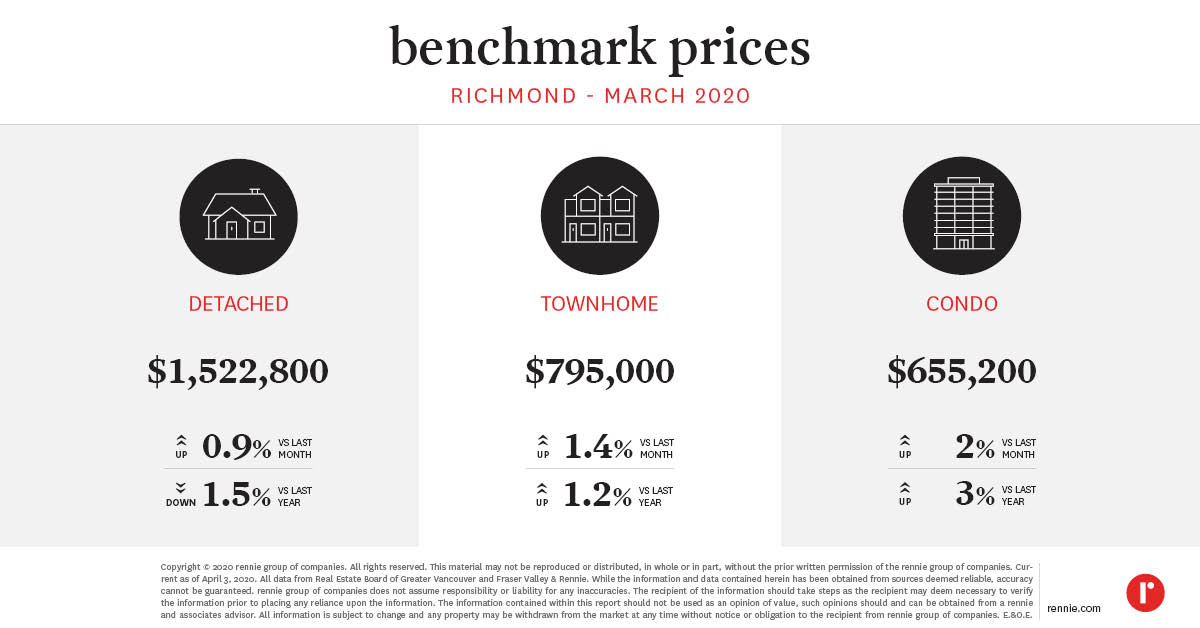 Coquitlam
 North Vancouver
 New Westminster
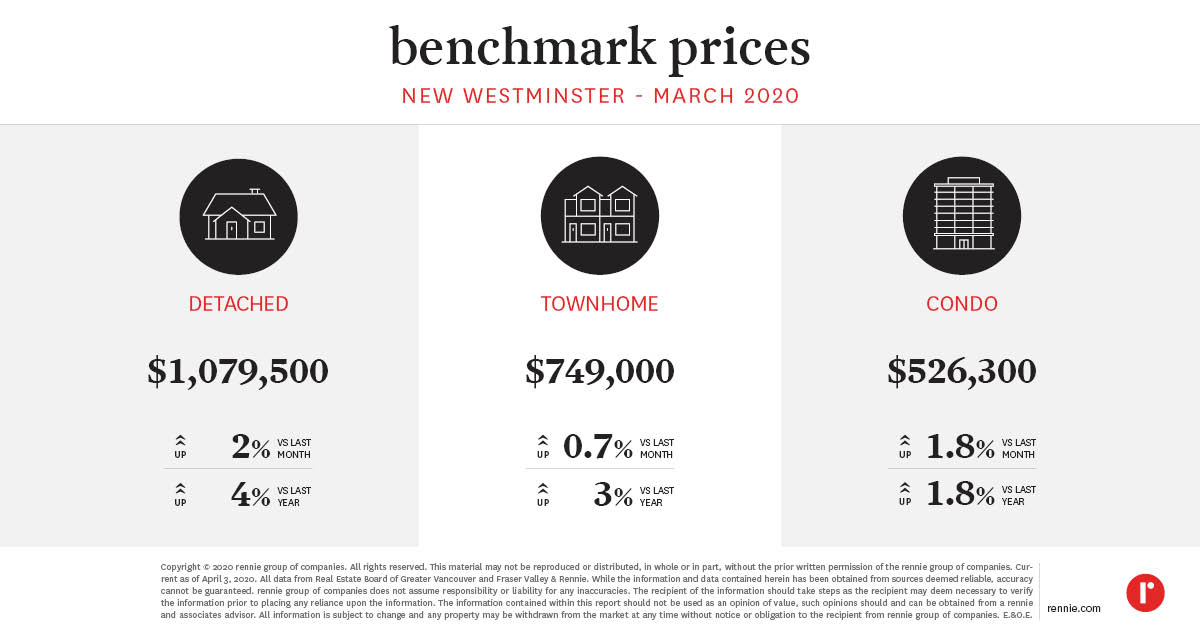 Squamish
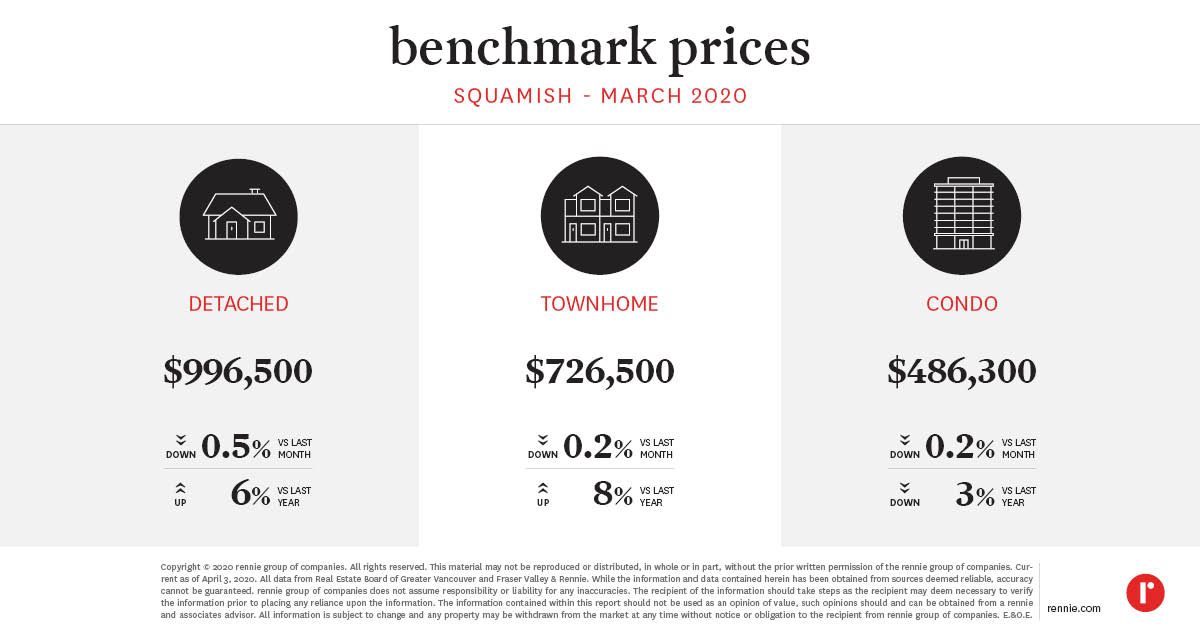 Tsawwassen
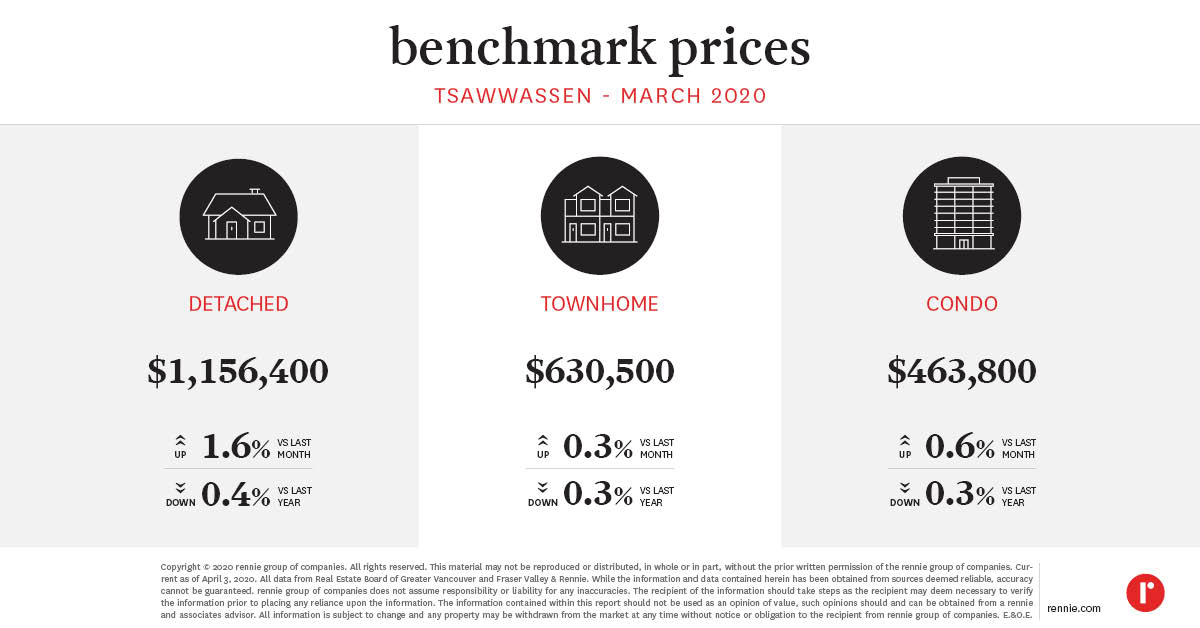 White Rock
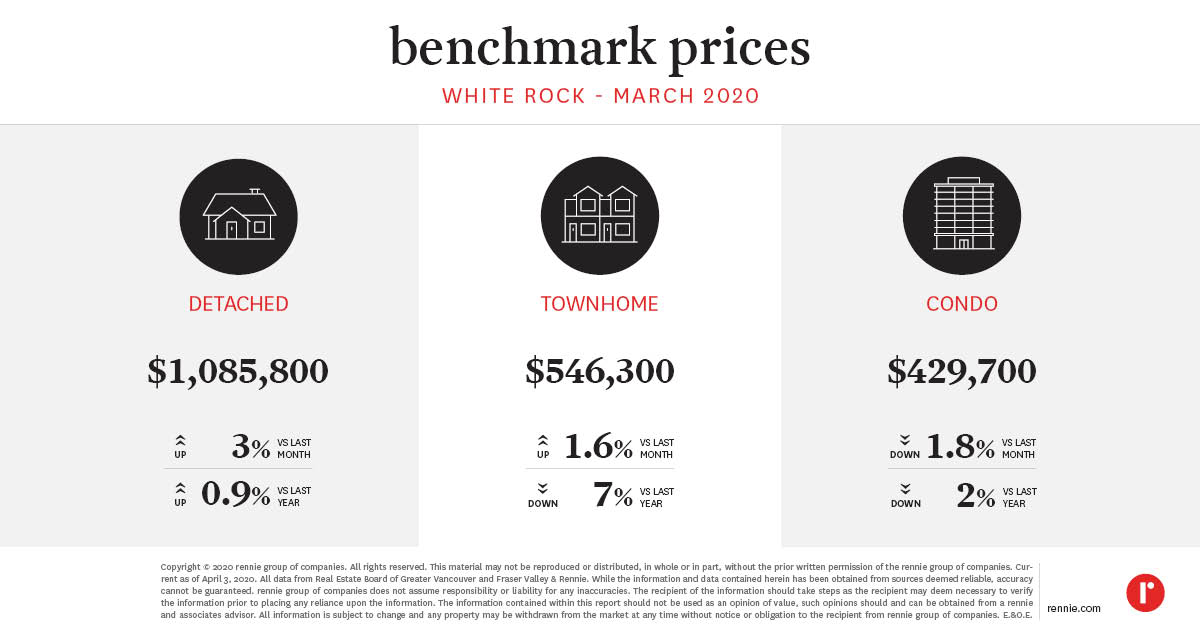 Port Coquitlam
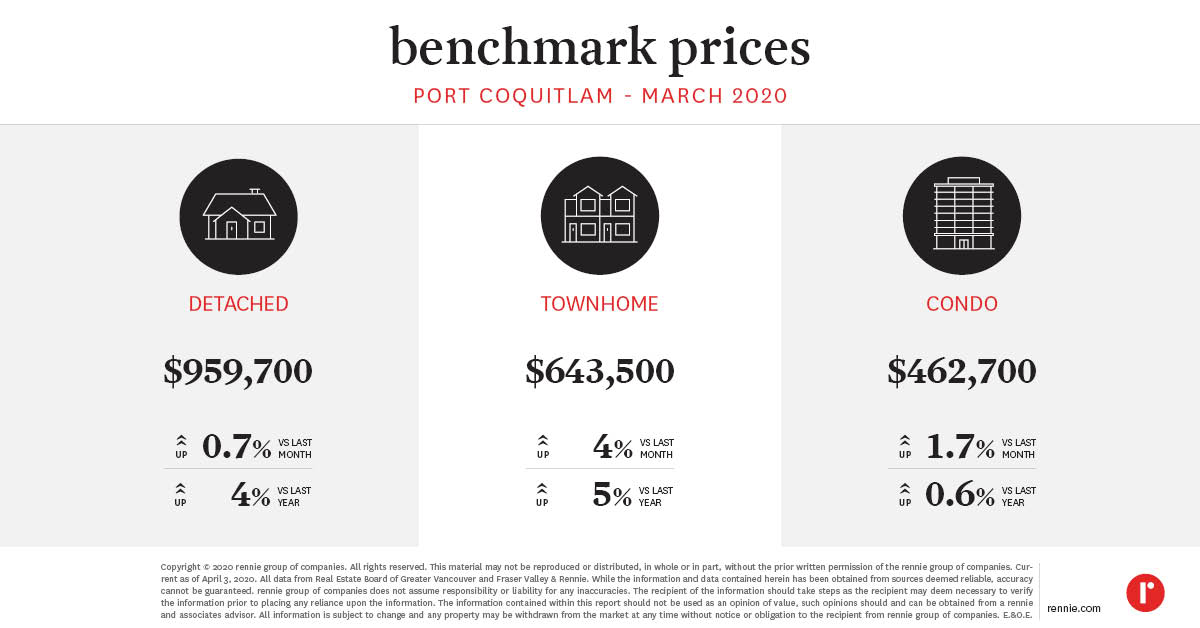 Port Moody
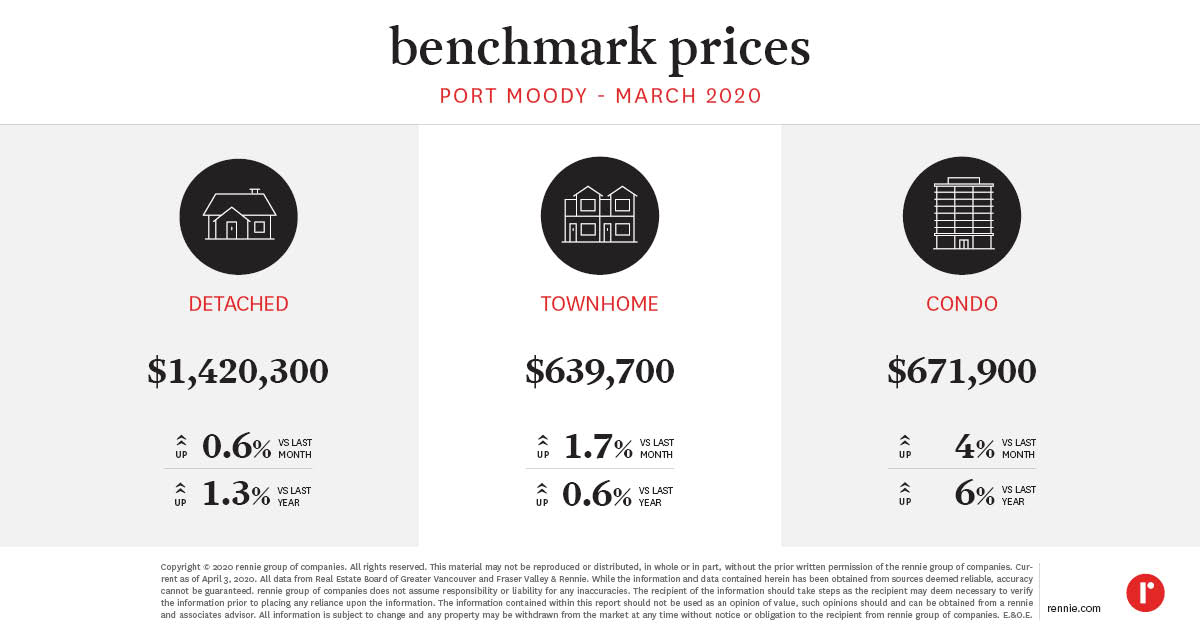 Fraser Valley Board Area
 Surrey
 Langley
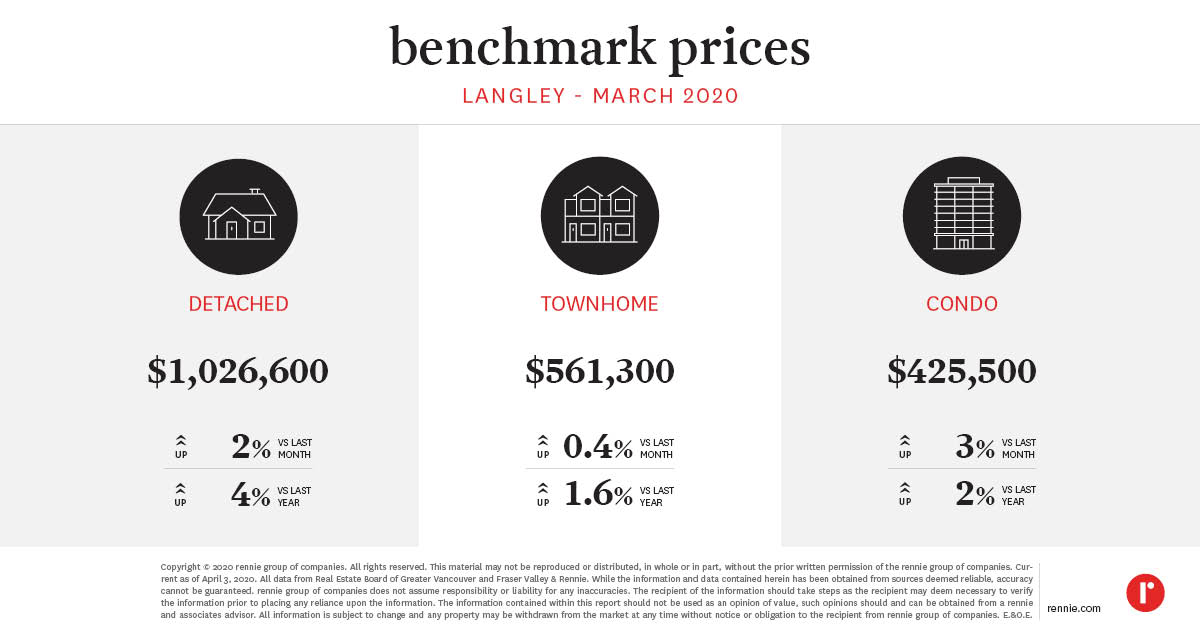 Pitt Meadows
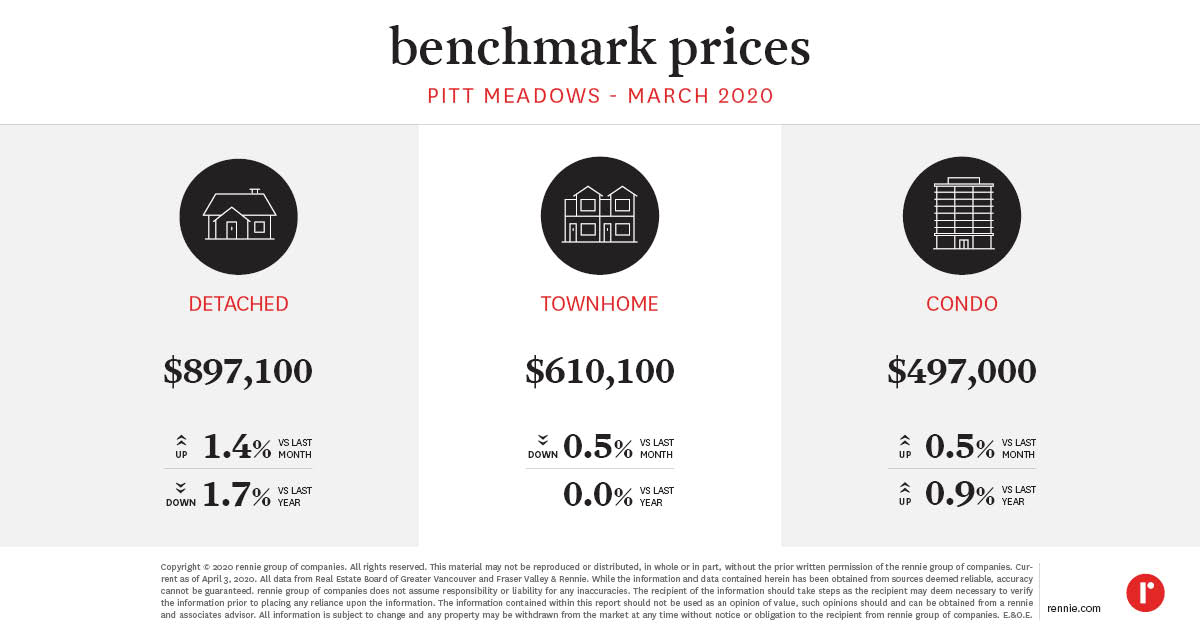 Maple Ridge
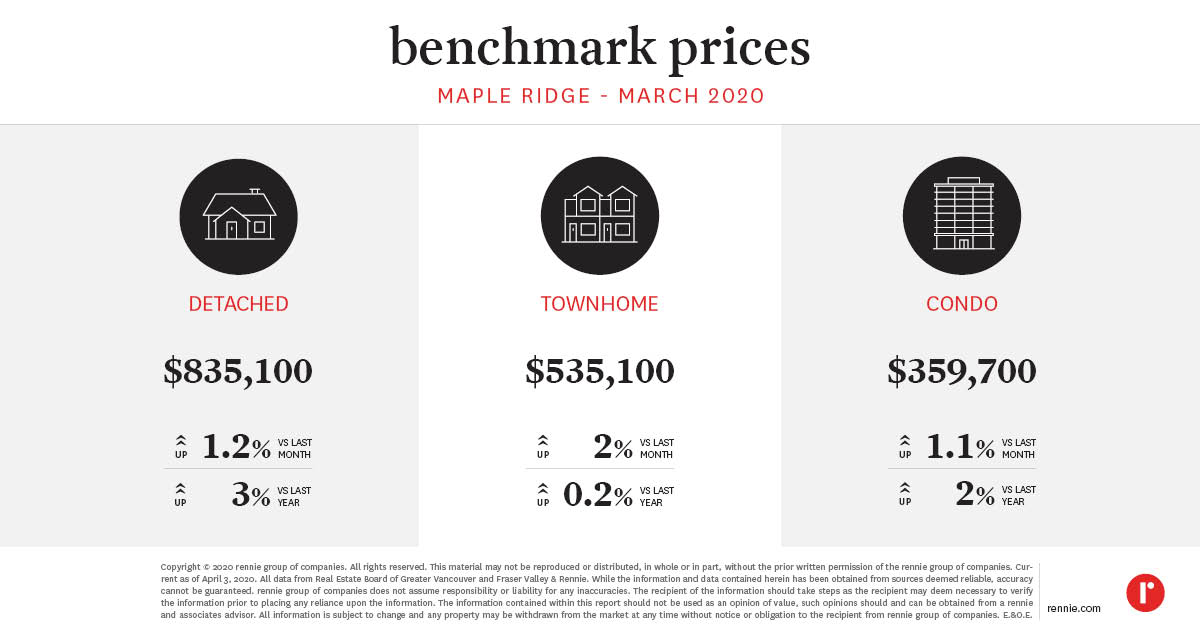 Abbotsford
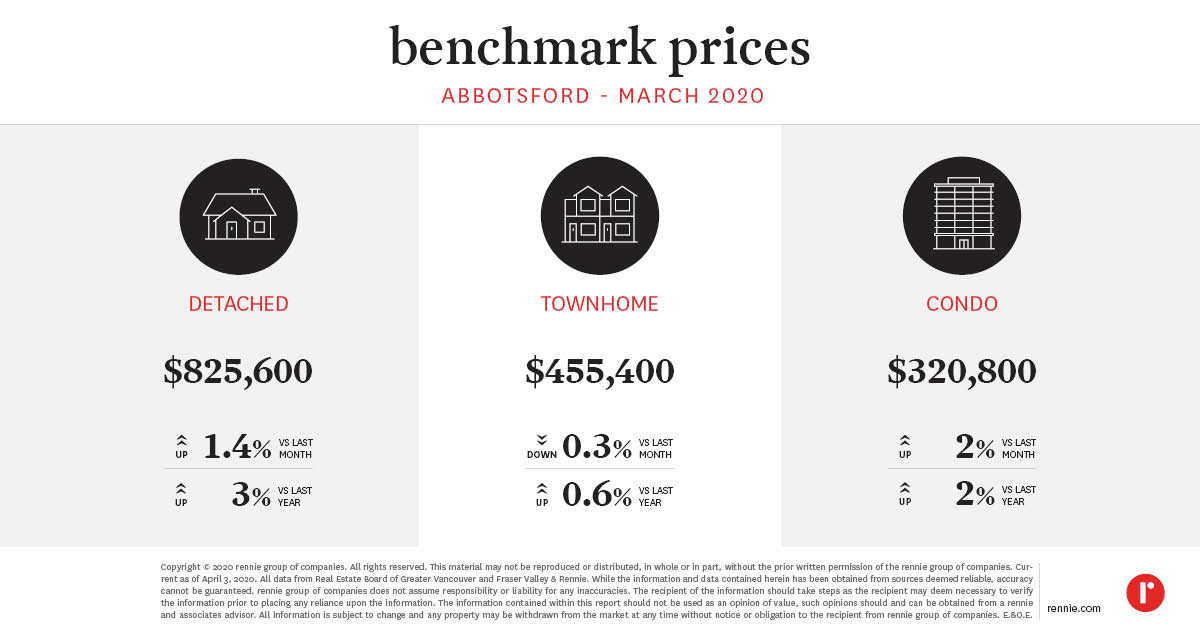 Chilliwack and District Board Area
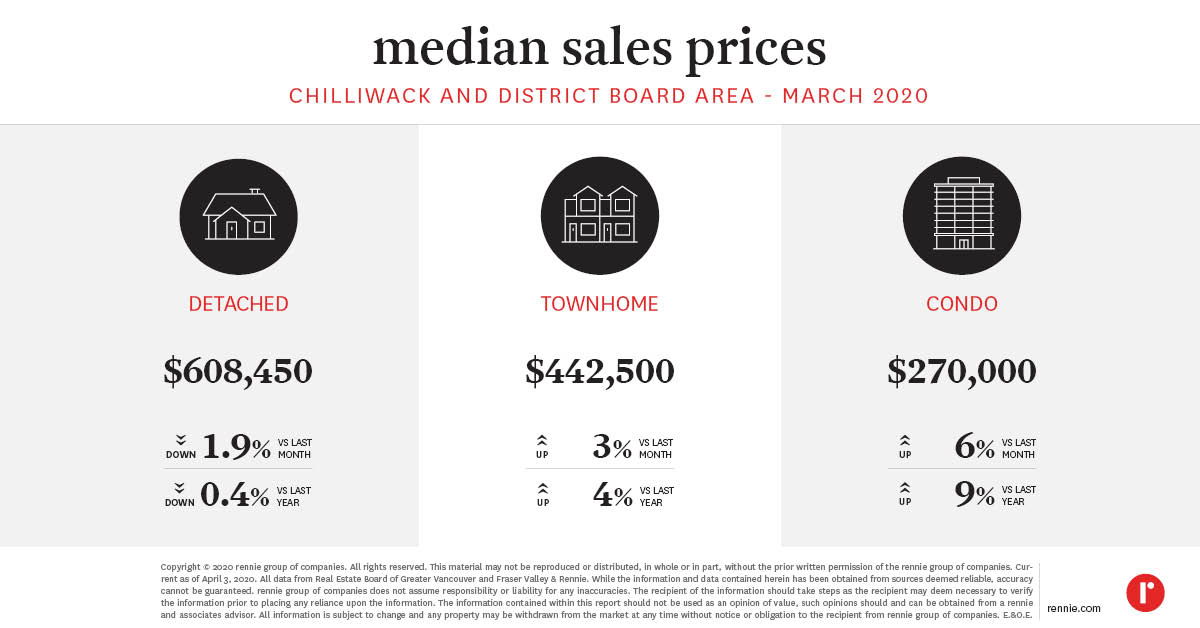 Note, the Chilliwack and District Board Area (CADREB) denotes the Median Sales Price rather than the Benchmark Price. The CADREB does not have a benchmark price available for record.
See Benchmark Prices Infographics for March 2020here. Our rennie intelligence team comprises our in-house demographer, senior economist, and market analysts. Together, they empower individuals, organizations, and institutions with data-driven market insight and analysis. Experts in urban land economics, community planning, shifting demographics, and real estate trends, their strategic research supports a comprehensive advisory service offering and forms the basis of frequent reports and public presentations. Their thoughtful and objective approach truly embodies the core values of rennie.
Written by
Related
Inflation is once again top of mind with the war in Iran driving up energy prices globally. Home sales in Greater Victoria through the first three months of this year were at their second-lowest level in more than a decade.
Apr 2026
Report
Rising energy prices as a result of the war in Iran have rekindled inflation concerns and put upward pressure on interest rates. Sales in the Central Okanagan remained above last year’s level in March, but inventory was notably lower, leading to tighter market conditions.
Apr 2026
Report