Benchmark Prices - August 2021
Aug 13, 2021
Written by
Ryan BerlinSHARE THIS
Here are the latest Benchmark Price Infographics for the areas of Vancouver region covered in the monthly rennie review.Greater Vancouver Board Area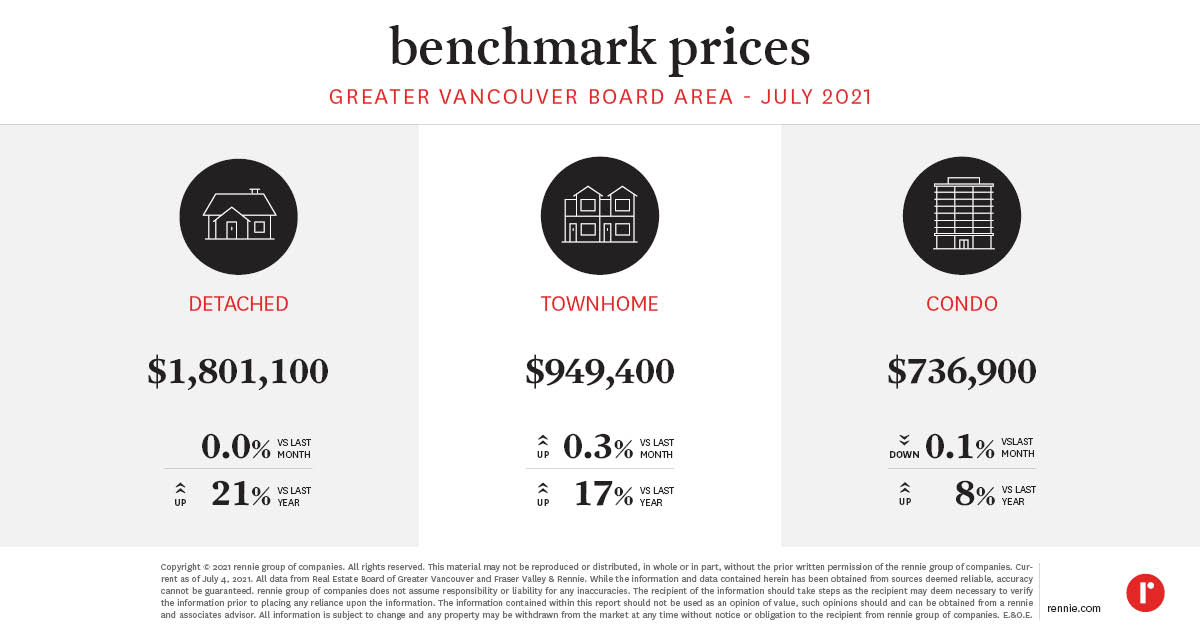 Burnaby East
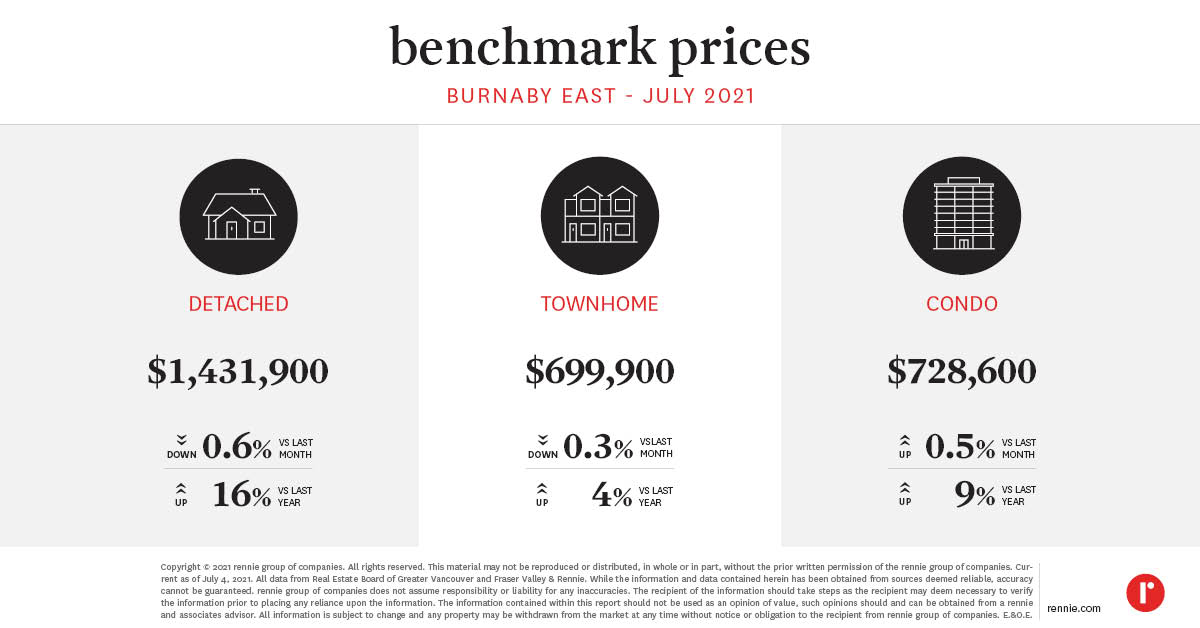 Burnaby North
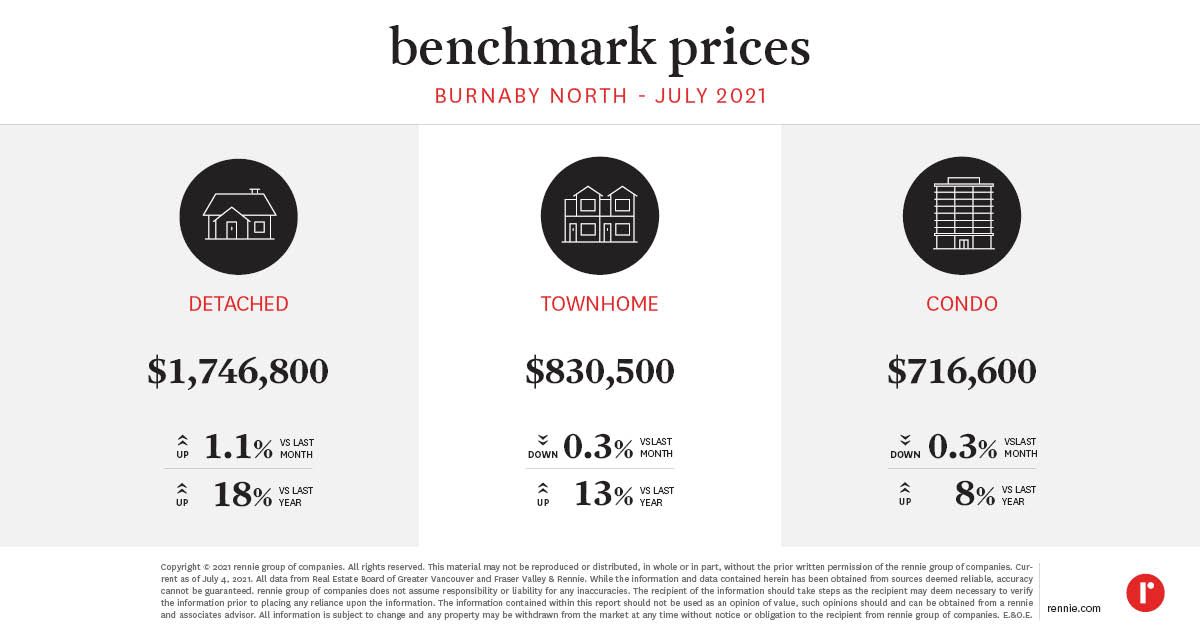 Burnaby South
 Coquitlam
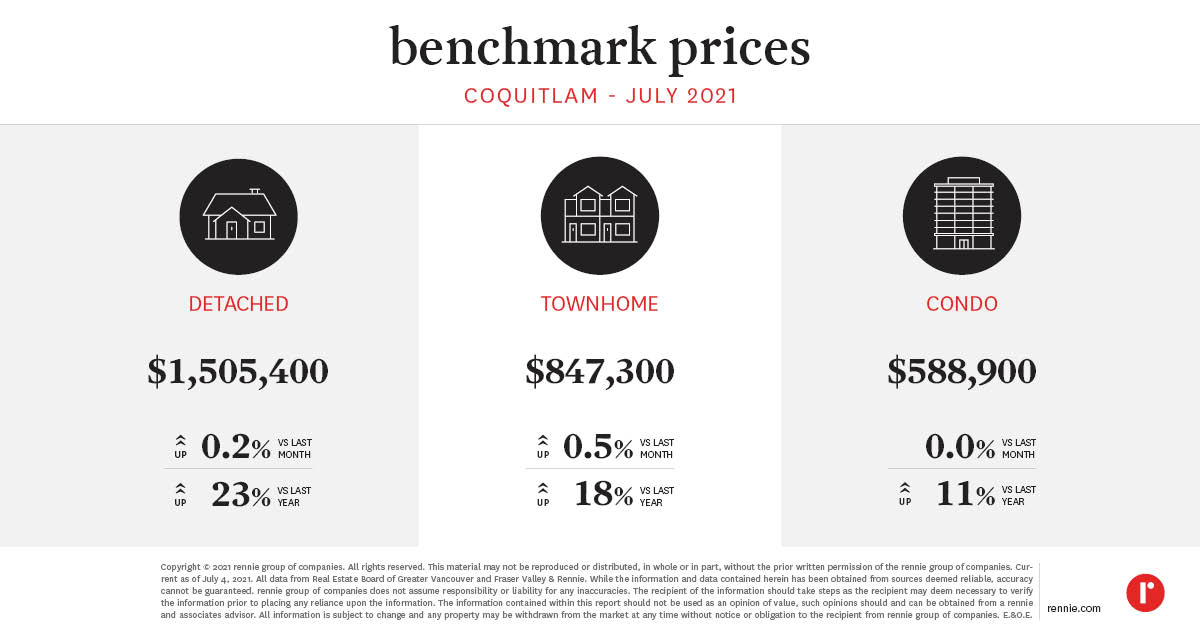 North Vancouver
 Richmond
 Vancouver East
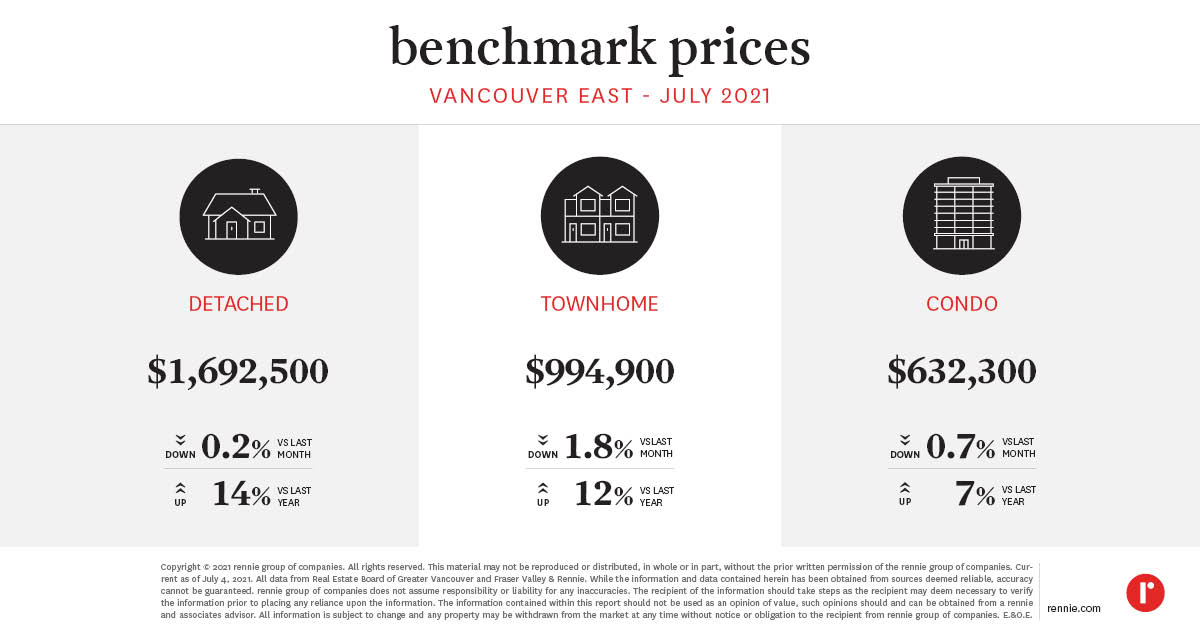 Vancouver West
 West Vancouver
 New Westminster
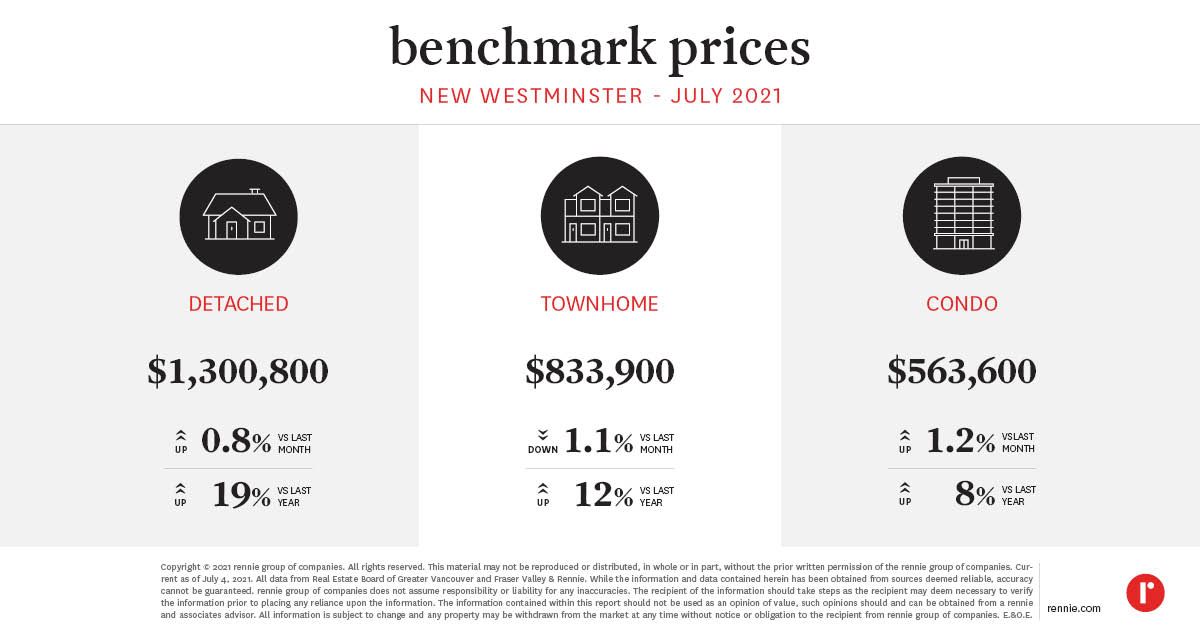 Squamish
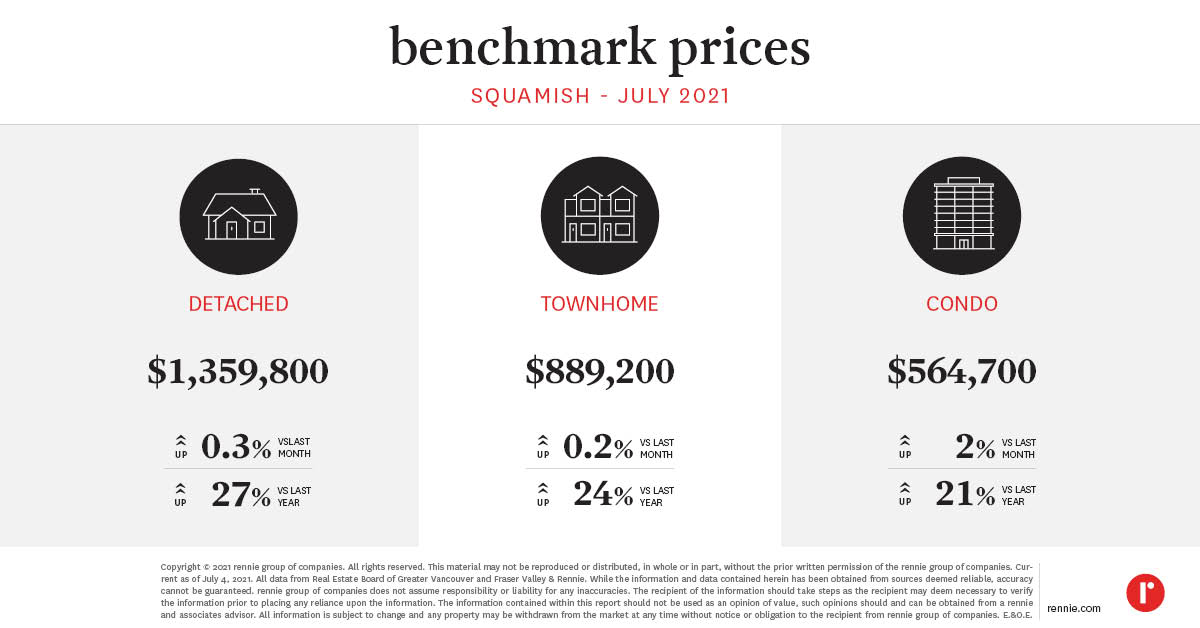 Tsawwassen
 Port Coquitlam
 Port Moody
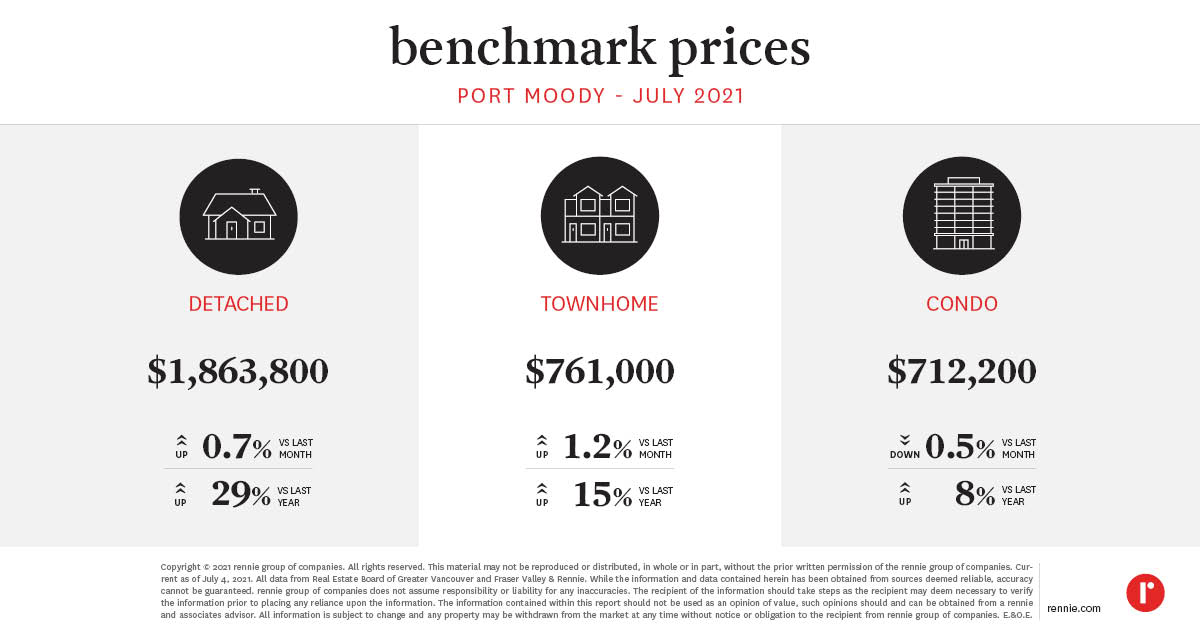 Fraser Valley Board Area
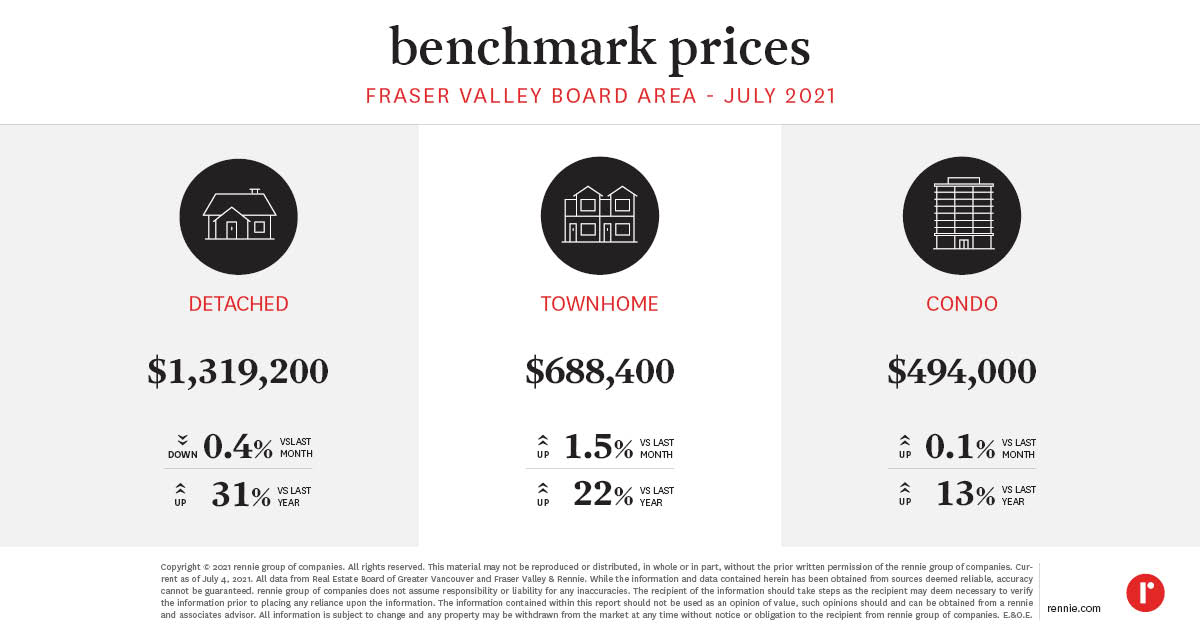 Surrey
 Langley
 Pitt Meadows
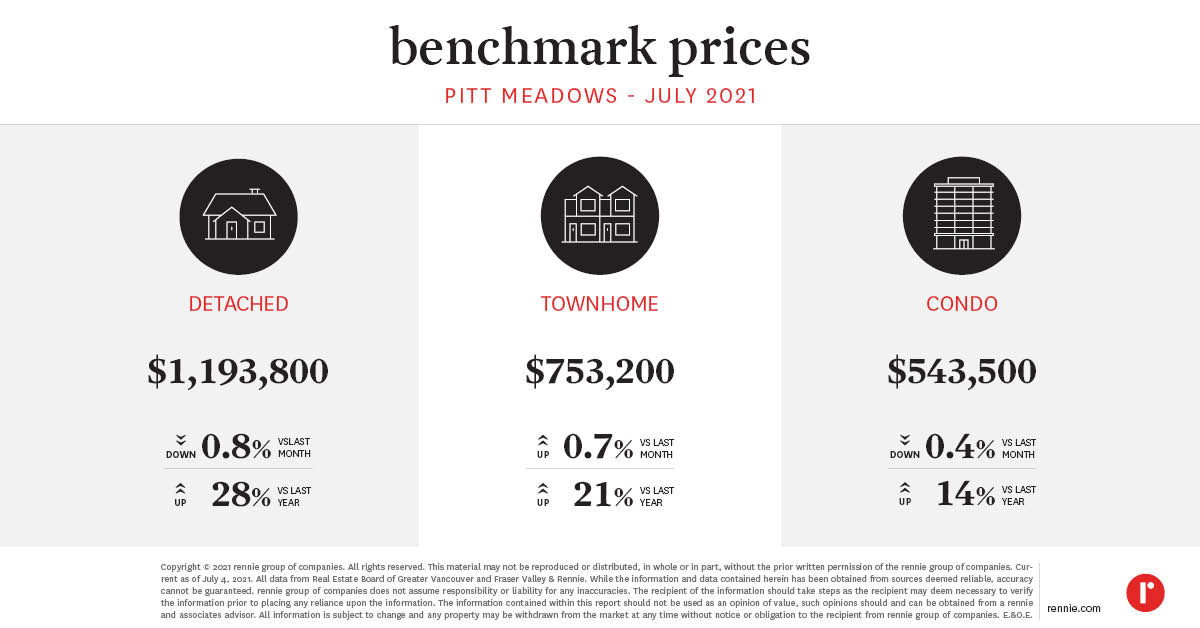 Maple Ridge
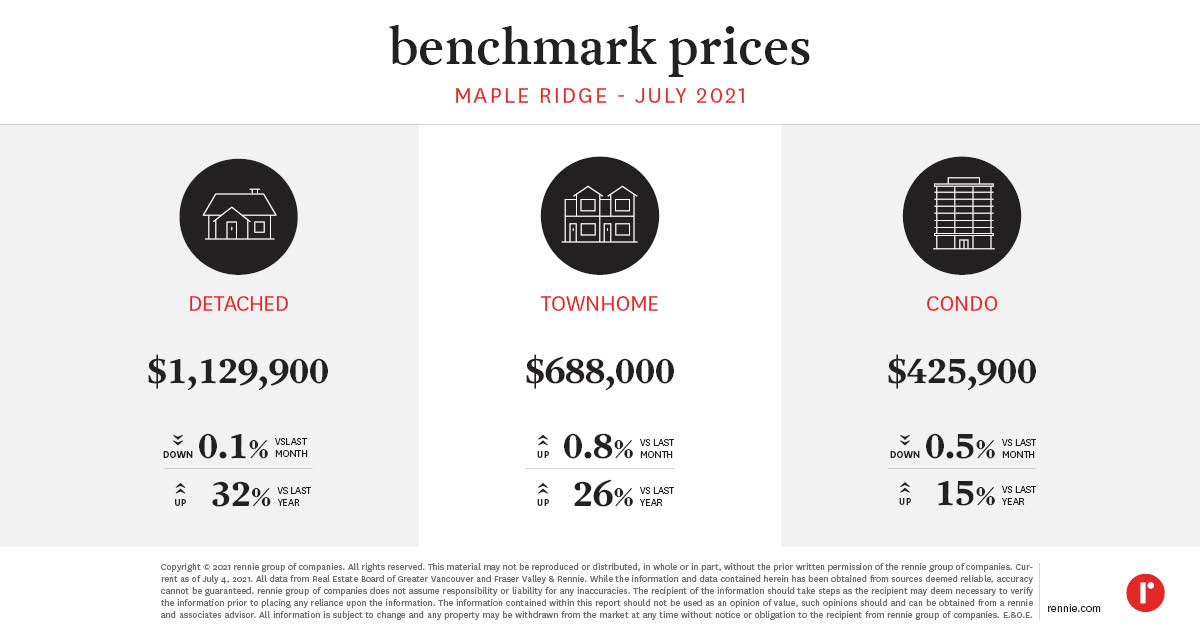 White Rock
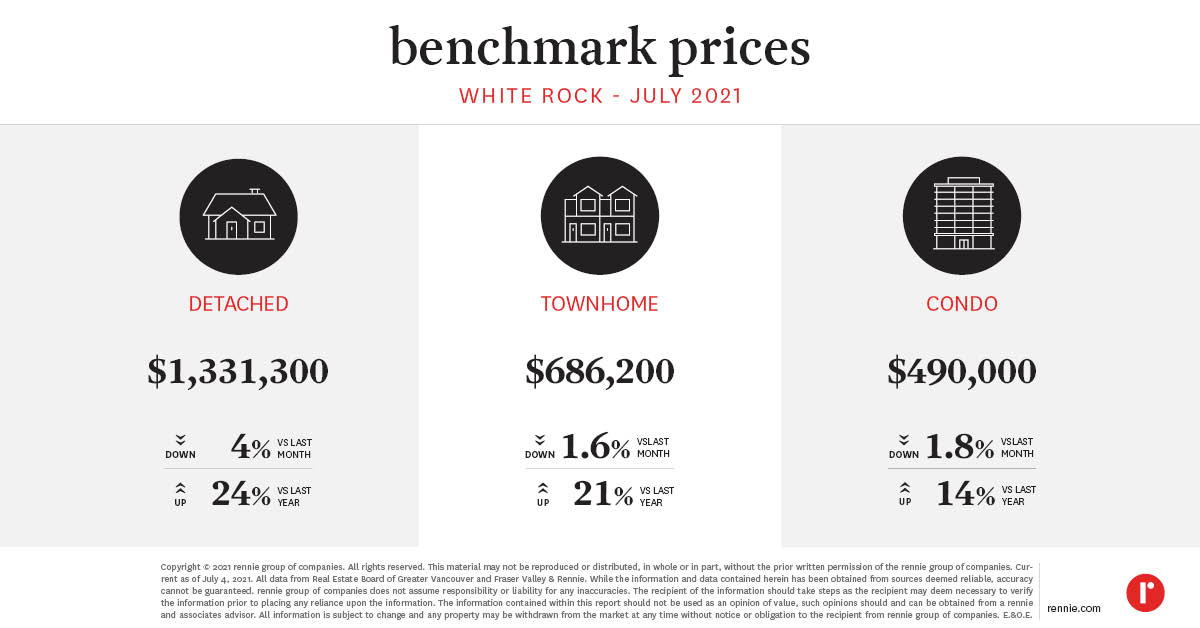 Abbotsford
 Chilliwack and District Board Area
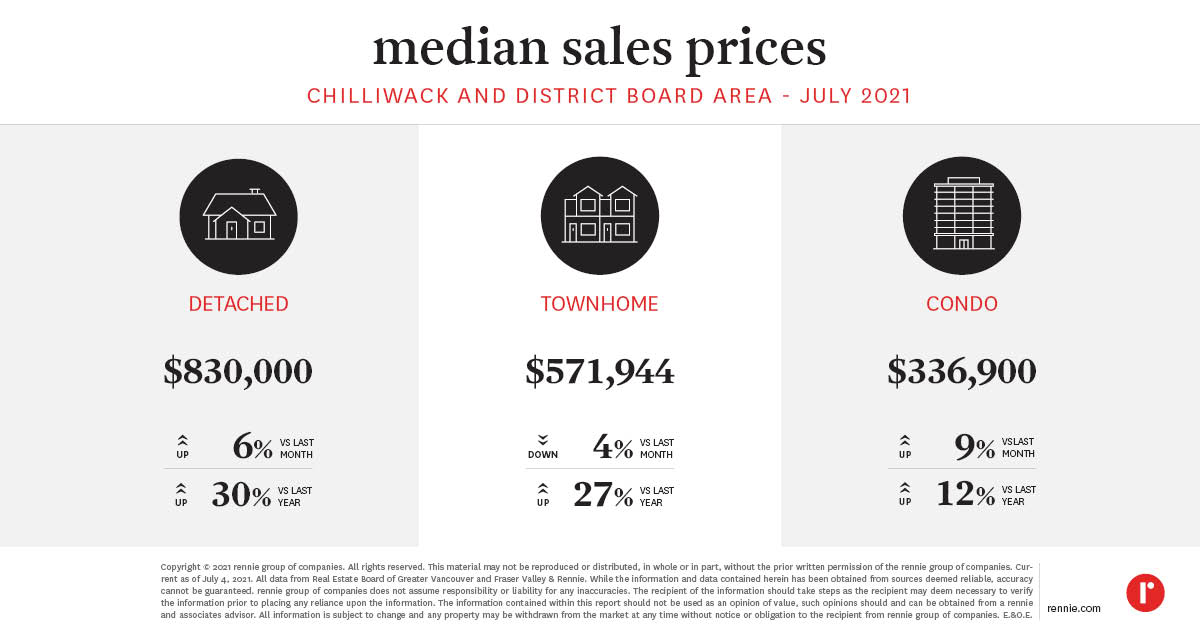 Note, the Chilliwack and District Board Area (CADREB) denotes the Median Sales Price rather than the Benchmark Price. The CADREB does not have a benchmark price available for record.
See Benchmark Prices Infographics for July 2021.
Our rennie intelligence team comprises our in-house demographer, senior economist, and market analysts. Together, they empower individuals, organizations, and institutions with data-driven market insight and analysis. Experts in urban land economics, community planning, shifting demographics, and real estate trends, their strategic research supports a comprehensive advisory service offering and forms the basis of frequent reports and public presentations. Their thoughtful and objective approach truly embodies the core values of rennie.
Written by
Related
For 40 consecutive months active listings in the Central Okanagan had been higher on a year-over-year basis. In February, that changed. Subdued new listings activity and a prolonged sales recovery could keep inventory below last year’s levels.
Mar 2026
Report
King County’s housing market saw increasing sales in February, beyond typical seasonality. Going forward, oil price shocks from the war in Iran present new inflation risks, which could prevent mortgage rates from falling any further.
Mar 2026
Report