Benchmark Prices - March 2022
Mar 08, 2022
Written by
Ryan BerlinSHARE THIS
Here are the latest Benchmark Price Infographics for the areas of Vancouver region.Greater Vancouver Board Area Burnaby East
 Burnaby North
 Burnaby South
 Coquitlam
 North Vancouver
 Richmond
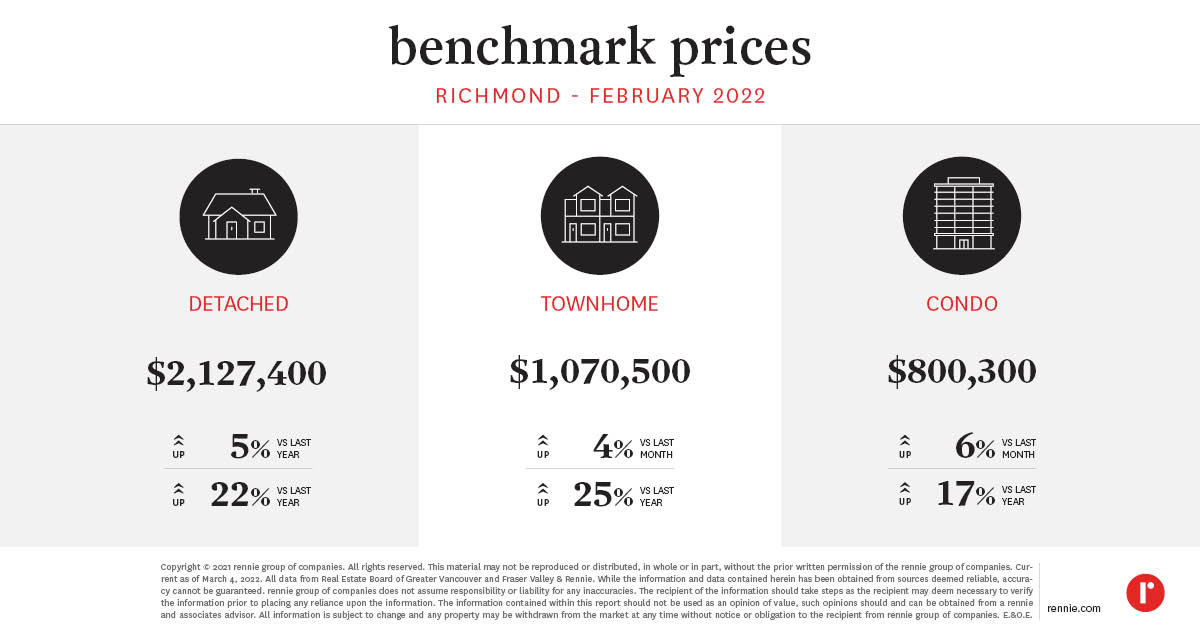 Vancouver East
 Vancouver West
 West Vancouver
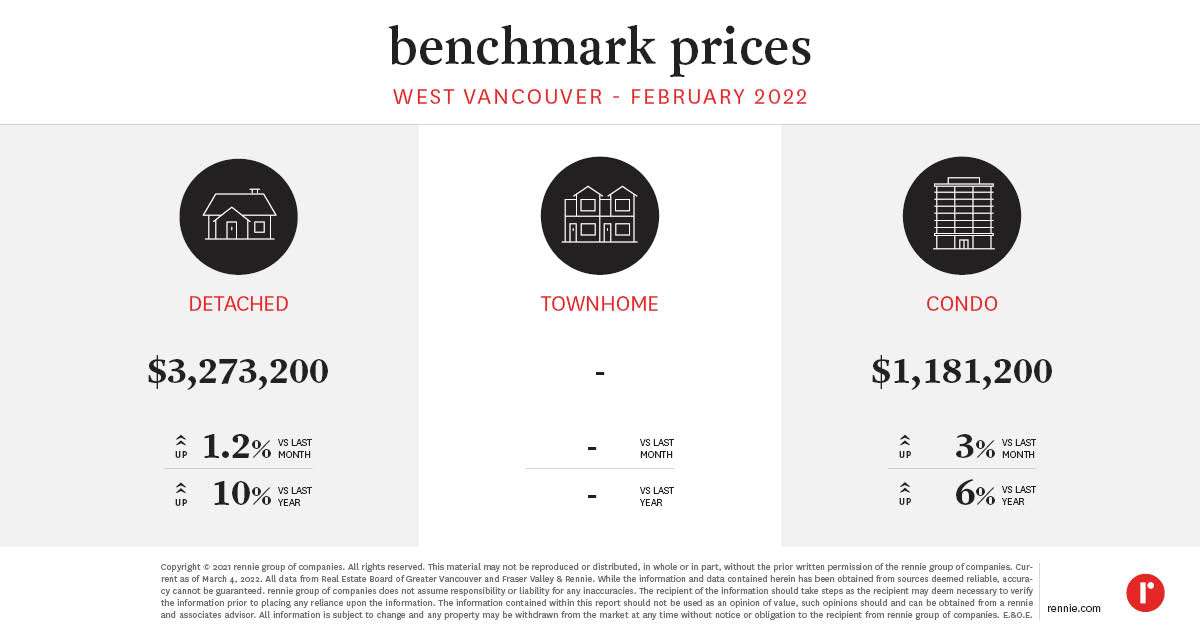 New Westminster
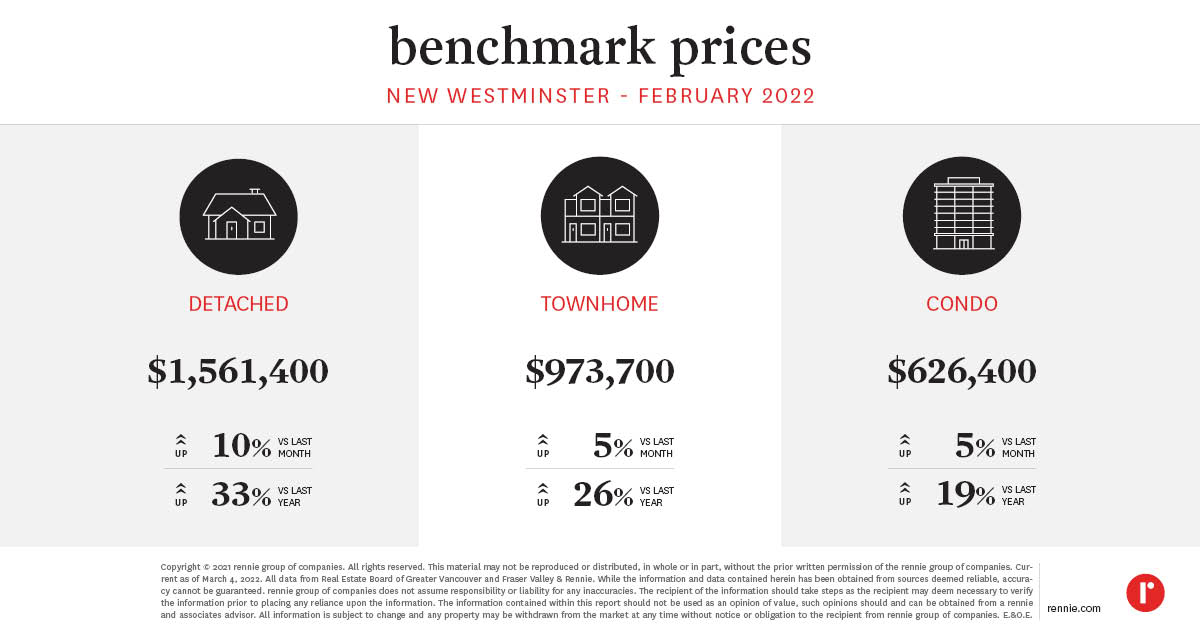 Squamish
 Tsawwassen
 Port Coquitlam
 Port Moody
 Fraser Valley Board Area
 Surrey
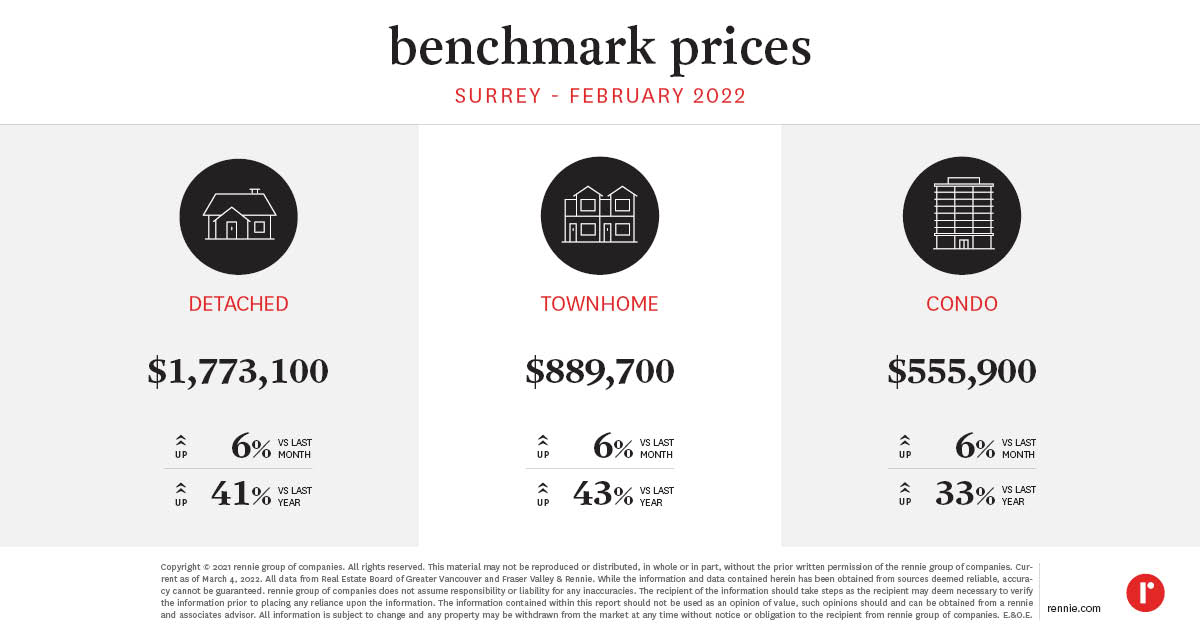 Langley
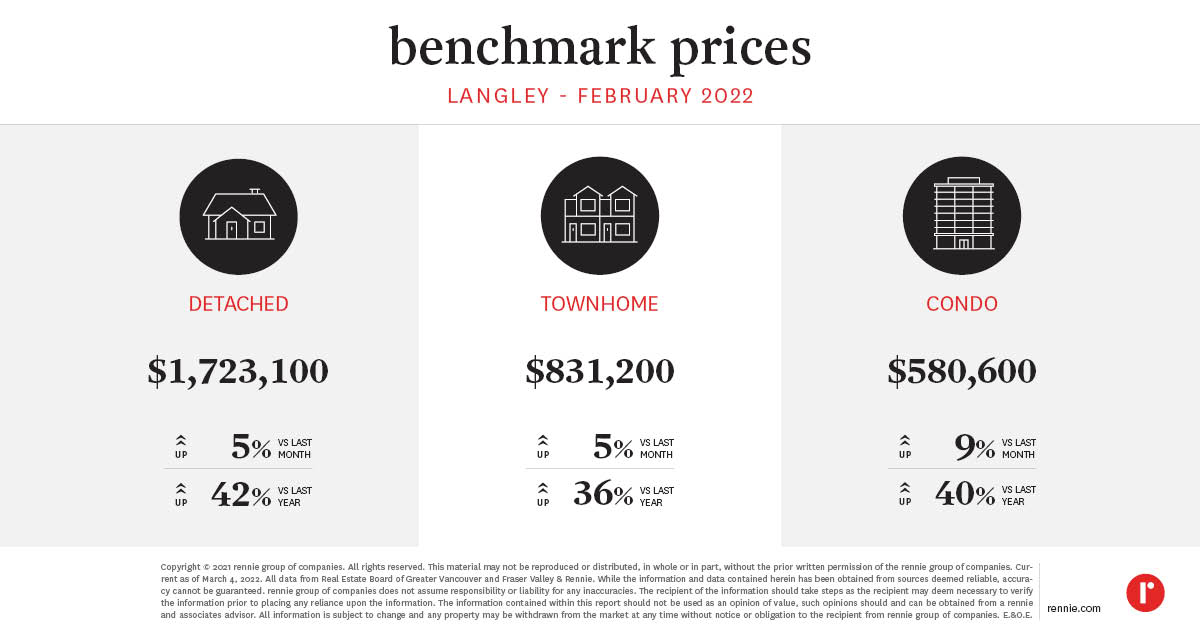 Pitt Meadows
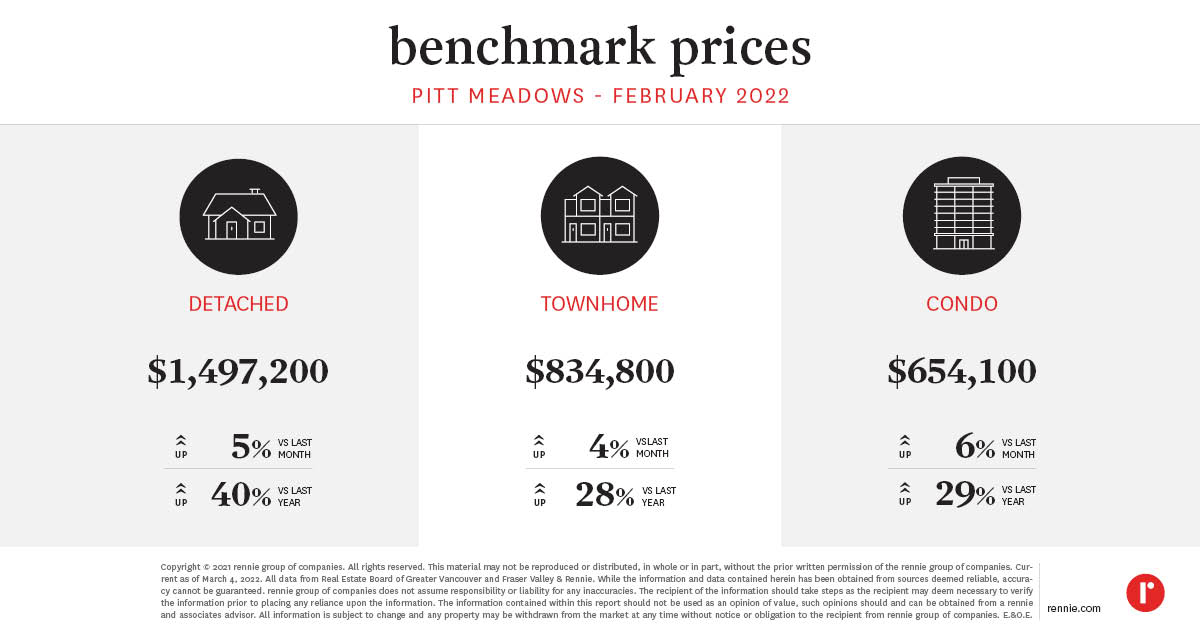 Maple Ridge
 White Rock
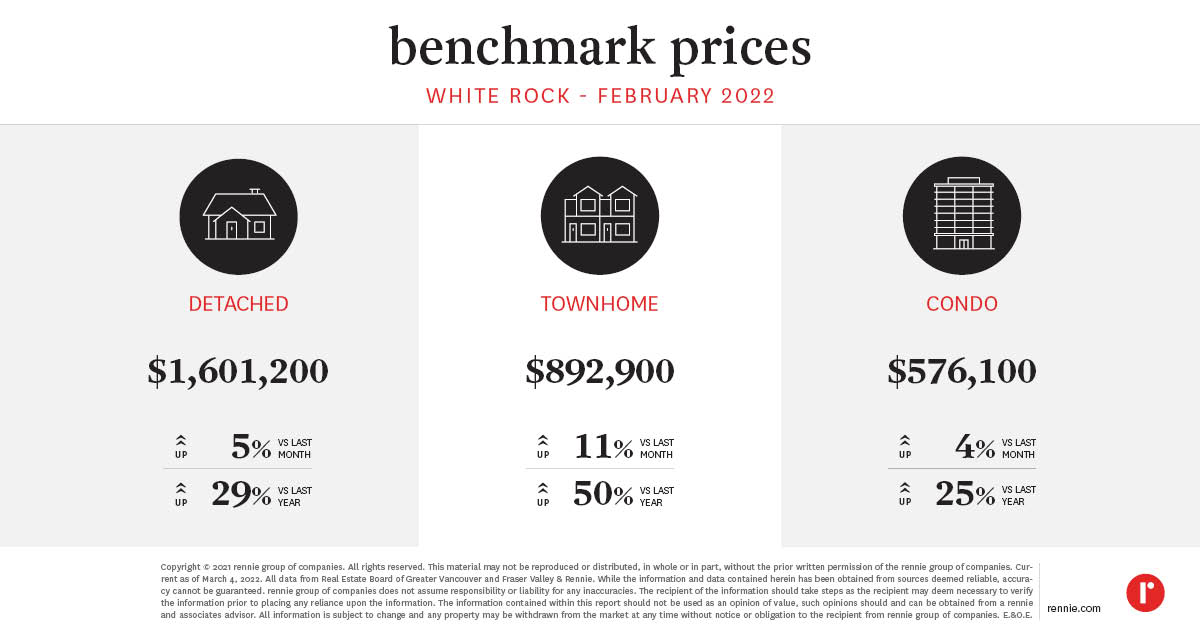 Abbotsford
 Chilliwack and District Board Area
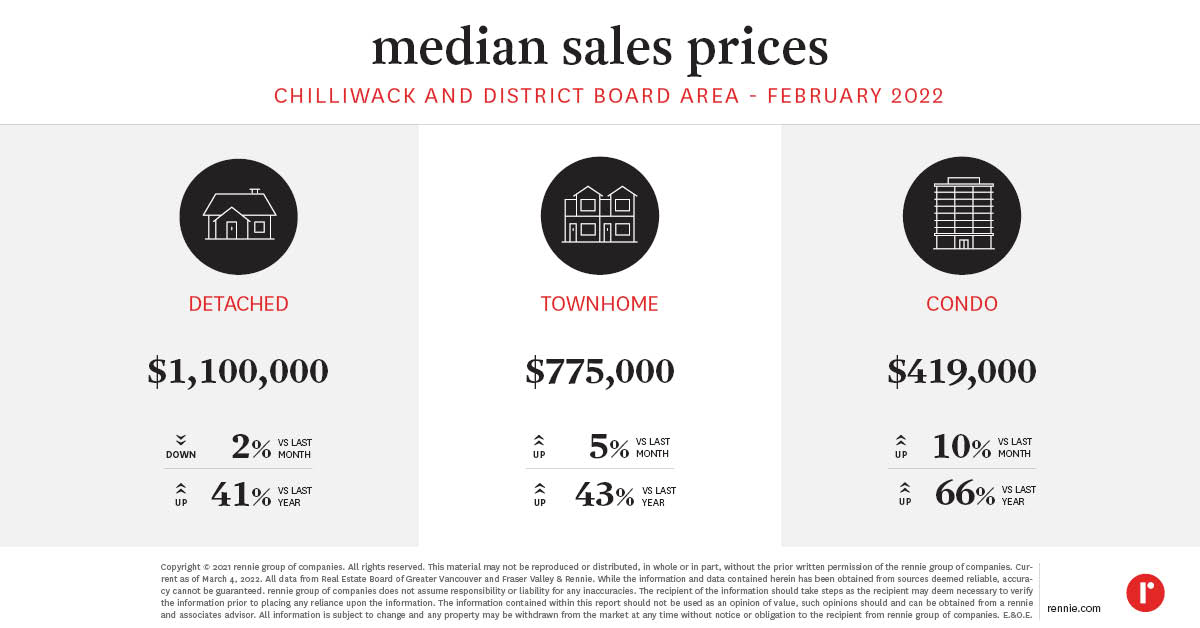 Note, the Chilliwack and District Board Area (CADREB) denotes the Median Sales Price rather than the Benchmark Price. The CADREB does not have a benchmark price available for record.See Benchmark Prices Infographics for February 2022. Our rennie intelligence team comprises our in-house demographer, senior economist, and market analysts. Together, they empower individuals, organizations, and institutions with data-driven market insight and analysis. Experts in urban land economics, community planning, shifting demographics, and real estate trends, their strategic research supports a comprehensive advisory service offering and forms the basis of frequent reports and public presentations. Their thoughtful and objective approach truly embodies the core values of rennie.
Written by
Related
The Central Okanagan started the year with significantly fewer sales than January 2025, though they were still quite a bit higher than the two Januarys before that. Meanwhile, this was the second busiest January for new listings since 2010, and active listings ended the month at their highest level for a January since 2014.
Feb 2026
Report
Sales activity in Greater Victoria started the year a lot like it ended the last—down year-over-year and well below long-run monthly average levels. With inventory at its highest level for January since 2015, all home types have slipped into balanced market conditions.
Feb 2026
Report