Last month we said February had the potential to be a watershed moment for Greater Vancouver’s real estate market. Well, it’s looking like things are playing out as we expected. March gave us a dose of Madness with sales firmly on the comeback trail and sagging inventories, benchmark prices were on their way up again for all product types. To the degree that sales continue to grow in the face of low inventories, we are not expecting March to go out like a lamb.
As we do every month, the rennie team has prepared this Market Update to assist you in deciphering these changing conditions for your clients.
Key points include:
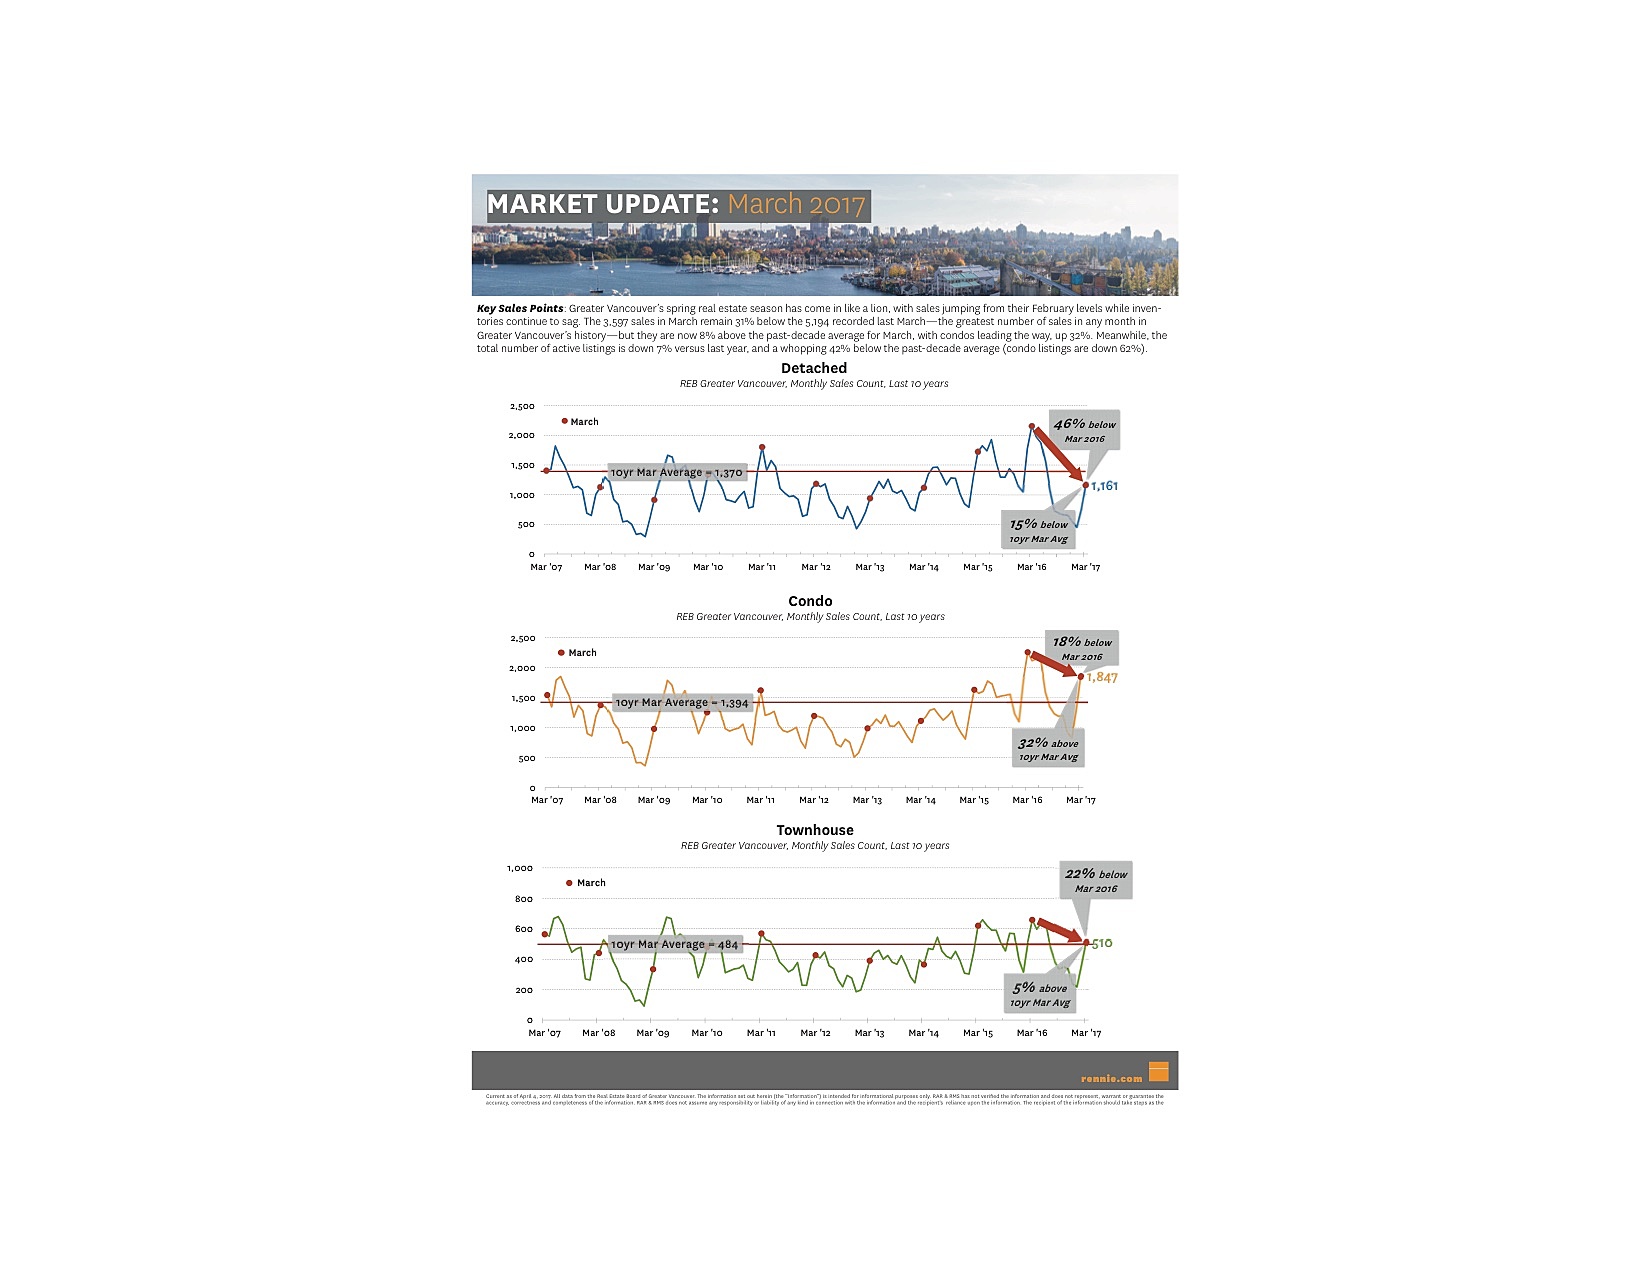
Sales & Active Listings: Sales have jumped from their February levels while inventories continue to sag. The 3,597 sales in March remain 31% below the 5,194 recorded last March—the greatest number of sales in any month in Greater Vancouver’s history—but they are now 8% above the past-decade average for March, with condos leading the way, up 32%. Meanwhile, the total number of active listings is down 7% versus last year, and a whopping 42% below the past-decade average (condo listings are down 62%). This time of year does typically bring with it a bump in activity: over the past decade, there has been an increase of 24% in the number of sales between February and March, while inventories have historically grown by 7%. But after the obscene amount of rain, snow, and ice that accompanied our most recent winter, itself on the heels of unprecedented government market intervention, sales surged by 48% between February and March of this year...and the number of active listings dropped by 3%.
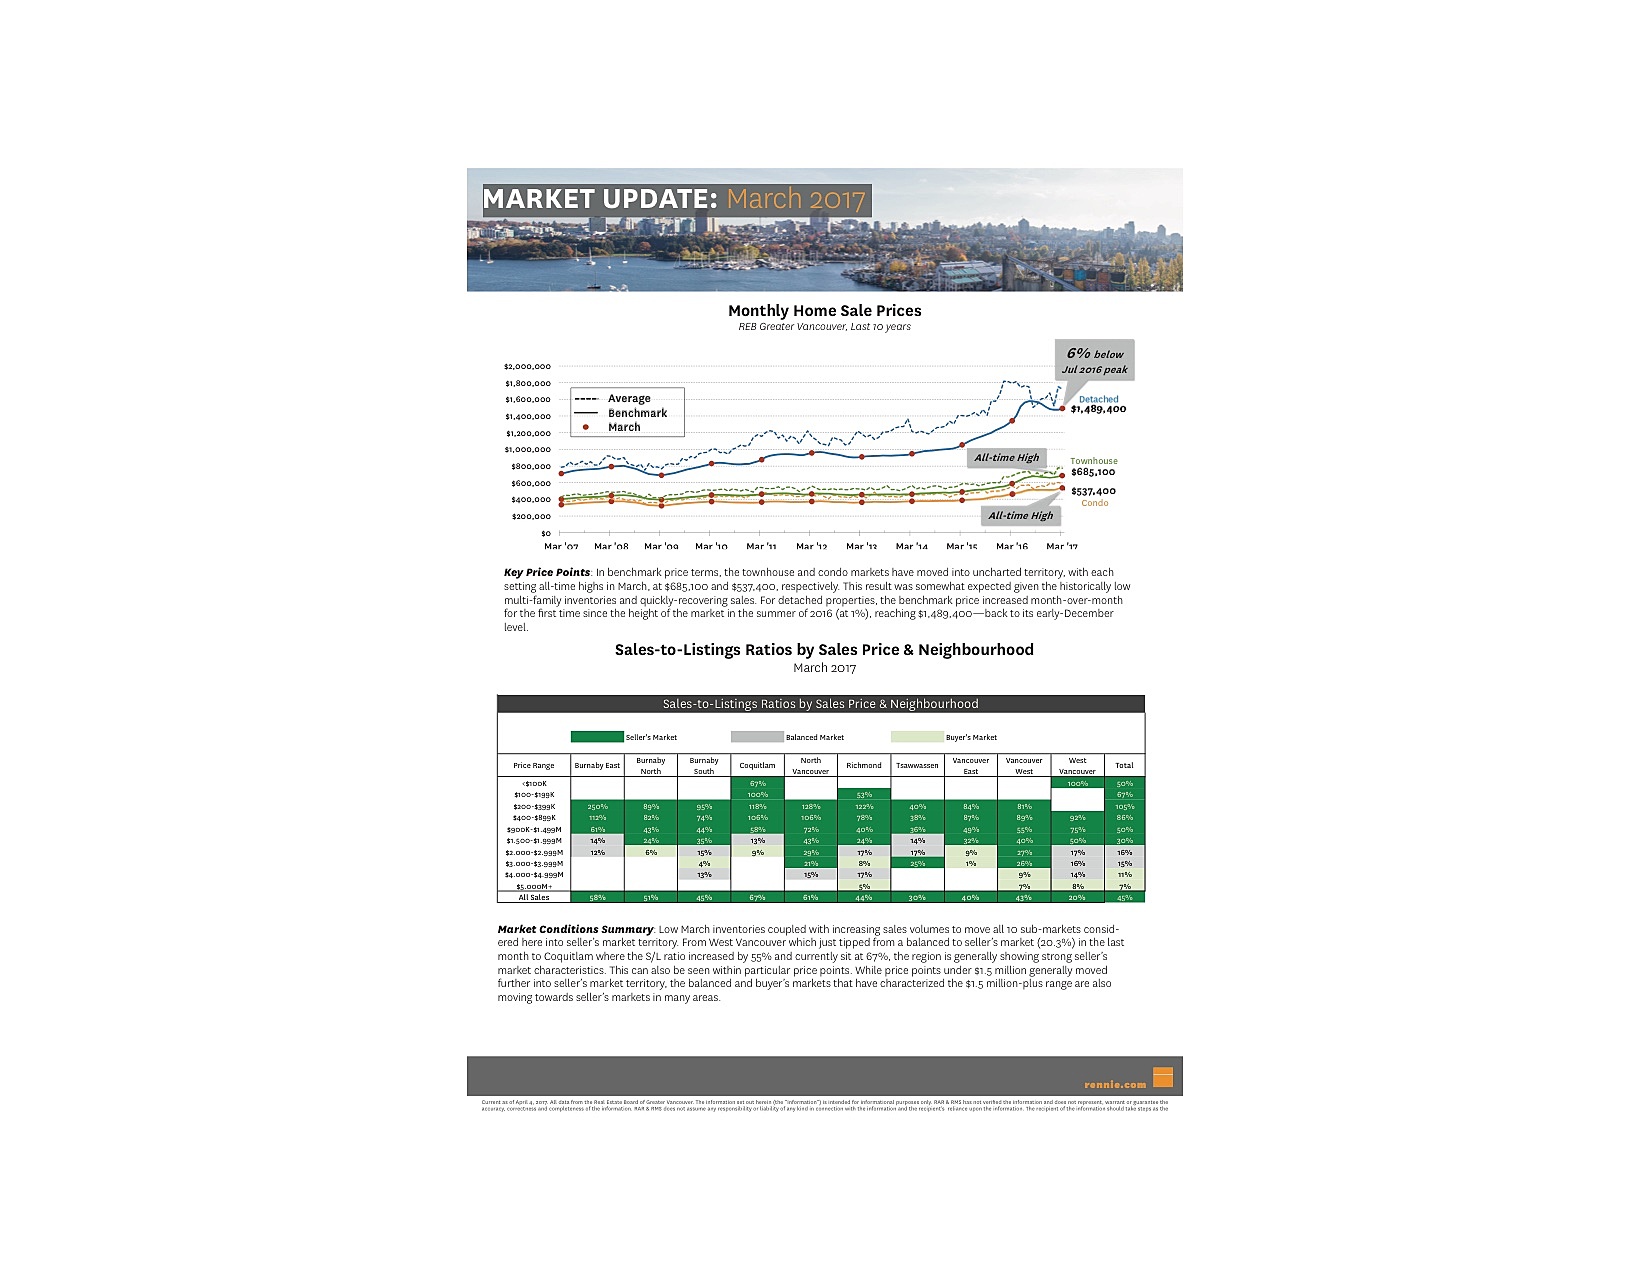
Sales Prices: In benchmark price terms, the townhouse and condo markets have moved into uncharted territory, with each setting all-time highs in March, at $685,100 and $537,400, respectively. This result was somewhat expected given the historically low multi-family inventories and quickly-recovering sales. For detached properties, the benchmark price increased month-over-month for the first time since the height of the market in the summer of 2016 (at 1%), reaching $1,489,400—back to its early-December level.
Market Conditions: Low March inventories coupled with increasing sales volumes to move all 10 sub-markets considered here into seller’s market territory. Seller’s markets are also characterizing a greater number of price points. While those under $1.5 million generally moved further into seller’s market territory, the balanced and buyer’s markets that have characterized the $1.5 million-plus range are also shifting towards seller’s markets in many sub-markets.
Click the button below to download the PDF and see more details.
Thank you,
Your rennie Team