Benchmark Prices - May 2022
May 09, 2022
Written by
Ryan BerlinSHARE THIS
Here are the latest Benchmark Price Infographics for the areas of Vancouver region.Greater Vancouver Board Area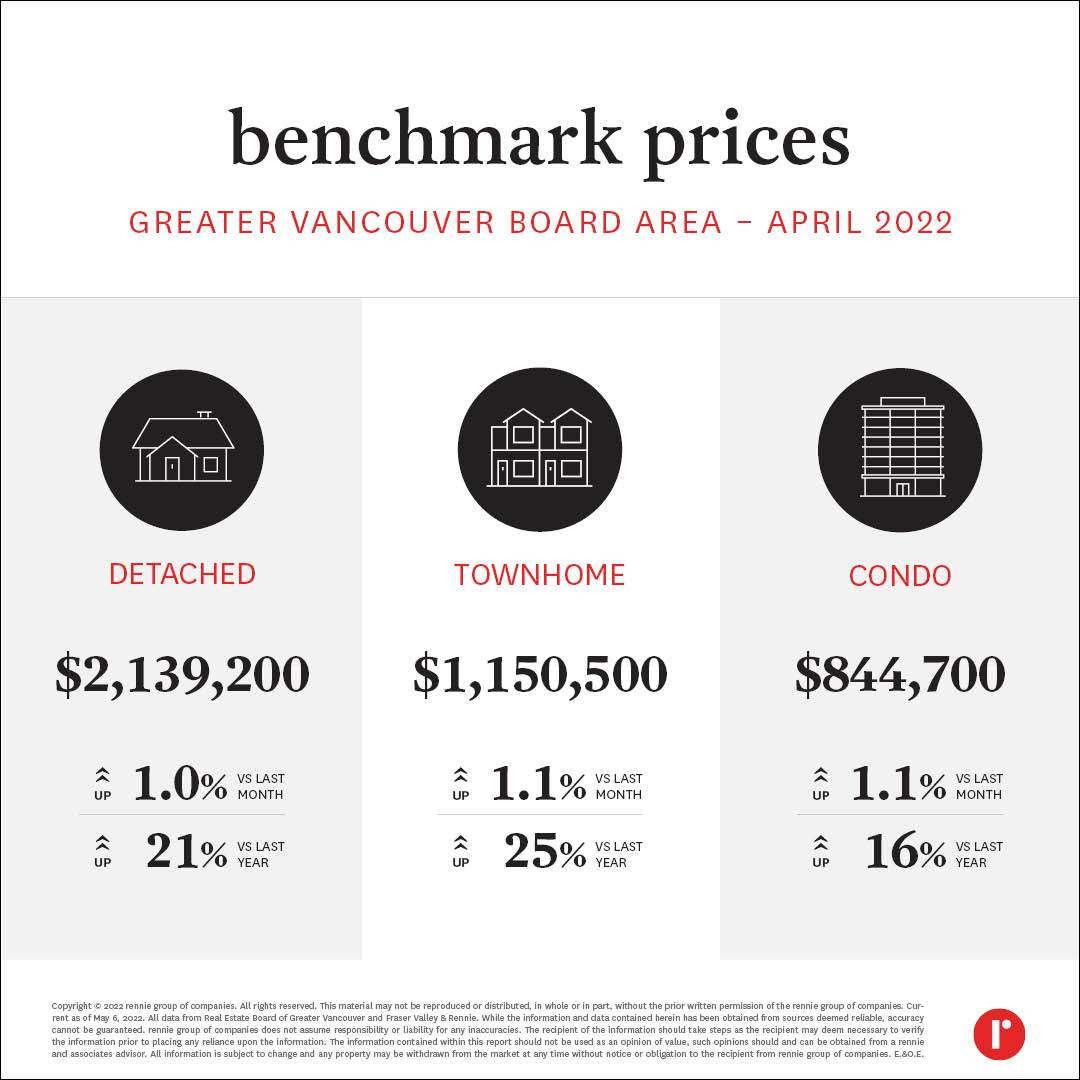 Burnaby East
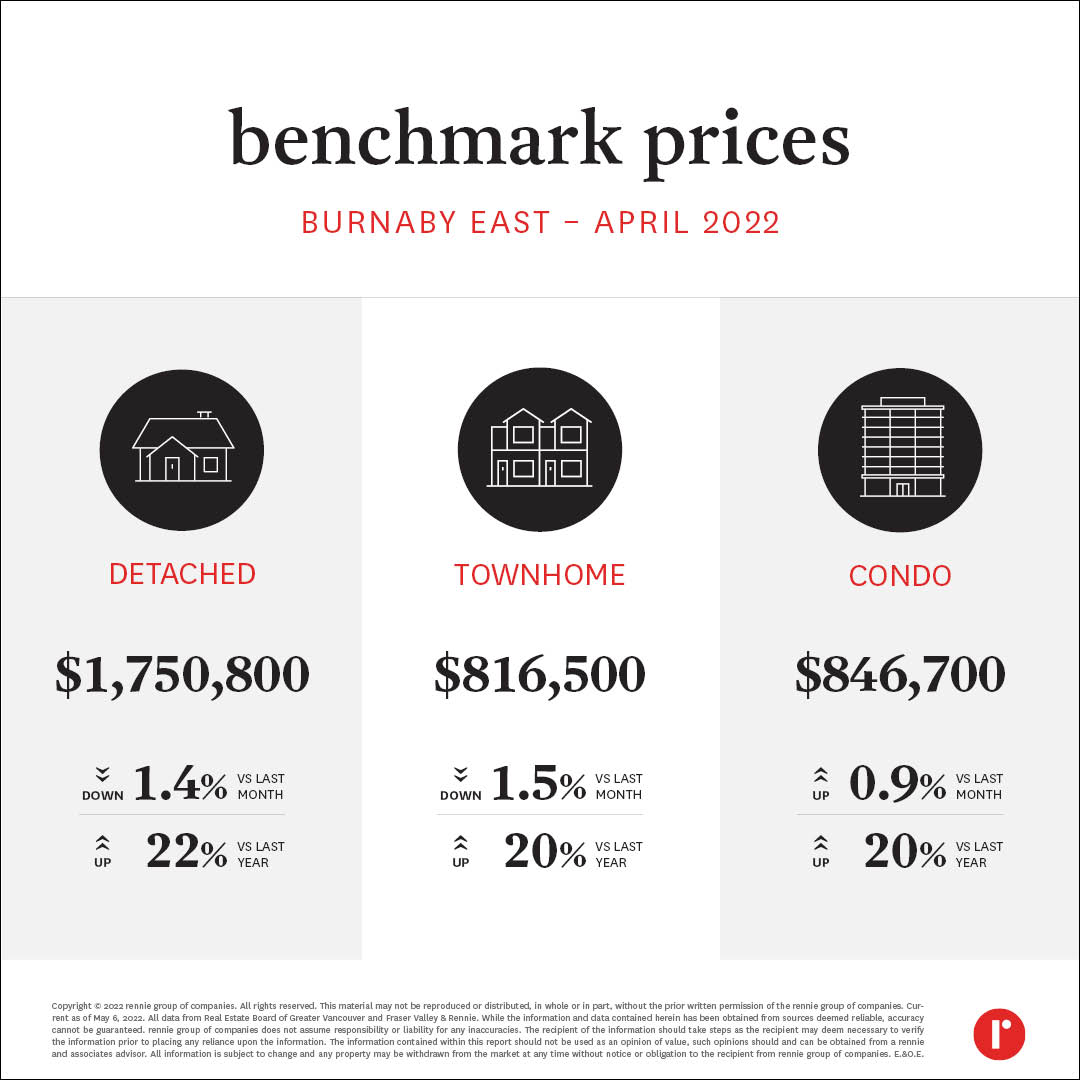 Burnaby North
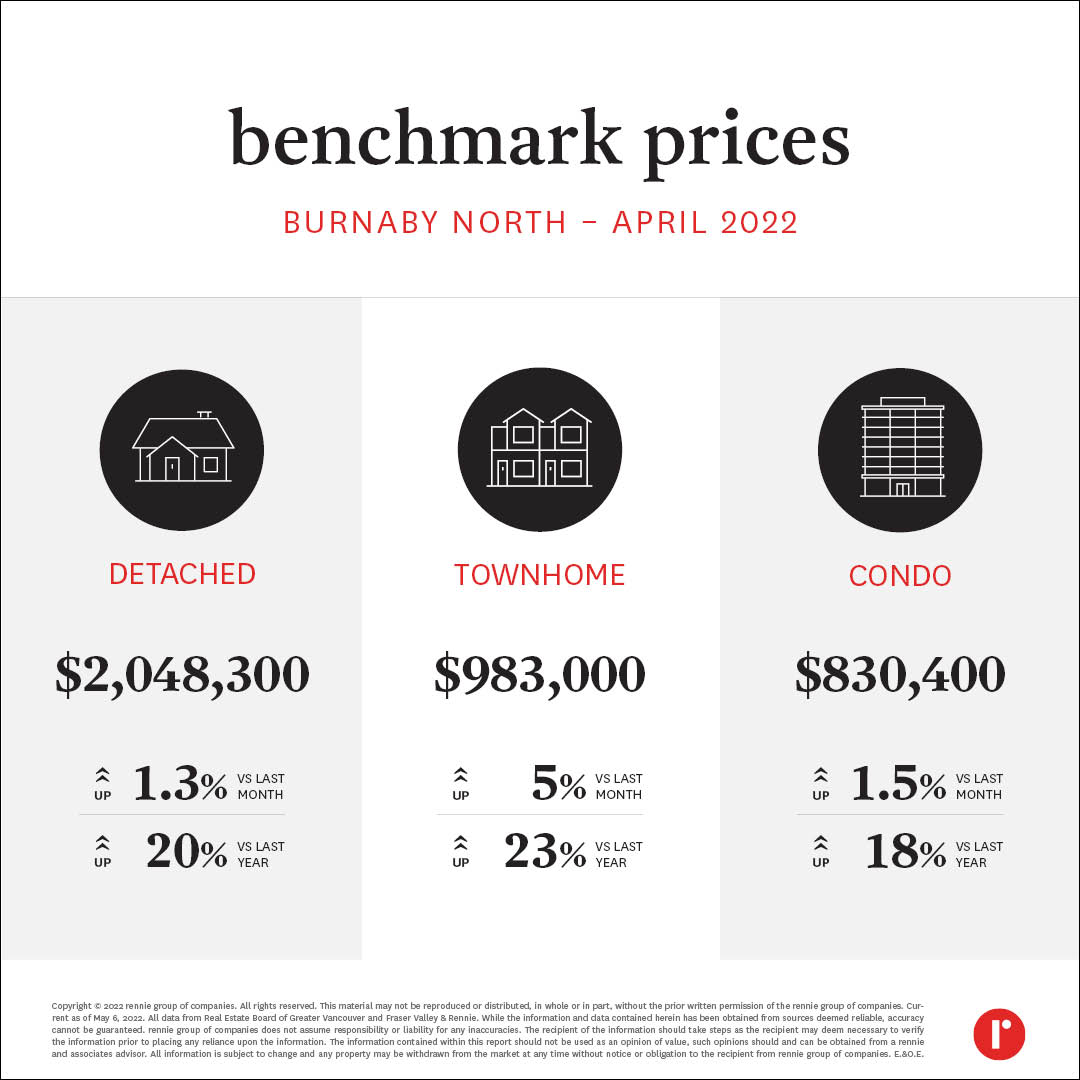 Burnaby South
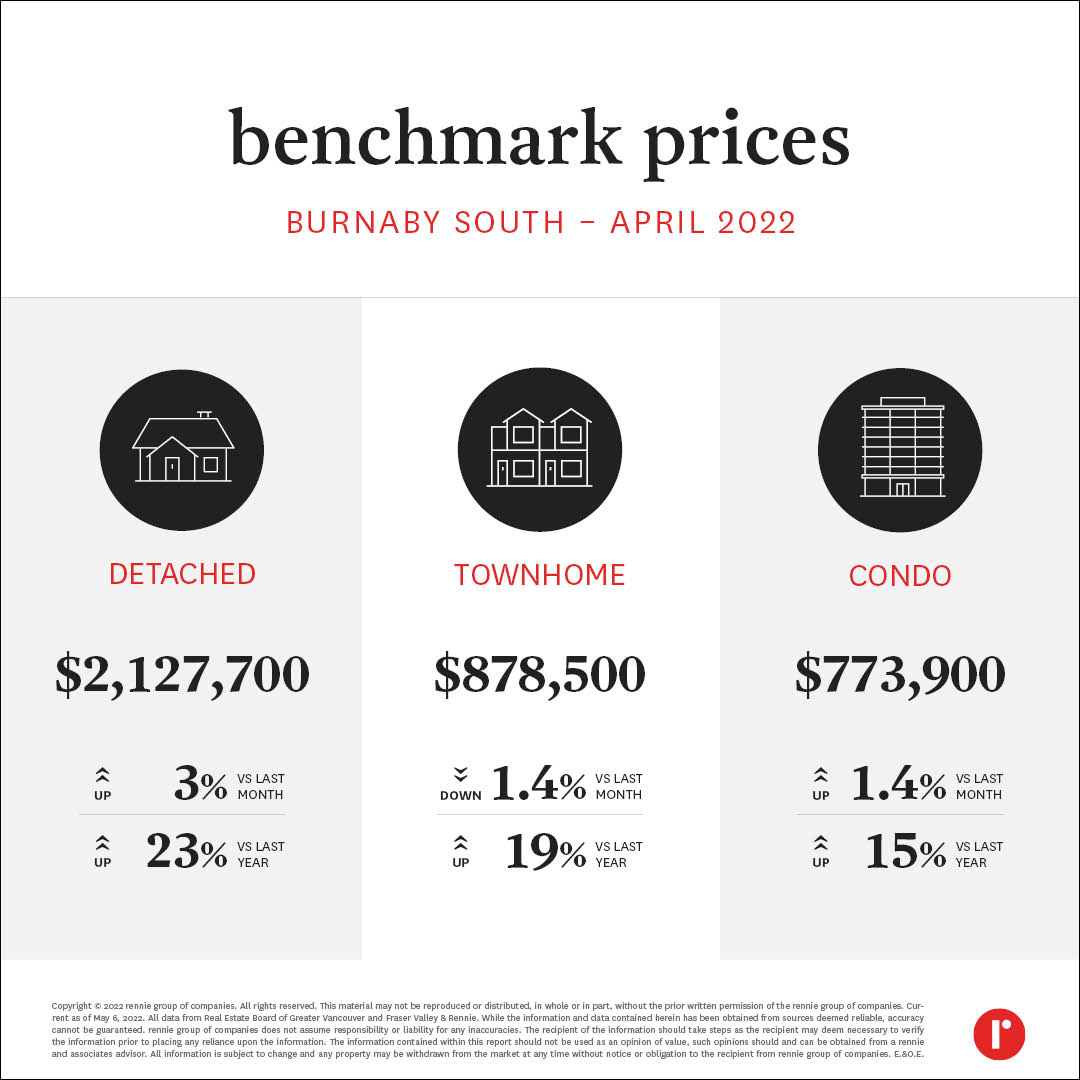 Coquitlam
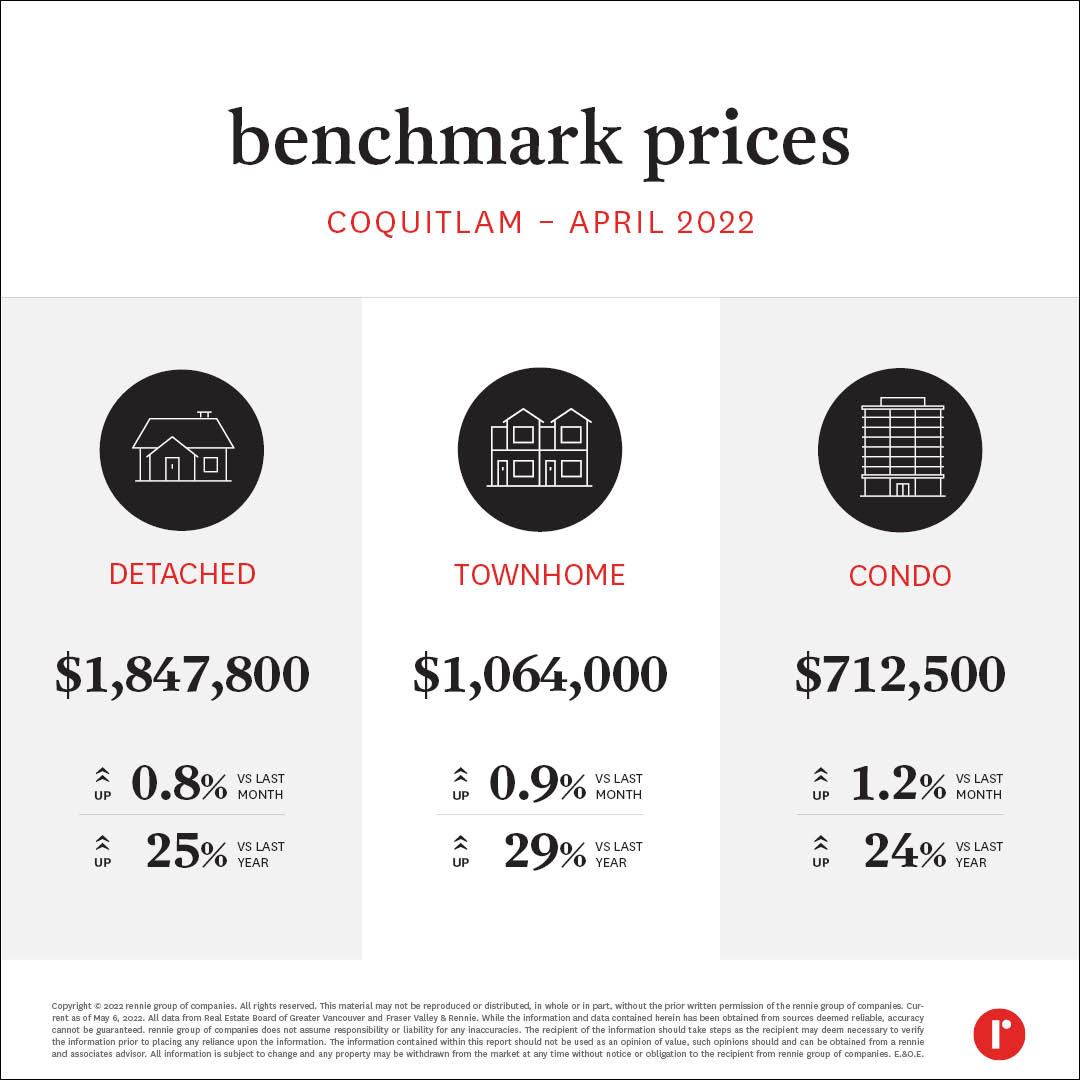 North Vancouver
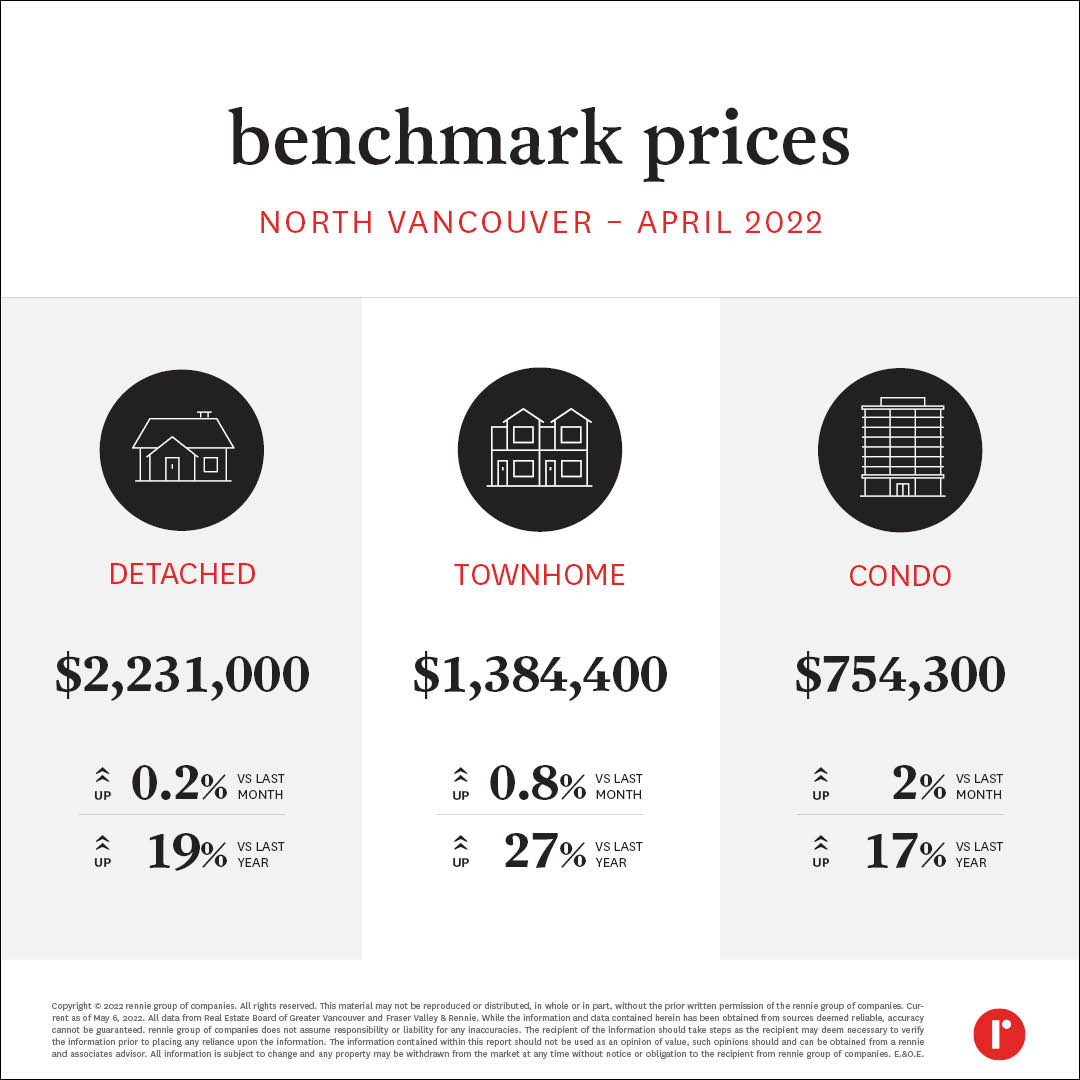 Richmond
 Vancouver East
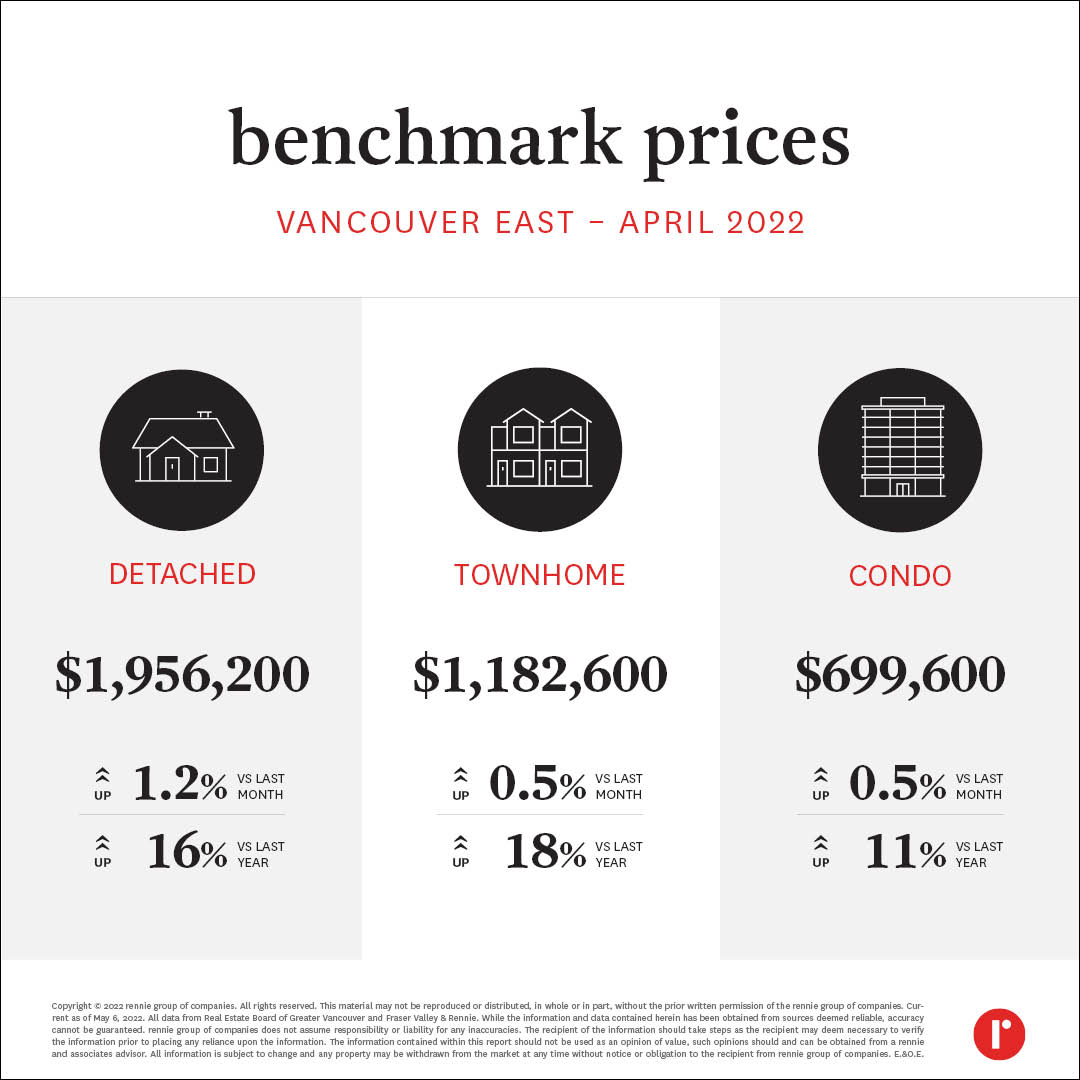 Vancouver West
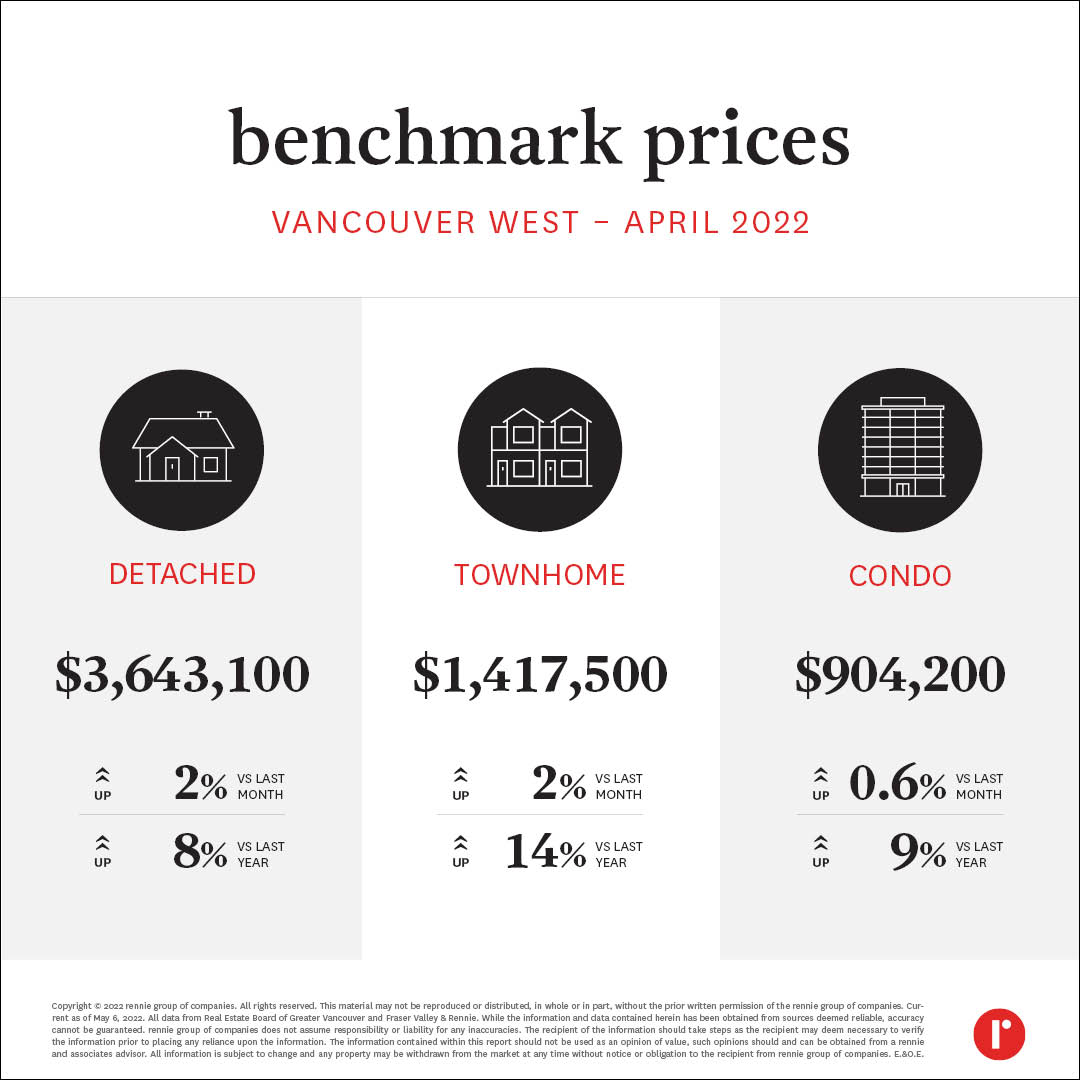 West Vancouver
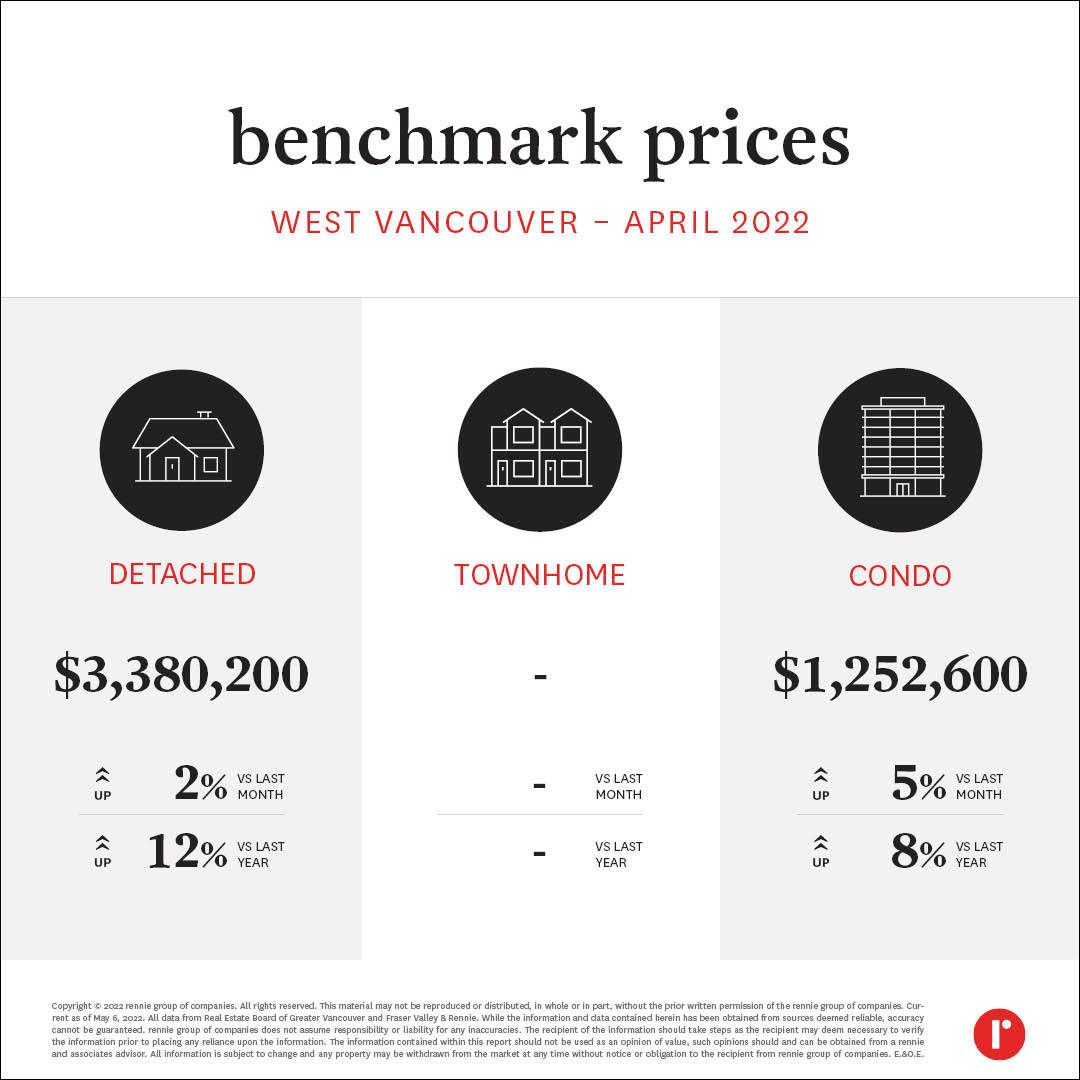 New Westminster
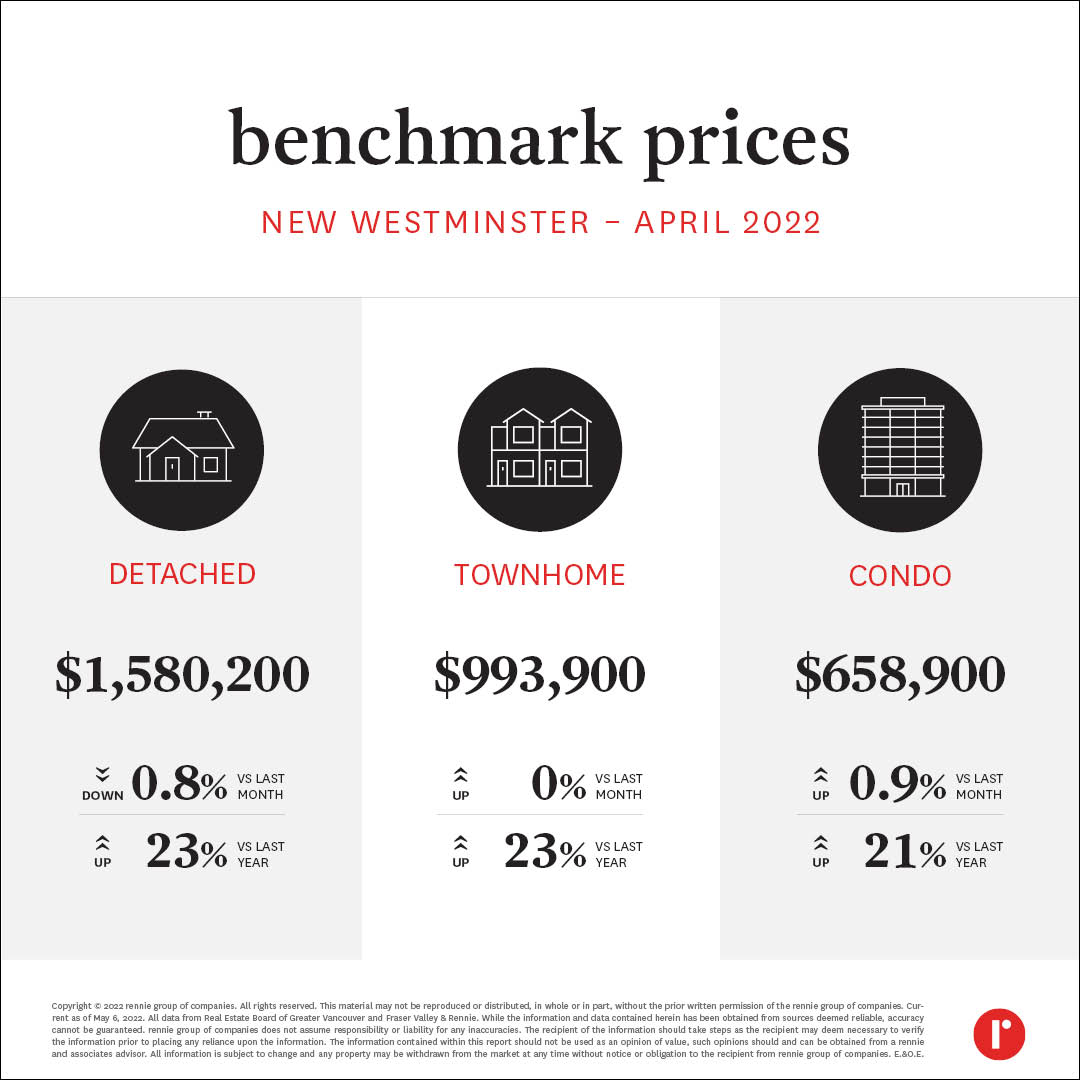 Squamish
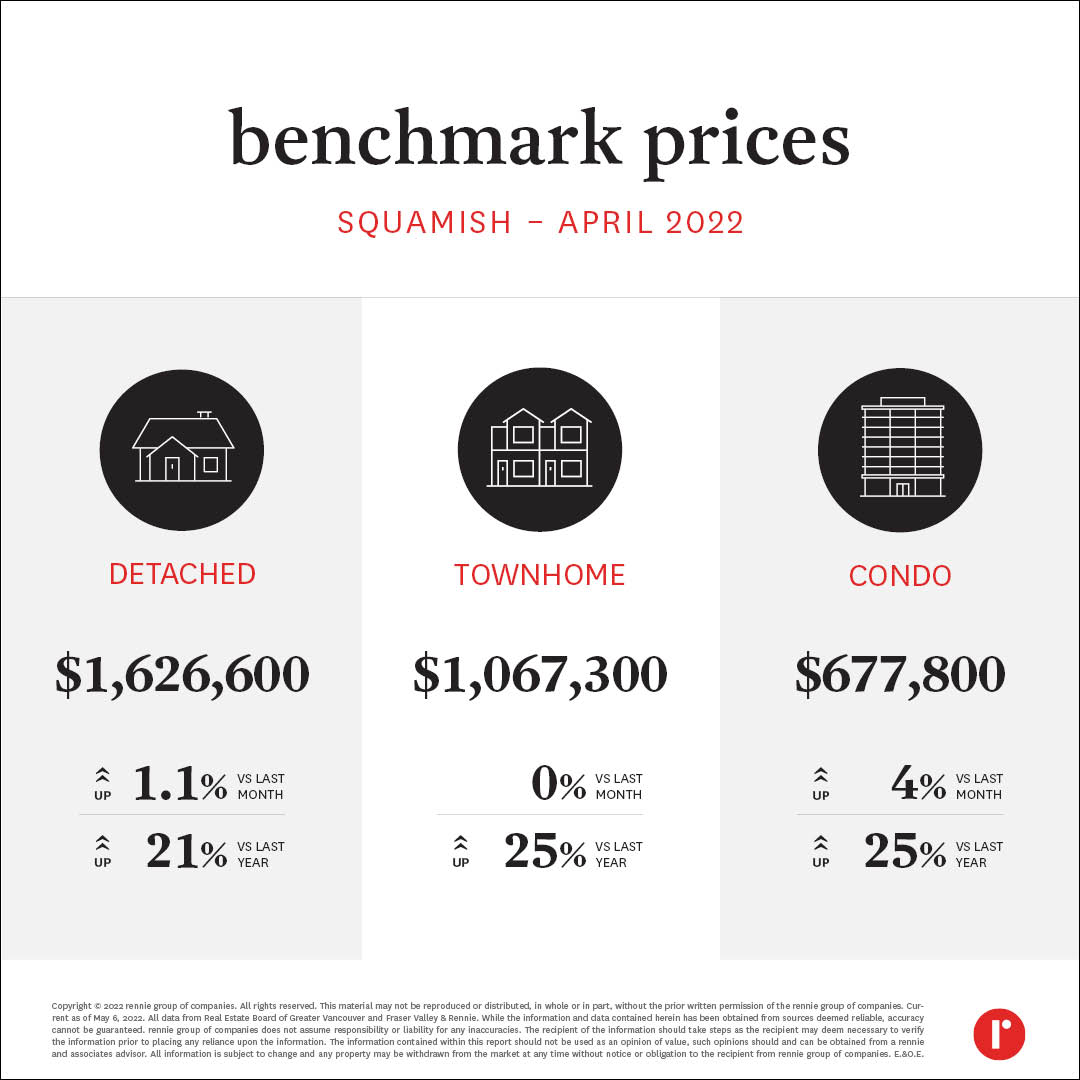 Tsawwassen
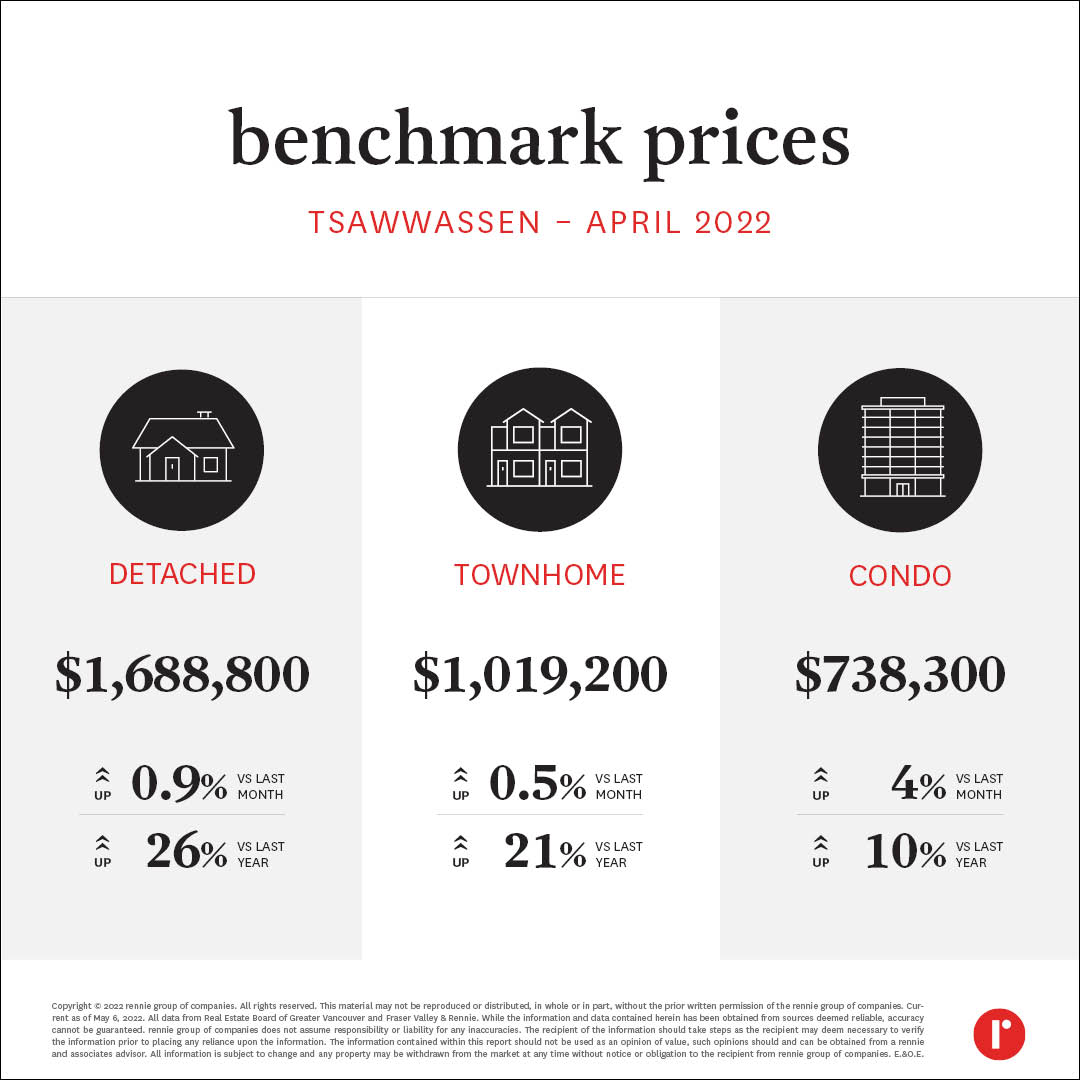 Port Coquitlam
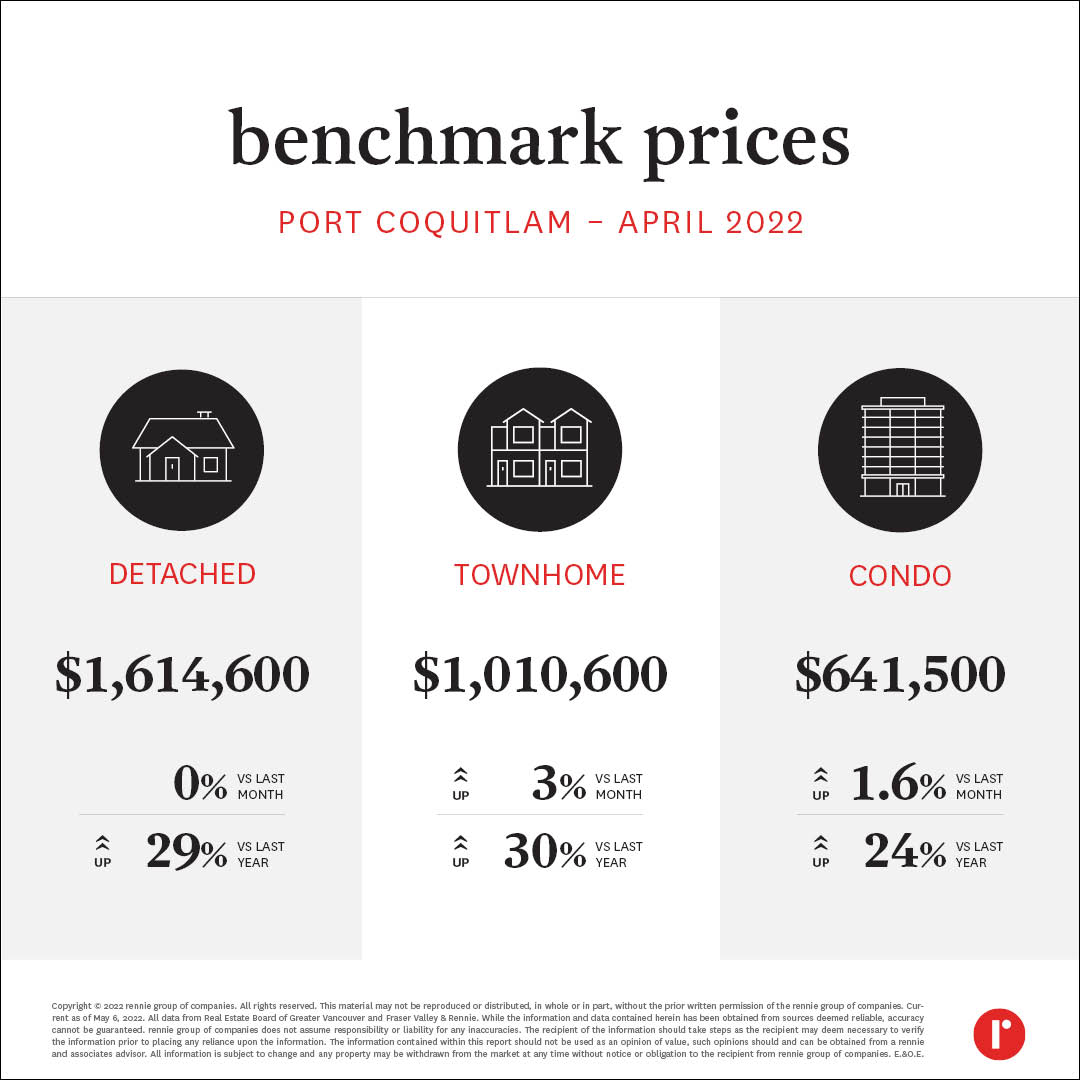 Port Moody
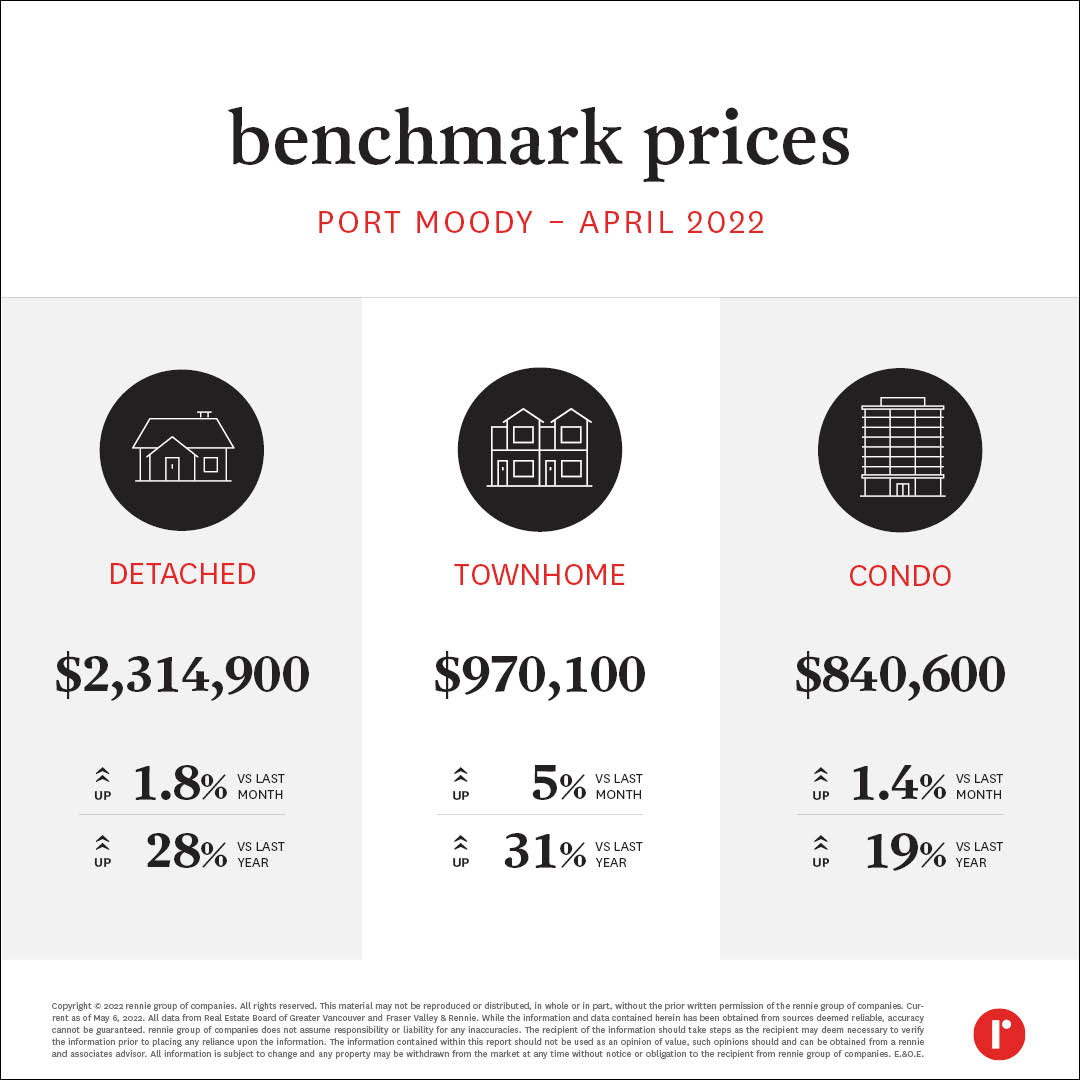 Fraser Valley Board Area
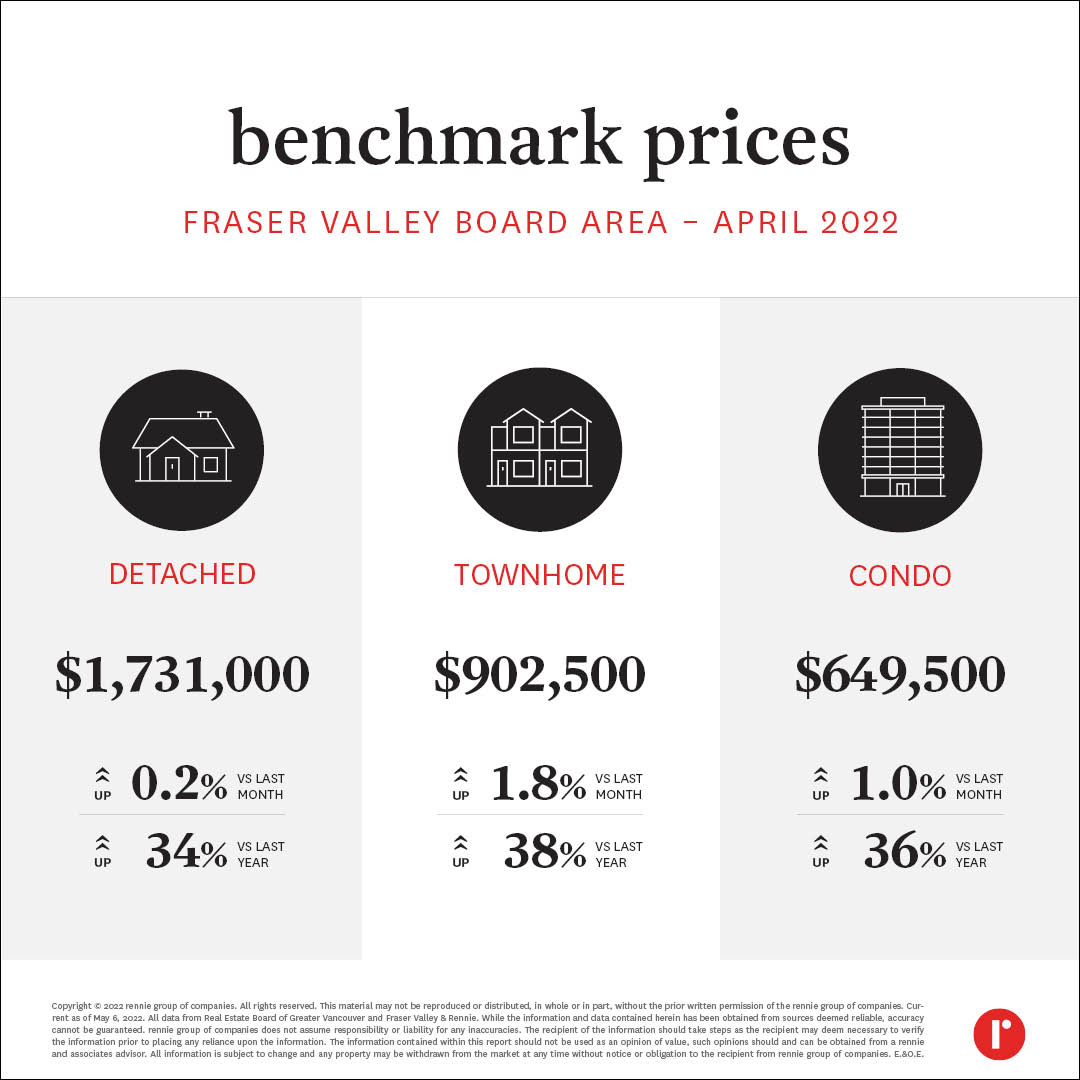 Surrey
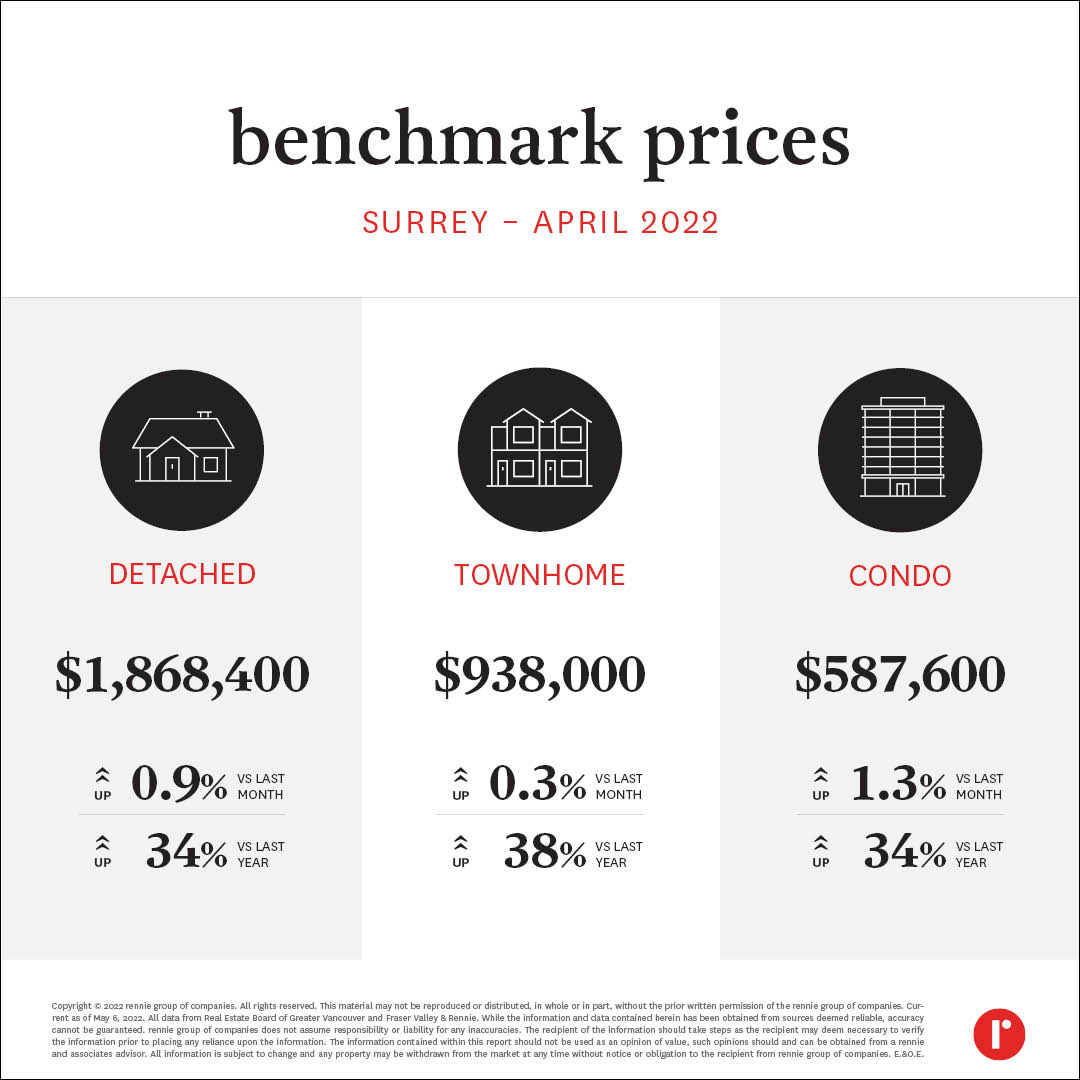 Langley
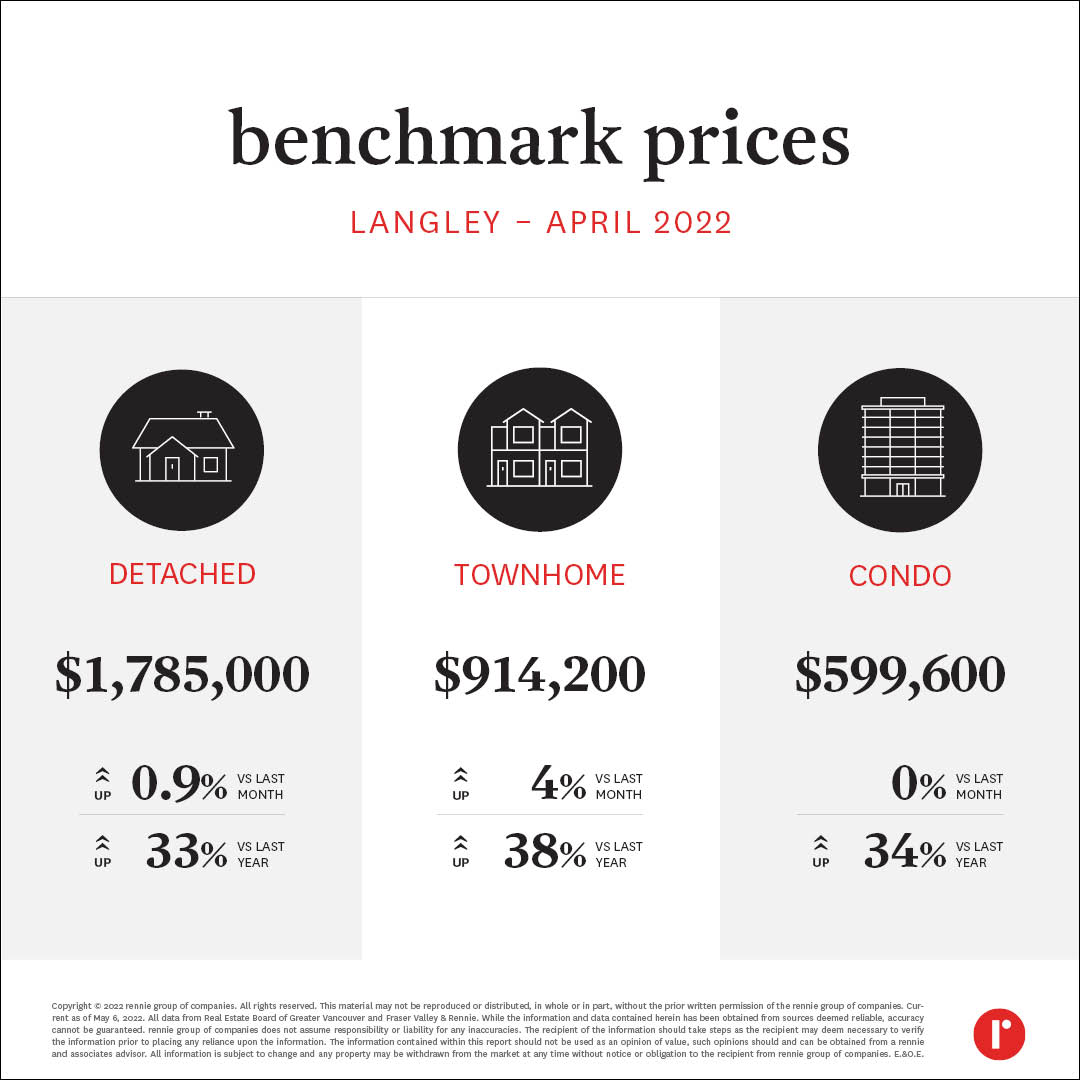 Pitt Meadows
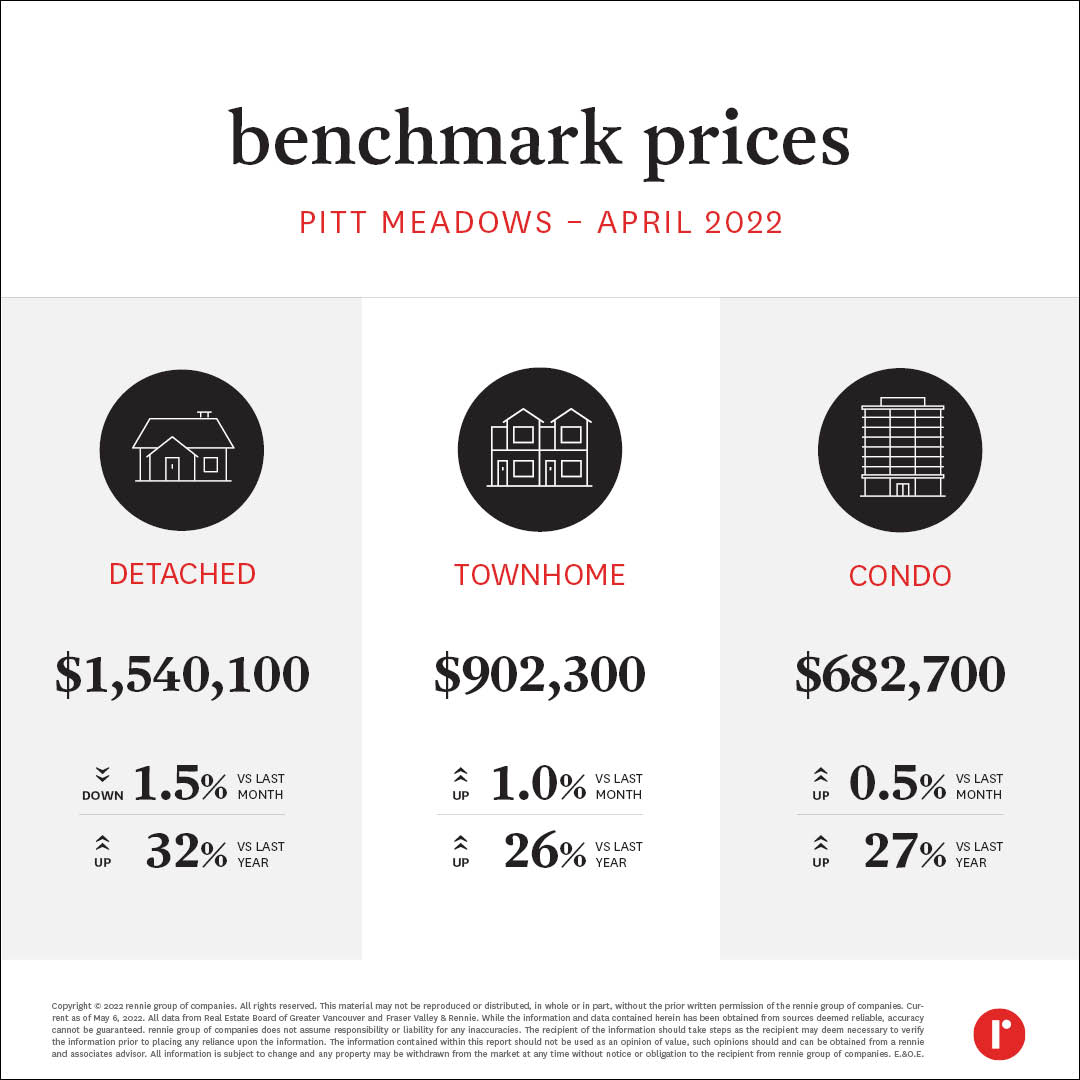 Maple Ridge
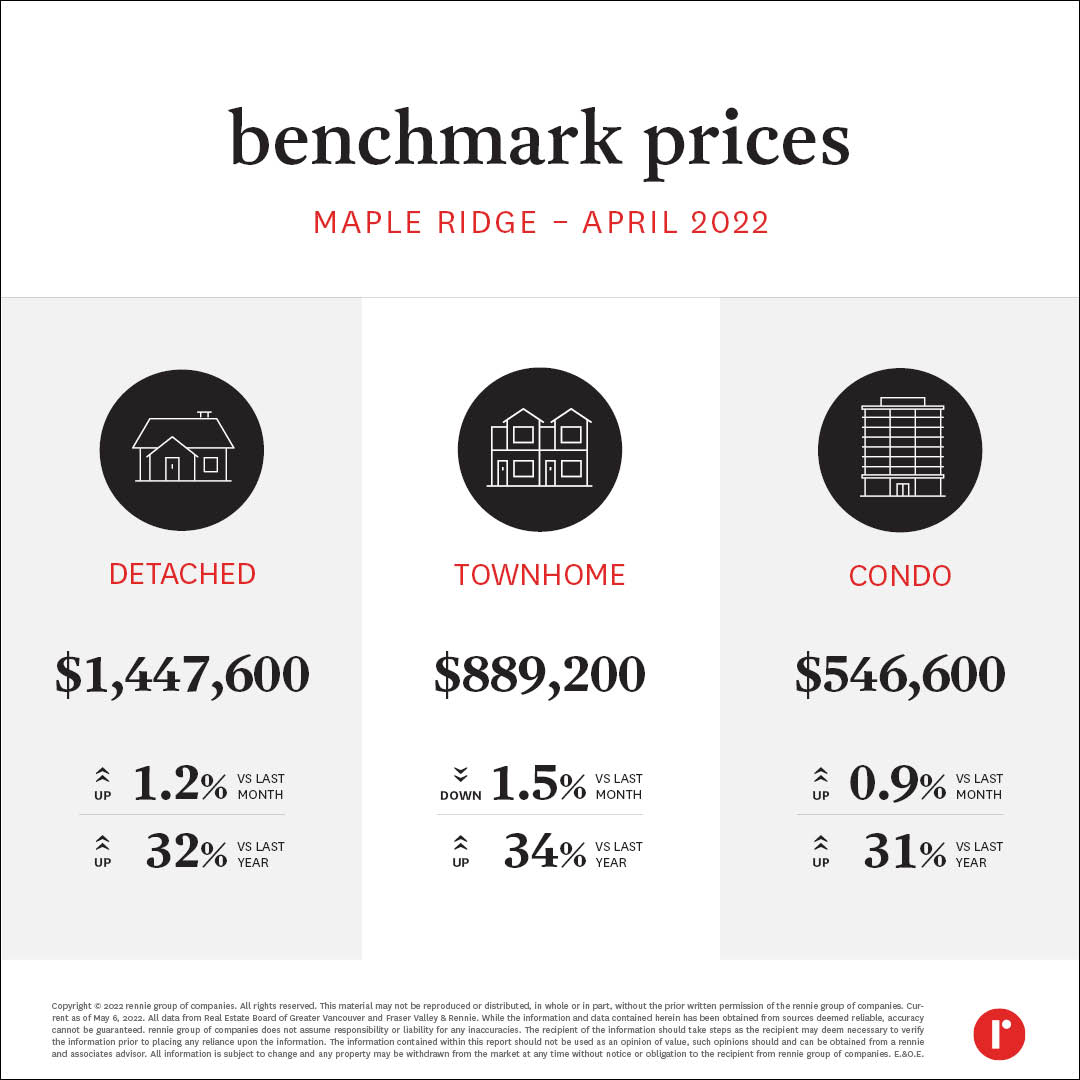 White Rock
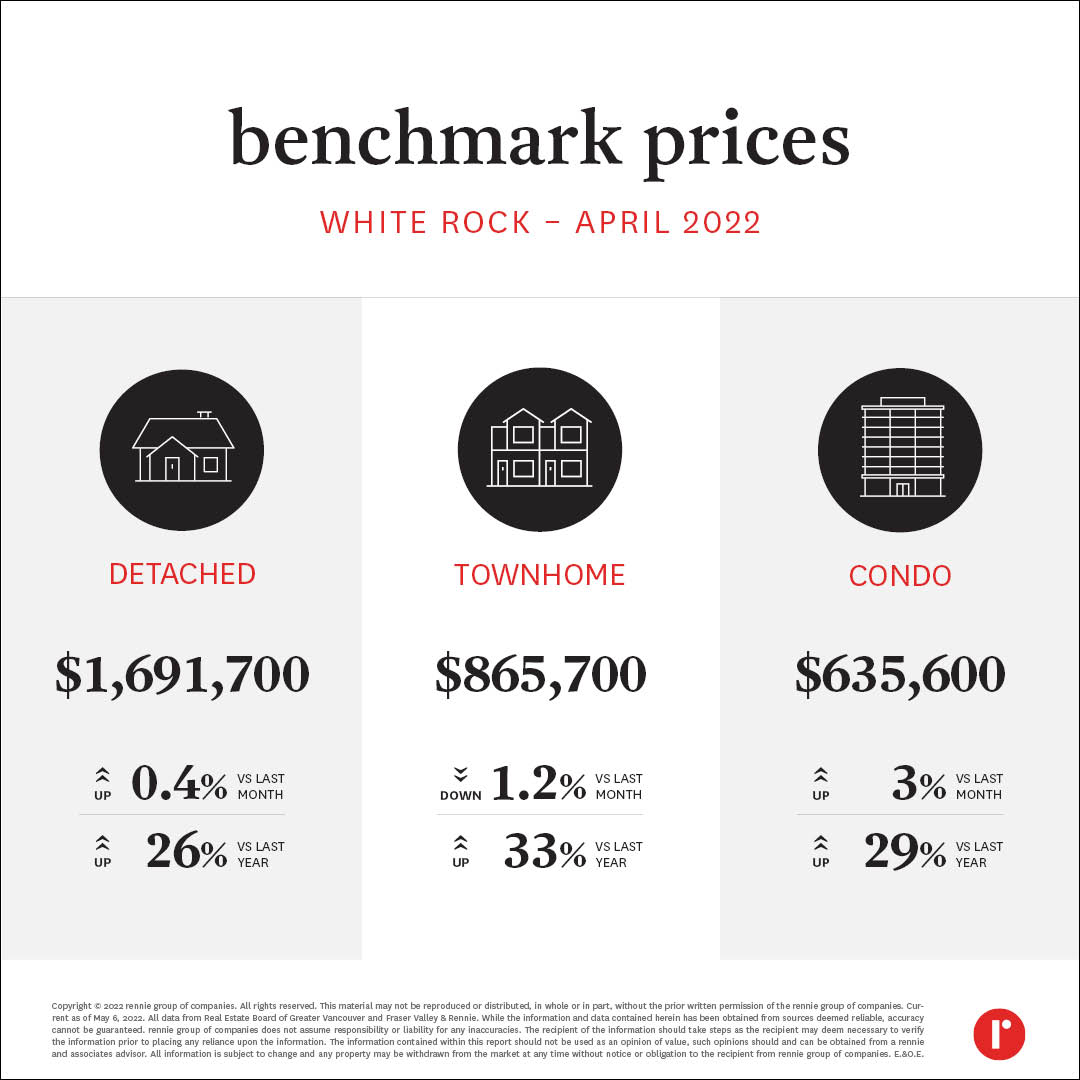 Abbotsford
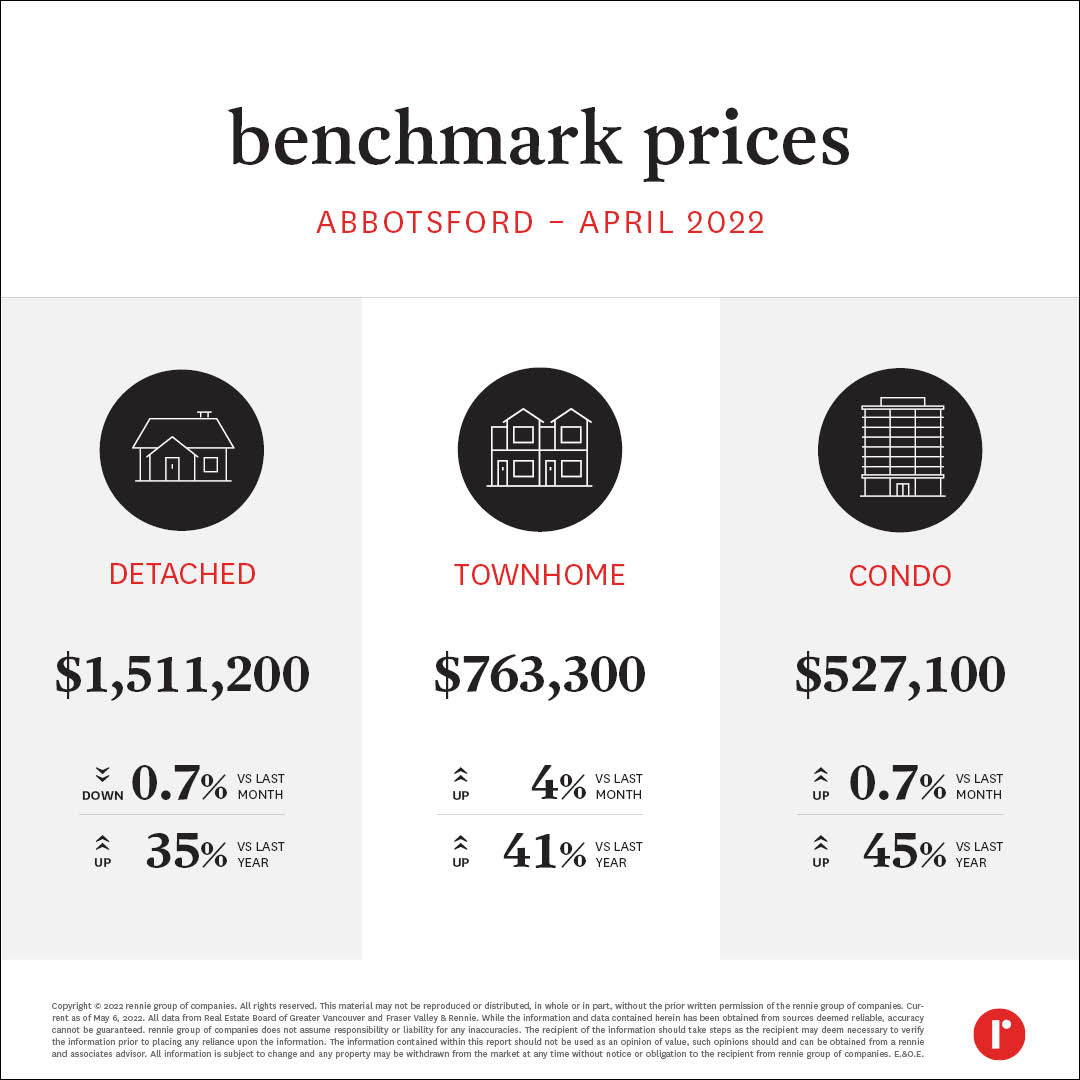 Chilliwack and District Board Area
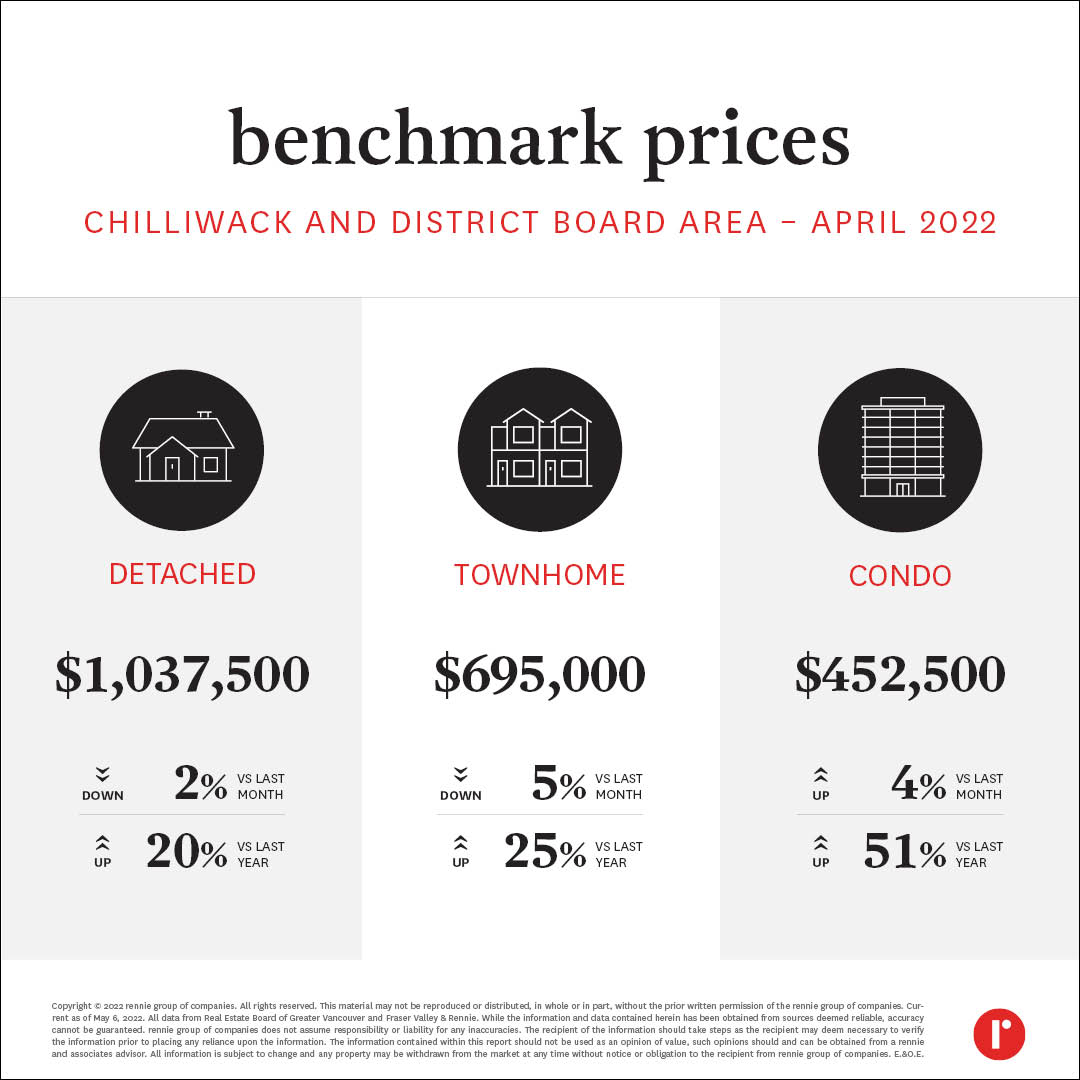 Note, the Chilliwack and District Board Area (CADREB) denotes the Median Sales Price rather than the Benchmark Price. The CADREB does not have a benchmark price available for record.
See Benchmark Prices Infographics for April 2022. Our rennie intelligence team comprises our in-house demographer, senior economist, and market analysts. Together, they empower individuals, organizations, and institutions with data-driven market insight and analysis. Experts in urban land economics, community planning, shifting demographics, and real estate trends, their strategic research supports a comprehensive advisory service offering and forms the basis of frequent reports and public presentations. Their thoughtful and objective approach truly embodies the core values of rennie.
Written by
Related
New listings in San Diego County posted a 4-year high in April and, on a year-to-date basis, are trending at their highest level since 2022. Despite these conditions, the number of active listings was below its prior-year level for the second month in a row.
May 2026
Report
Sales in the Vancouver Region were higher than last year’s level for the first time in April, albeit only marginally. In contrast, new listings were down from last year’s level for the fourth consecutive month, which helped to keep inventory levels below the 2025 tally for the second consecutive month.
May 2026
Report