
The latest Labour Force Survey (LFS) showed little change in Canada’s labour market in May with a modest gain of 8,800 jobs and a 0.1 percentage point increase in the unemployment rate to 7.0%—its highest level since September 2016 when excluding the pandemic years of 2020 and 2021. However, a deeper look at the data illustrates a notable divergence in labour market conditions across the country through 2025, with those industries and regions most exposed to US tariffs having fared the worst.
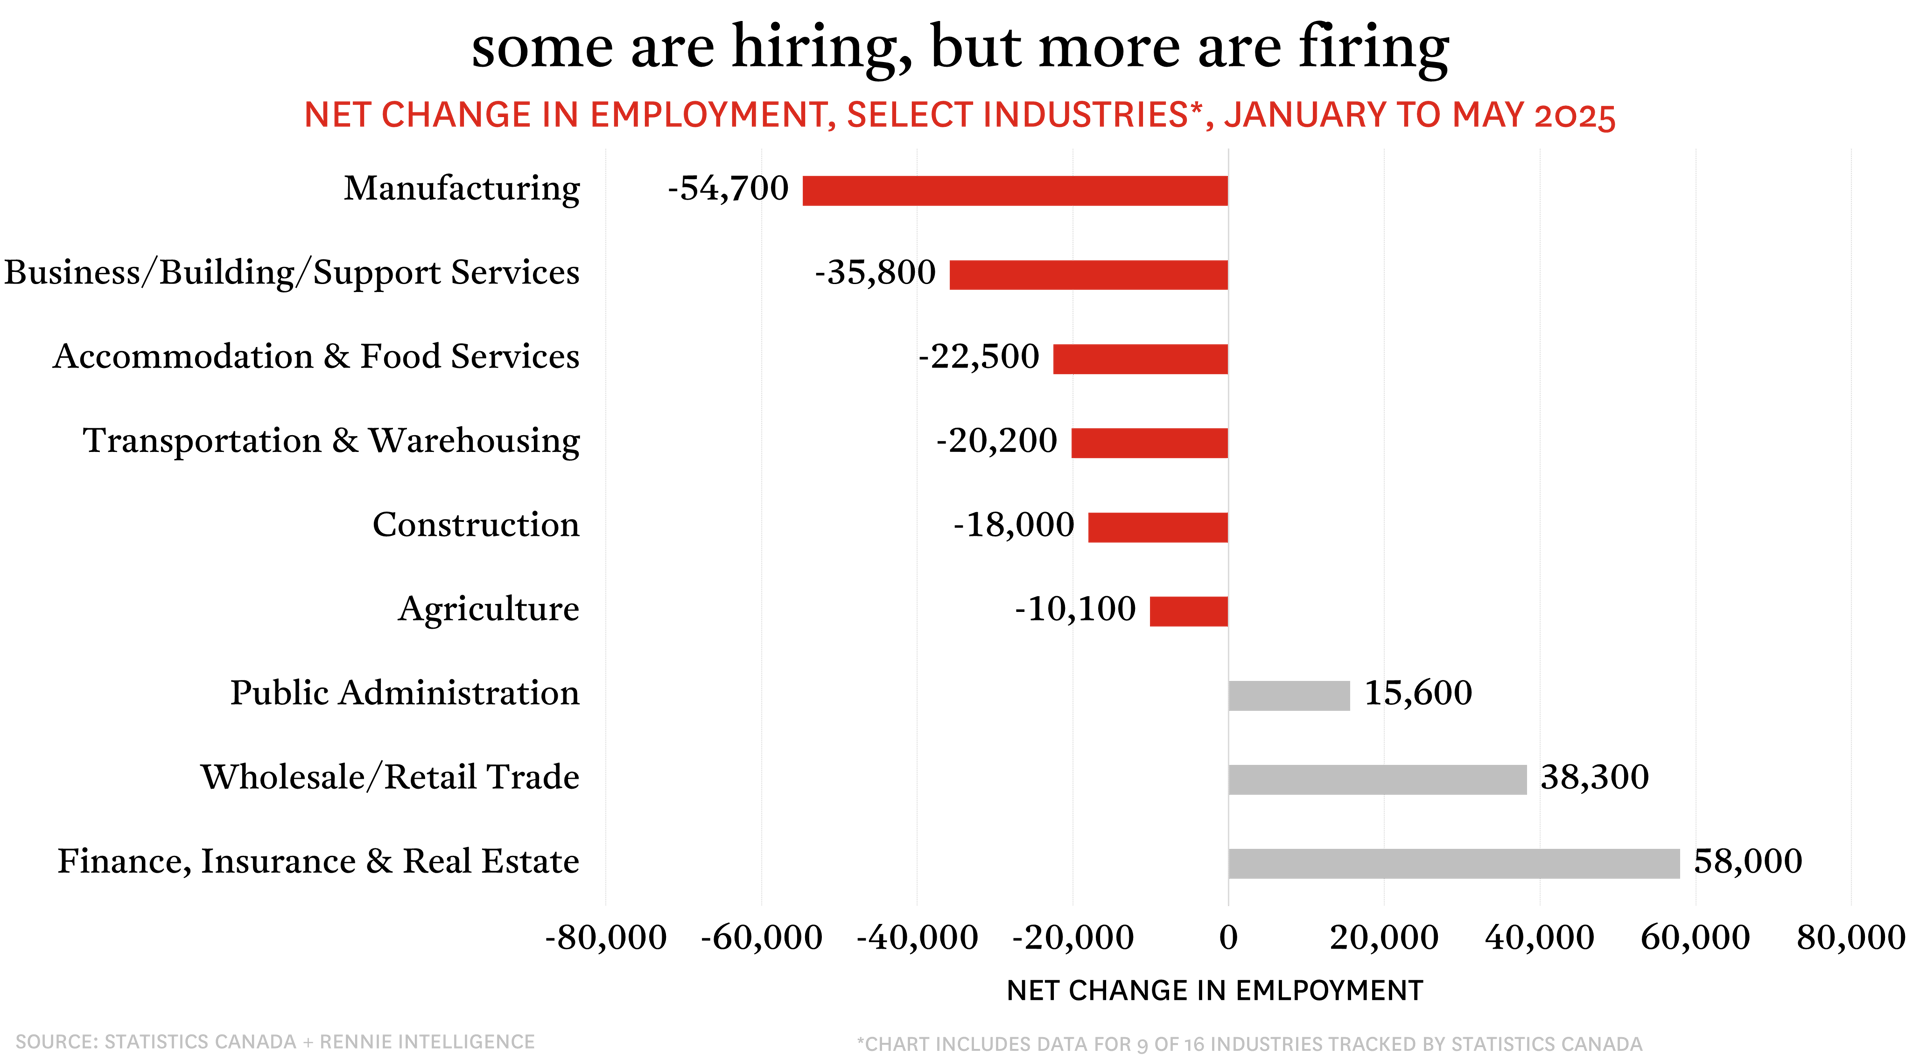
Canada has shed 15,300 net jobs since January, a sharp contrast to the prior four months when the country added 214,100 from September to January. Losses have been heavily concentrated in goods-producing sectors (-77,200), though much of this has been offset by gains in the services sector (+61,800). More specifically, the manufacturing sector, which has been most directly affected by US tariffs (on automobiles, steel and aluminum) has seen the largest contraction in employment. Since January, the sector has lost 54,700 net jobs, followed by business, building and other support services (-35,800), accommodation and food services (-22,500), transportation and warehousing (-20,200), and construction (-18,000). The surprise announcement by the US president on June 3rd increasing steel and aluminum tariffs from 25% to 50% will put further pressure on manufacturing employment in the months ahead.
Regional employment trends have evolved as one might expect given the different employment and industrial bases across the country. Ontario—the automobile and steel manufacturing hub of Canada—has suffered the overwhelming share of job losses. Since January, the province has shed 41,800 net jobs, well beyond second-place Quebec (-7,000) and third-place Alberta (-4,300). Ontario communities with high concentrations of automobile and auto parts manufacturers, and which are deeply integrated with US supply chains, had the highest unemployment rates in Canada in May. They have also seen some of the largest increases year-over-year. The three-month moving average unemployment rate in Windsor was 10.8% in May, up from 7.8% the same time last year, and in Oshawa it was 9.1%, up from 5.4%.
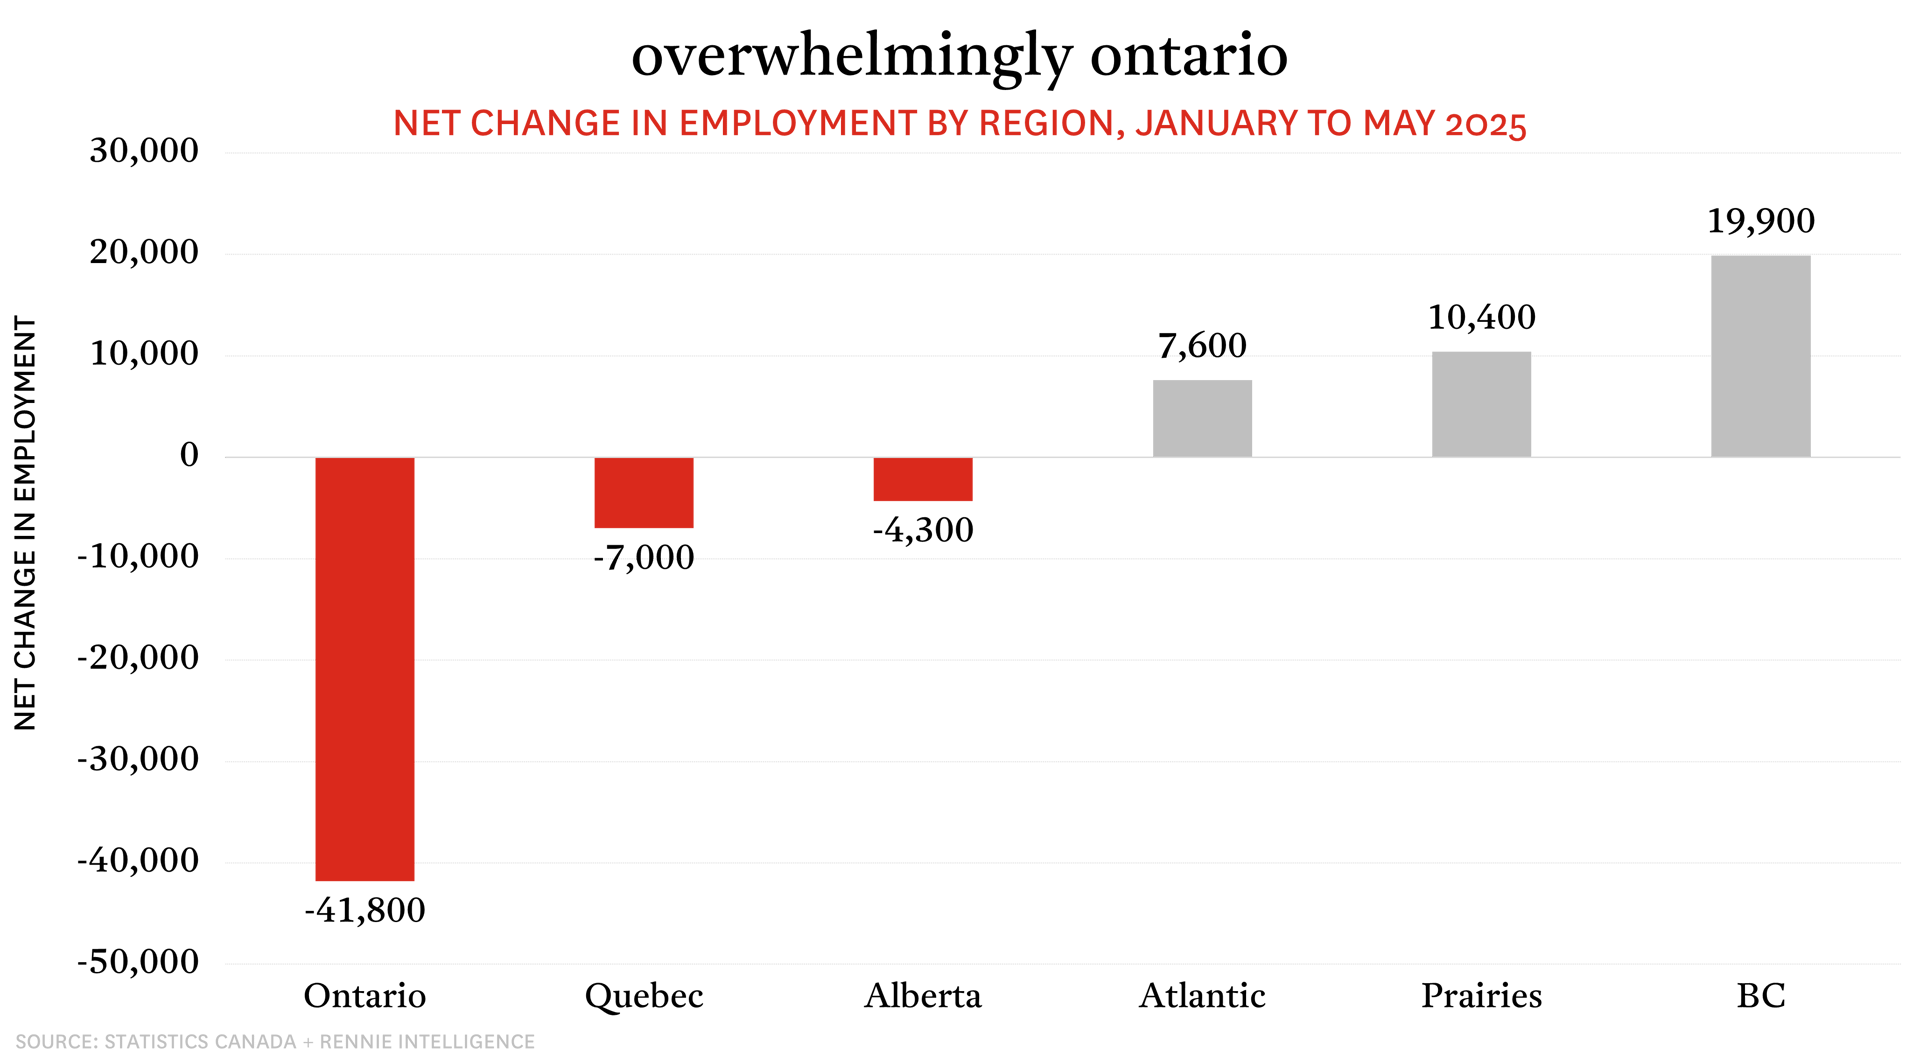
As presented in the spring 2025 rennie landscape, geographic advantages mean that BC has the second-lowest US trade exposure among Canadian provinces. In 2024, merchandise exports from BC registered $54 billion, of which 53% (or $29 billion) went to the US. That was well below other provinces like Alberta (89% or $162 billion), Ontario (77% or $195 billion), and Quebec (75% or $91 billion). Lower US trade exposure, and the fact that the US has so far not levied any new tariffs that would disproportionately impact BC's economy, have helped the province’s labour market outperform other parts of the country through 2025. Since January, BC has added 19,900 net jobs, almost double the 10,400 in the Prairies (i.e., Saskatchewan and Manitoba) and well above the 7,600 in Atlantic Canada. What’s more, at 3.7%, Victoria had the lowest unemployment rate among Canada’s 20 largest census metropolitan areas in May (a function of its large and stable public sector), and Vancouver had the lowest unemployment rate (6.4%) among major urban centres.
Looking ahead, although employment is not a specific piece of the Bank of Canada’s mandate, a weakening labour market provides further evidence of the negative impact that US tariffs are having on Canadian businesses, households, and the economy overall. Following its decision to hold its policy interest rate at 2.75% on June 3rd, deteriorating labour market conditions through 2025 should support another cut at its next meeting on July 30th.