- According to the latest Census, the number of people commuting to jobs in Metro Vancouver declined by 20% between 2016 and 2021.
- Despite this overall change in commuting patterns, Vancouver, Surrey, and Burnaby continued to account for more than half of all places of work to which Lower Mainland residents commuted.
- Our estimates reveal that the pandemic reduced commuting flows by approximately 34% from what would have been expected in 2021 had there been no pandemic.
Data from the 2021 Census has helped to shed light on the extent to which the pandemic materially impacted commuting flows in Metro Vancouver.
Changing Spatial Patterns of Work During the Pandemic
This past month, Statistics Canada released its final set of 2021 Census data. which included information on quite a variety of topics. Among them, the data on both where people work and where they live are some of the most compelling, particularly given the timing of the census enumeration (May 2021) in the context of the pandemic.
Indeed, the worst of Covid-19 disrupted many aspects of our lives, and especially commuting patterns, with many people who had been traveling to a so-called usual place of work outside of the home (think of office workers, among others) five days per week transitioned to working exclusively from home while others adopted a hybrid schedule that saw them work from home at least once a week.
This brief analysis focuses on the changes in commuting patterns for jobs located in Metro Vancouver between the 2016 and 2021 Census enumerations, and considers how many people would have commuted into Metro Vancouver had there been no pandemic. Consideration is also given to changing spatial patterns of working from home.
Identifying Where Commuters Worked in Metro Vancouver in 2021
There were 800,445 places of work located in Metro Vancouver to which Canadian residences commuted in 2021. Of these, 798,880 (99.8%) commuted from within BC, with the remaining 1,565 (0.2%) “commuting” from elsewhere in Canada.
Furthermore, because 99.5% of all commuters to Metro Vancouver (796,705 people) also lived in the Lower Mainland—an area larger than Metro Vancouver itself, broadly spanning a region bounded by Hope in the east and Lillooet in the northwest—and due to limitations in comparing data between 2016 and 2021, the focus here is on the commuting patterns of Lower Mainland residents to locations within Metro Vancouver specifically.
Vancouver & Surrey the Most Popular Destinations for Commuters
Not surprisingly—or maybe it’s a little surprising, in light of the pandemic—the City of Vancouver had the most jobs to which people commuted of any municipality or First Nation reserve in Metro Vancouver in 2021, at 224,245 (28% of the regional total).
Surrey was next, accounting for 16% of jobs to which Lower Mainland residents commuted (127,855 jobs), followed by Burnaby, with 11% (86,565). The balance of the region accommodated the remaining 45% of jobs to which Lower Mainland residents commuted.
Of course, not all of those commuting to their job do so across municipal borders; in fact, 47% of Metro Vancouver residents commute to a place of work that’s located in the same city in which they live. Bowen Island leads the way in this regard, with 90% of the places of work to which people commute on this land mass surrounded by water being local residents, followed by Surrey and Maple Ridge, each at 68%.
For those crossing municipal boundaries, the Vancouver-Richmond flows once again stand out, as they have in past Census counts, with more Vancouverites commuting to Richmond for work (17,770) than do Richmonders to Vancouver (13,575).
How the Flows Ebbed and...Flowed...Between 2016 and 2021
In what is most certainly, and perhaps even exclusively, a consequence of the pandemic—given that so many people migrated their place of work to their home on either a part-time or even full-time basis, as evidenced by the 218% increase in the number of people who indicated they worked at home in 2021 versus 2016—there were 20% fewer Lower Mainland commuters to places of work in Metro Vancouver in 2021 than in 2016 (down to 796,705 from 994,680).
Relatively big declines were seen where you’d expect them: specifically, a 50% drop in commuters to UBC (as many courses had transitioned to an online format) and a 34% decline in the City of Vancouver (as many office workers traded their suits for PJs). Conversely, increases were registered in Pitt Meadows (+11%) and Maple Ridge (+18%)—on the one hand a seemingly intuitive finding, given how populations spread out from the most urban parts of the region to the more suburban and rural, but curious nonetheless because it’s the number of places of work outside of the home that increased in these communities. Certainly, something to dig deeper into as part of a future post.
Now, while the gap between the 2016 and 2021 commuter counts at the regional level in Metro Vancouver is significant on its own, the true extent of the commuting flow suppression of 2021 is better underscored by considering how growth in the region’s population between 2016 and 2021 could (should?) have increased commuting flows in 2021.
Comparing 2021 Commuter Flows to 2016 Population Growth-adjusted Flows
The Lower Mainland’s population grew between 2016 and 2021, by almost 8%, though growth was uneven throughout this broad region: in Metro Vancouver, for example, the fastest grower was Tsawwassen, as its population expanded by 177% (from 816 to 2,256 people), while in Port Moody, the population declined by 0.05% (a net loss of 16 people), which was the only drop in population of any municipality in Metro Vancouver.
With this in mind, one method of estimating what the number of commuters to jobs in Metro Vancouver should have been in 2021 in the absence of the pandemic is to apply rates of population growth (or decline) in communities throughout the Lower Mainland to the number of commuters to Metro Vancouver that originated from these communities. This approach ignores ongoing occupational and industry sector composition changes that could impact the spatial distribution of workplaces (as the data are not yet available), and it does not seek to disentangle the effects of the pandemic on either the composition of employment growth or the magnitude of population growth, among other things. That said, it’s a start that we hope others can build upon and refine.
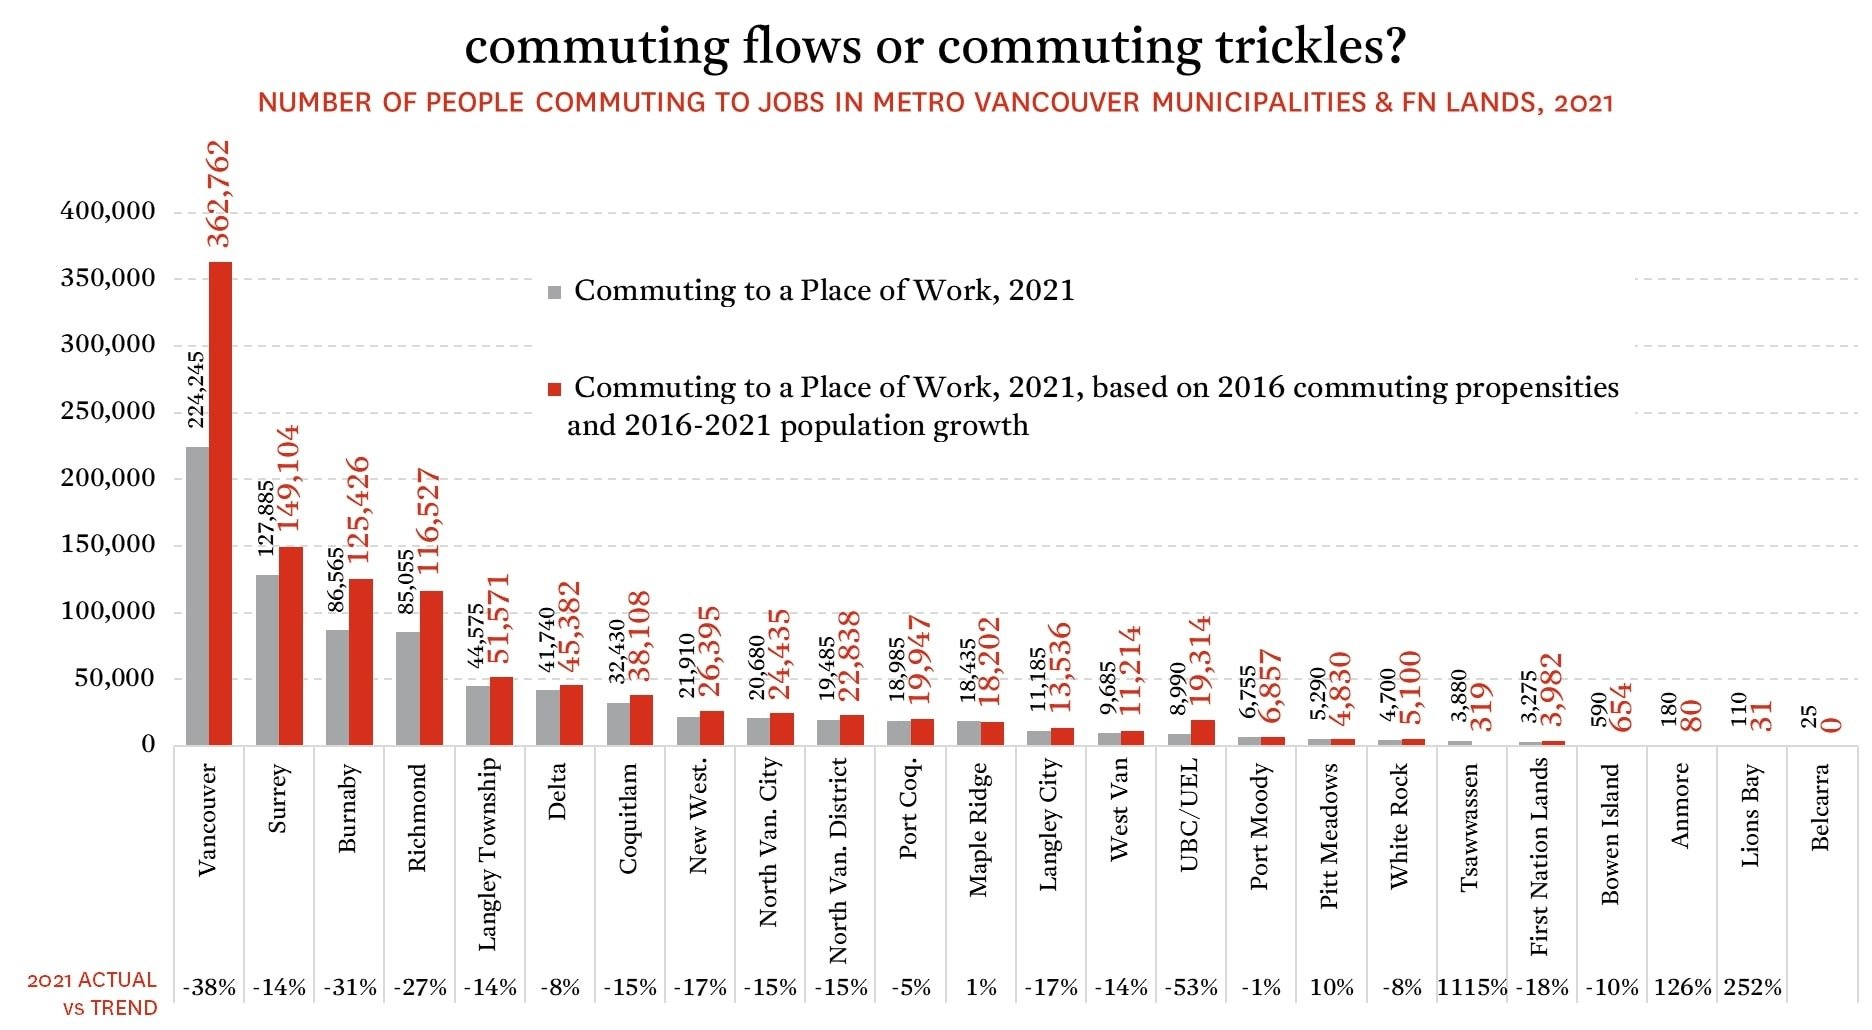
In adopting this approach, the number of people commuting to places of work located in Metro Vancouver in 2021 would have been 1.067 million; this would represent a 7% increase over 2016’s count (of 994,680) and would equate to 34% more commuters than was actually realized in 2021 (796,705). Put slightly differently, there were 269,930 fewer commuters to places of work in Metro Vancouver than would have been expected, all else being equal (that’s an economist’s way of saying this is the impact of the pandemic on commuting flows).
The largest absolute pandemic-induced suppression in commuting flows was observed in the City of Vancouver, with the 224,245 commuters falling 138,517 commuters short of the otherwise-predicted 362,762. That said, the 38% reduction in commuting to which this equates would not be the greatest relative contraction in the region; instead this distinction goes to the UBC/UEL lands, just to the west of the City of Vancouver, at 53%.
Most communities throughout Metro Vancouver tallied observed commuting flows in 2021 that were well short of the population-based estimates—though not all. Most notably is on Tsawwassen First Nation land, where the actual commuter count (of 3,880) was many multiples greater than the predicted value (of 319). Why? Simple: Tsawwassen Mills, a huge shopping centre supporting thousands of jobs, opened in late 2016 (after Census enumeration).
Ok, So What?
This brief analysis—well, brief to some; perhaps TL;DR for others—represents a first attempt to unravel some of the complexities associated with the latest Census data on spatial work patterns and, more specifically, the extent of the role that the pandemic played on them. By no means is this the definitive analysis.
Indeed, our hope is that additional research will be undertaken that will help answer outstanding questions about the following, among others: changing employment structures and how they were impacted by the pandemic; the likelihood that commuting flows have been permanently reduced for a given scale of population and employment; and the impacts of the dispersion of the daytime population from denser, white collar neighbourhoods to less proximate and well-connected parts of the region.
Our rennie intelligence team comprises our in-house demographer, senior economist, and market analysts. Together, they empower individuals, organizations, and institutions with data-driven market insight and analysis. Experts in urban land economics, community planning, shifting demographics, and real estate trends, their strategic research supports a comprehensive advisory service offering and forms the basis of frequent reports and public presentations. Their thoughtful and objective approach truly embodies the core values of rennie.