Benchmark Prices - January 2019
Jan 07, 2019
Written by
Ryan BerlinSHARE THIS
Here are the Benchmark Price Infographics for the areas of the Lower Mainland covered in the monthly rennie review. The areas include the REBGV, Burnaby East, Burnaby North, Burnaby South, Coquitlam, North Vancouver, Richmond, Vancouver East, Vancouver West, West Vancouver, Squamish, Tsawwassen, Port Coquitlam, Port Moody, New Westminster, Surrey, Langley, Pitt Meadows, Maple Ridge, White Rock, and Abbotsford.Real Estate Board of Greater Vancouver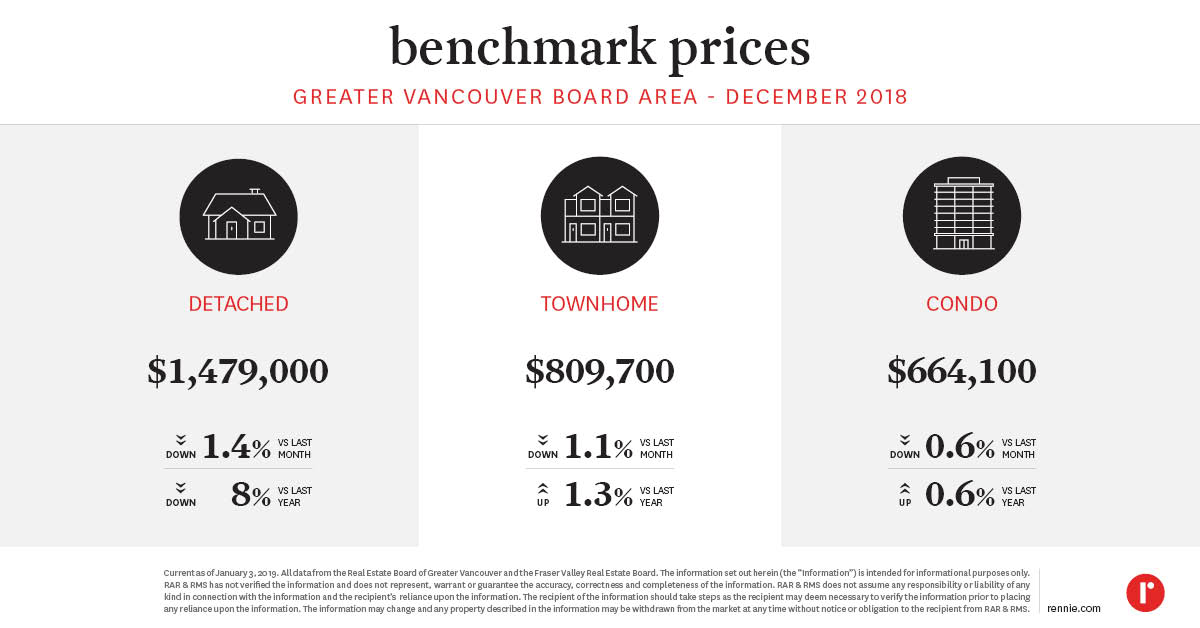 Burnaby East
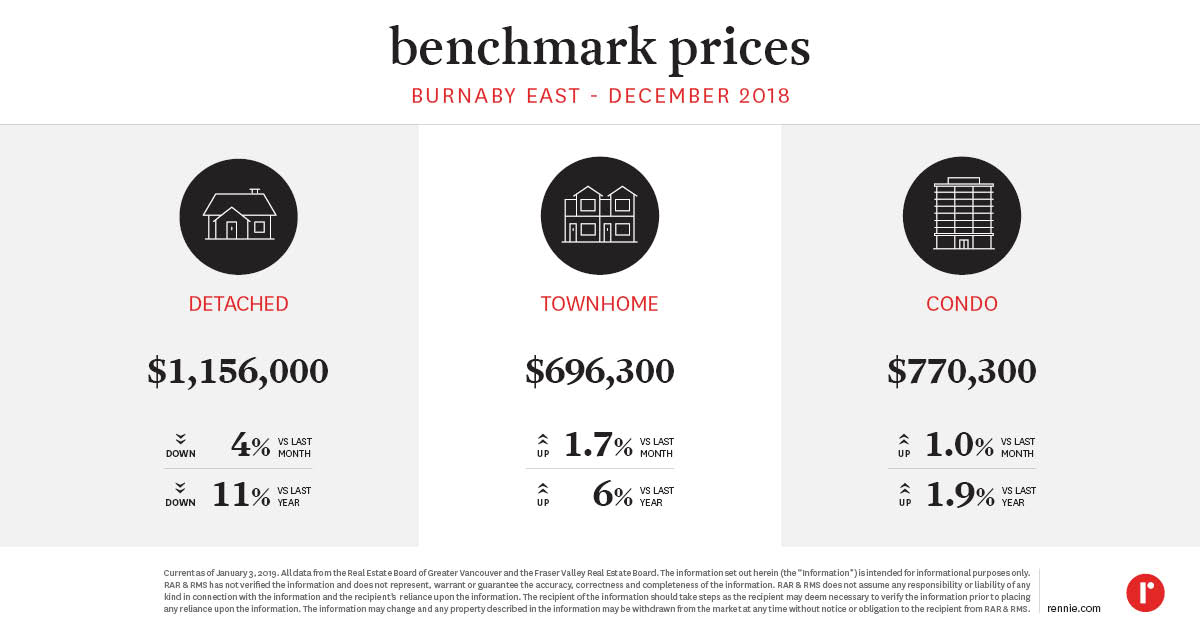 Burnaby North
 Burnaby South
 Coquitlam
 North Vancouver
 Richmond
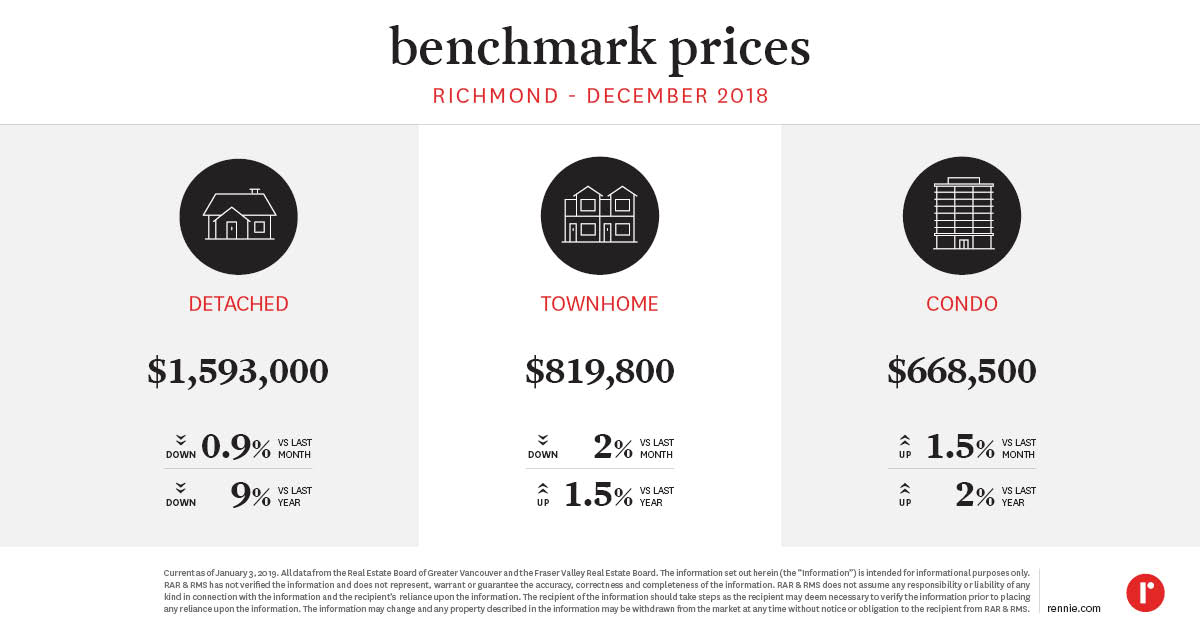 Vancouver East
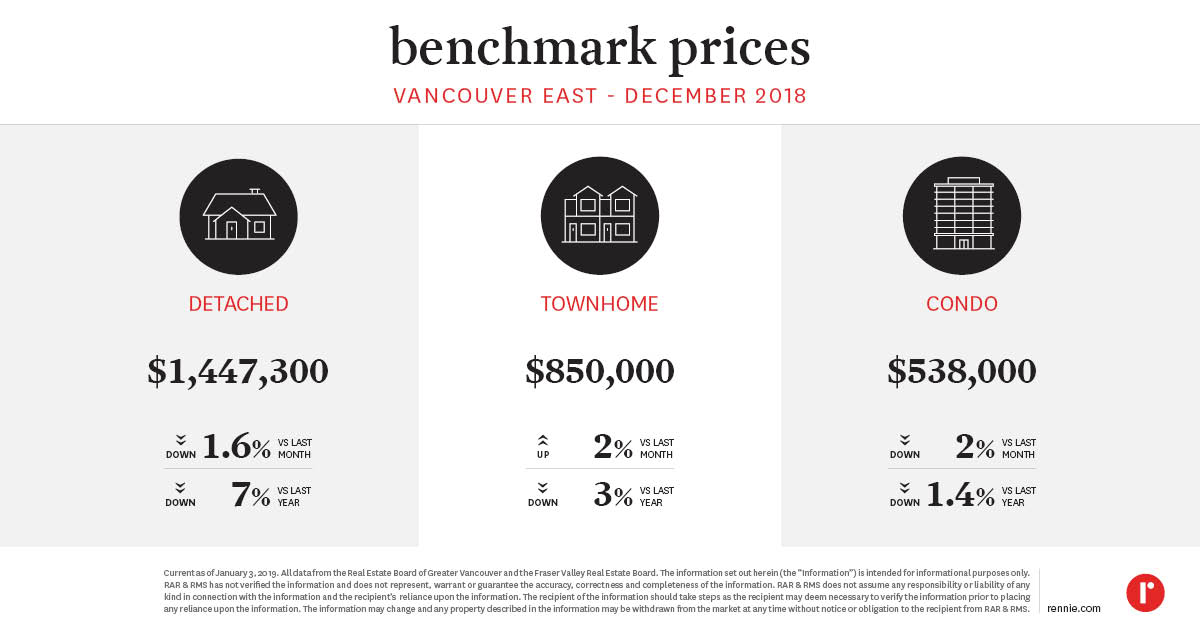 Vancouver West
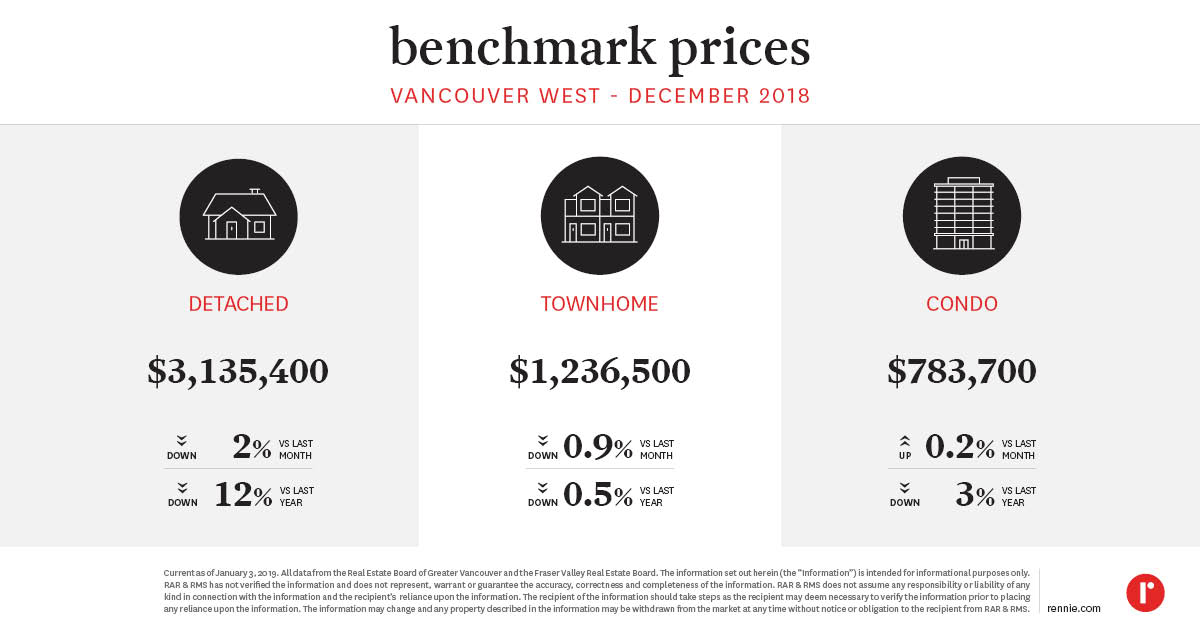 West Vancouver
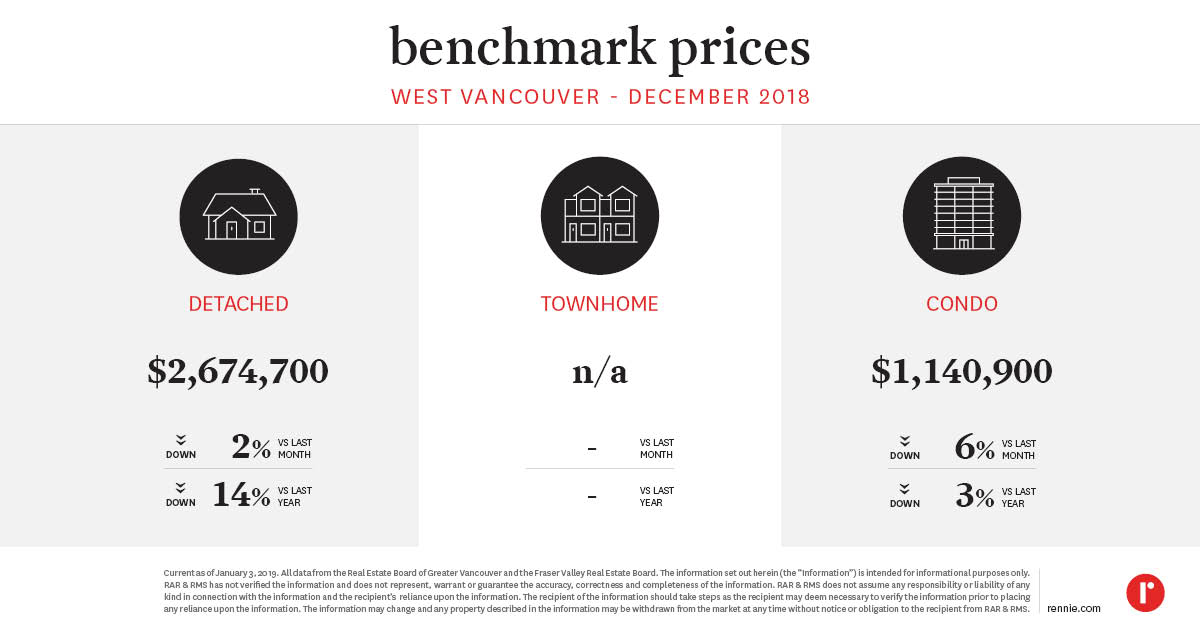 Squamish
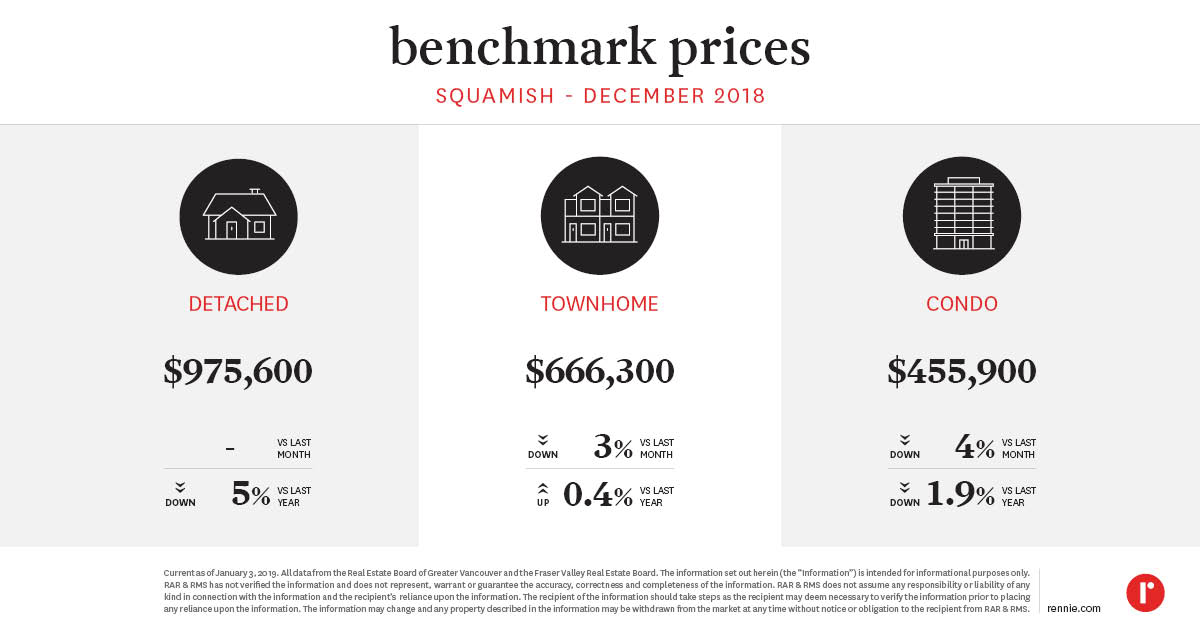 Tsawwassen
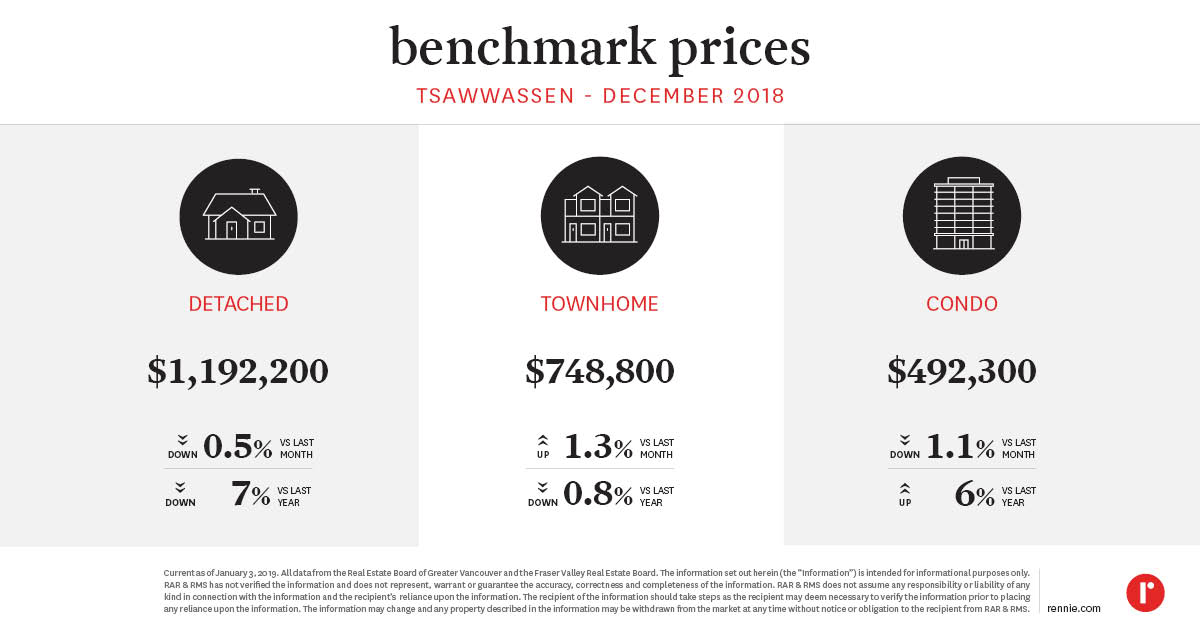 Port Coquitlam
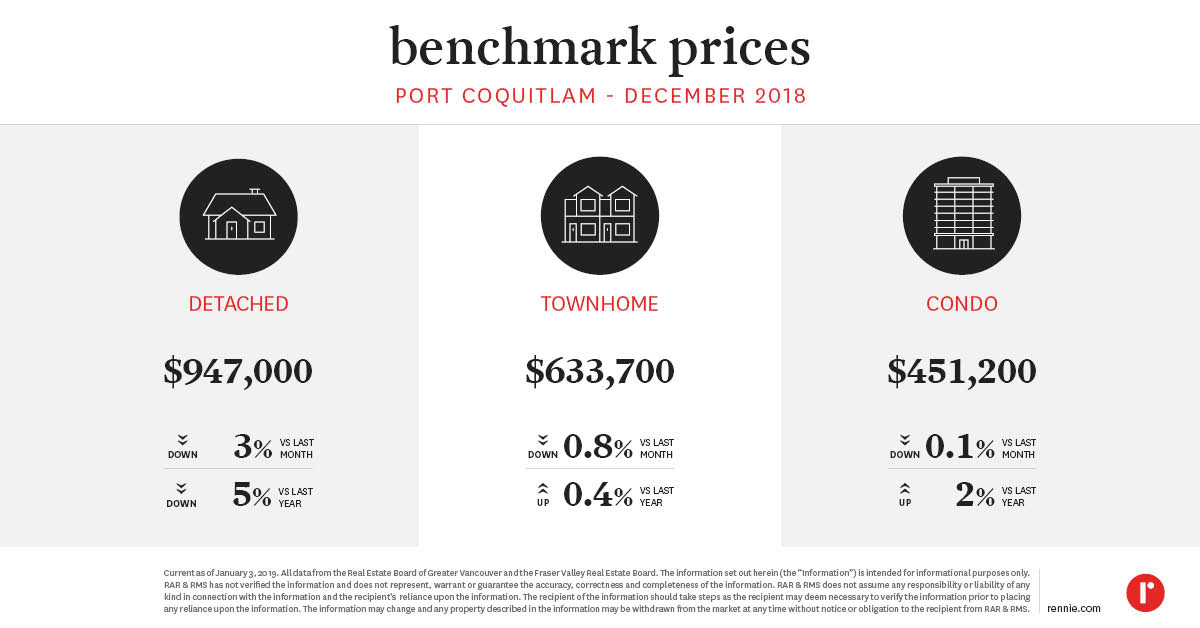 Port Moody
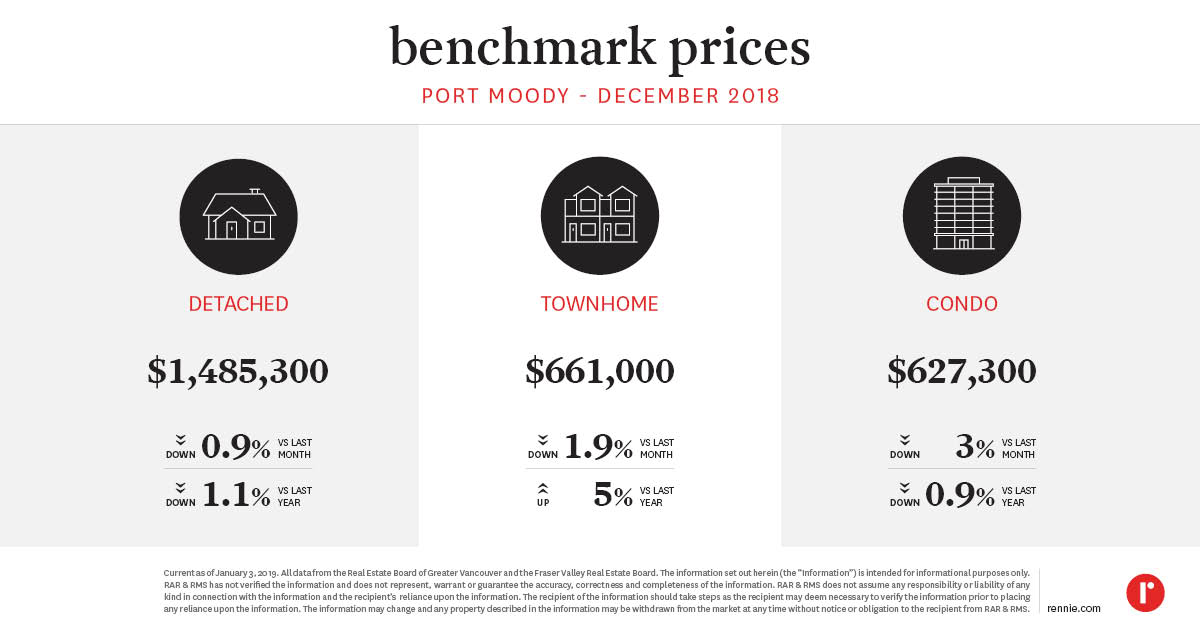 New Westminster
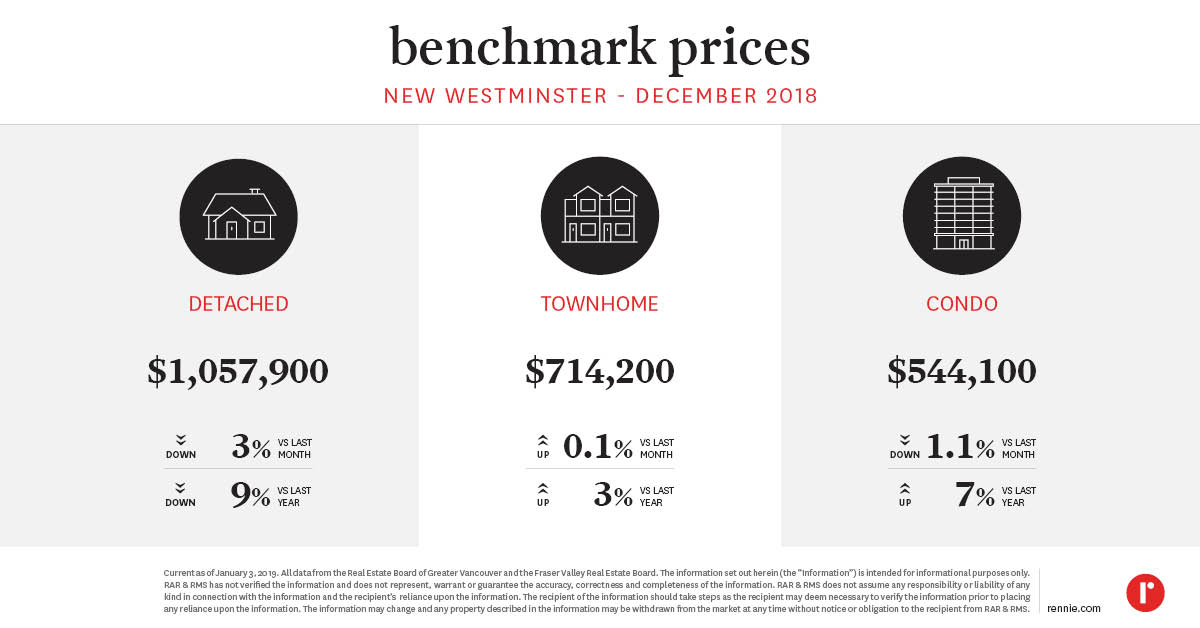 Surrey
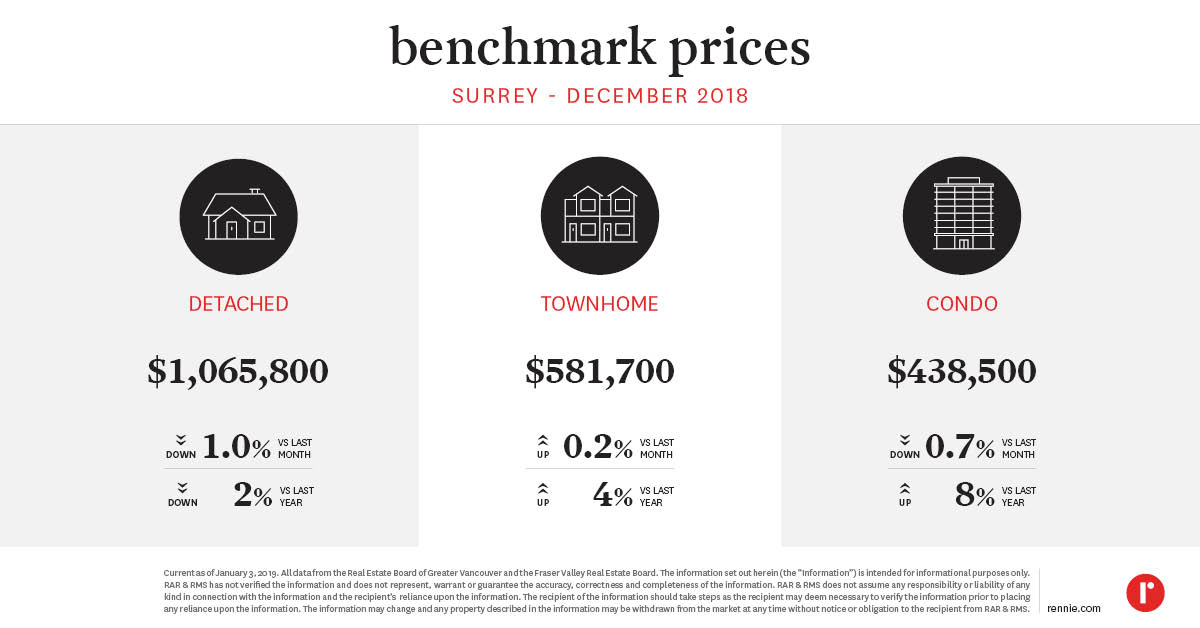 Langley
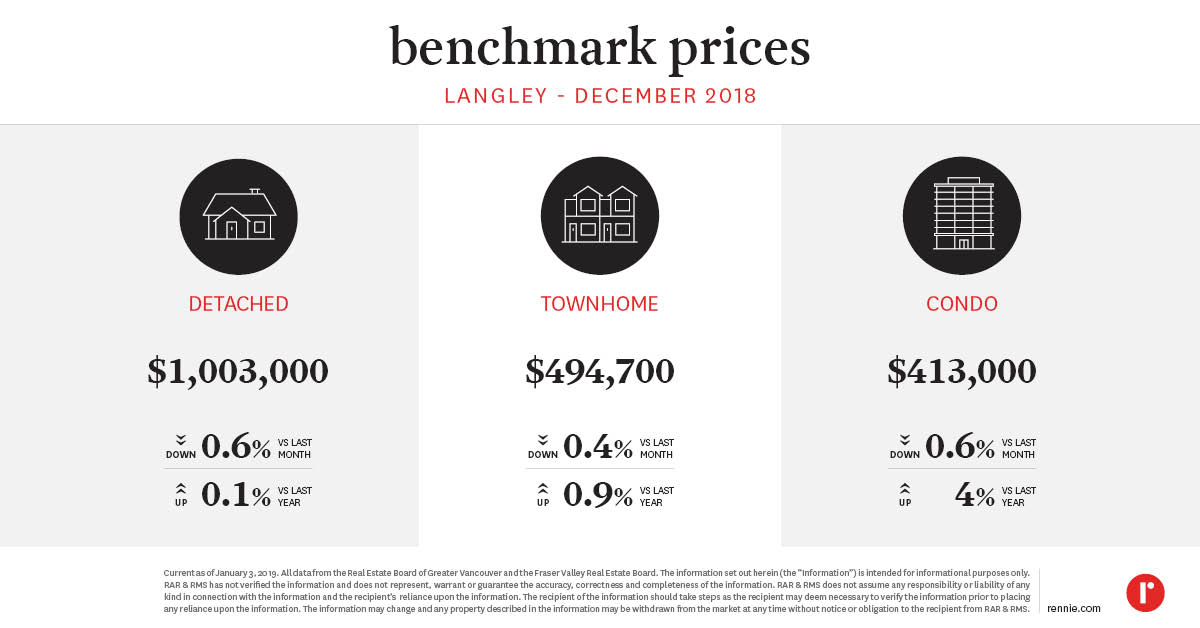 Pitt Meadows
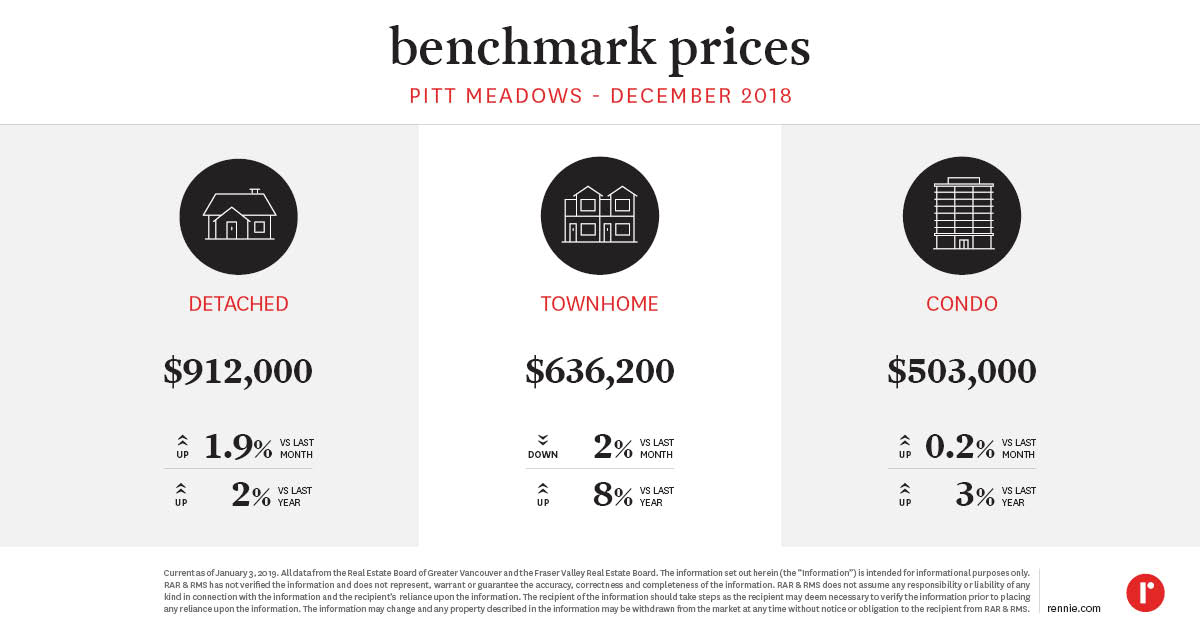 Maple Ridge
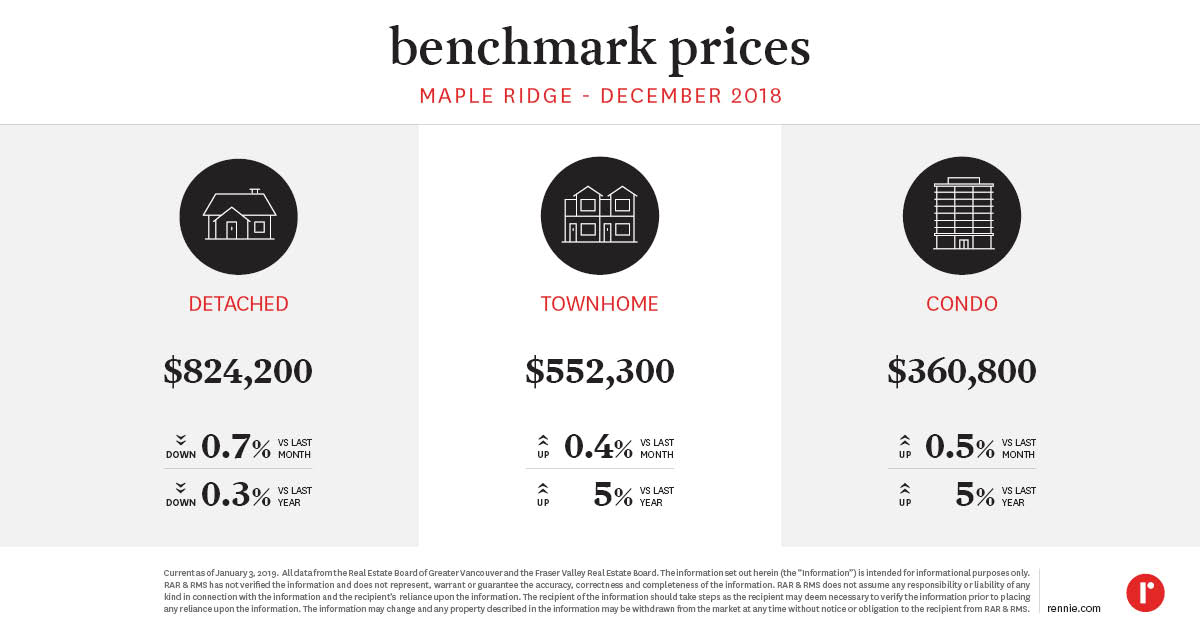 Our rennie intelligence division empowers individuals, organizations, and institutions with data-driven market insight and analysis. Experts in urban land economics, community planning, shifting demographics, and real estate trends, their strategic research supports a comprehensive advisory service offering and forms the basis of frequent reports and public presentations. Their thoughtful and objective approach truly embodies the core values of rennie.
Written by
Related
The Central Okanagan was the only major market in BC to register a year-over-year increase in sales in February, posting its most active February in 4 years. Though inventory remains substantially higher than long-run average levels, there were fewer active listings at the end of the month when compared to the previous February.
Mar 2026
Report
The Desert experienced its largest January-to-February increase in sales in at least a decade, resulting in the highest sales count for any February since 2022. Alongside subdued new listings activity, inventory levels retreated even further below average.
Mar 2026
Report