Benchmark Prices - July 2019
Jul 08, 2019
Written by
Ryan BerlinSHARE THIS
Here are the latest Benchmark Price Infographics for the areas of the Lower Mainland covered in the monthly rennie review. Greater Vancouver Board Area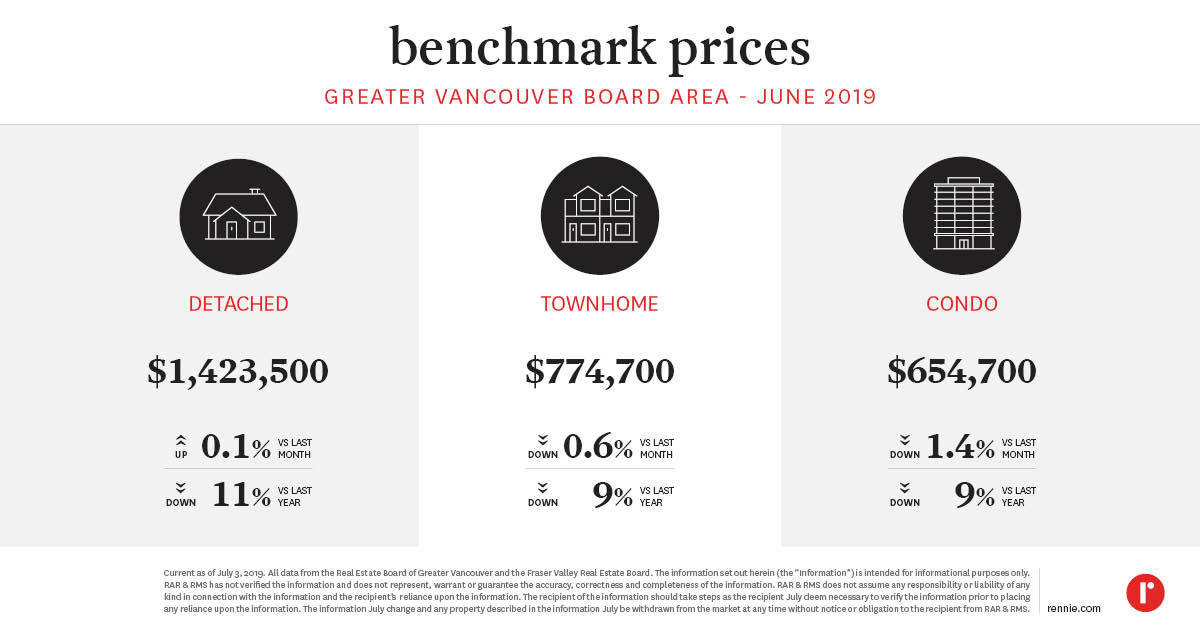 Burnaby East
 Burnaby North
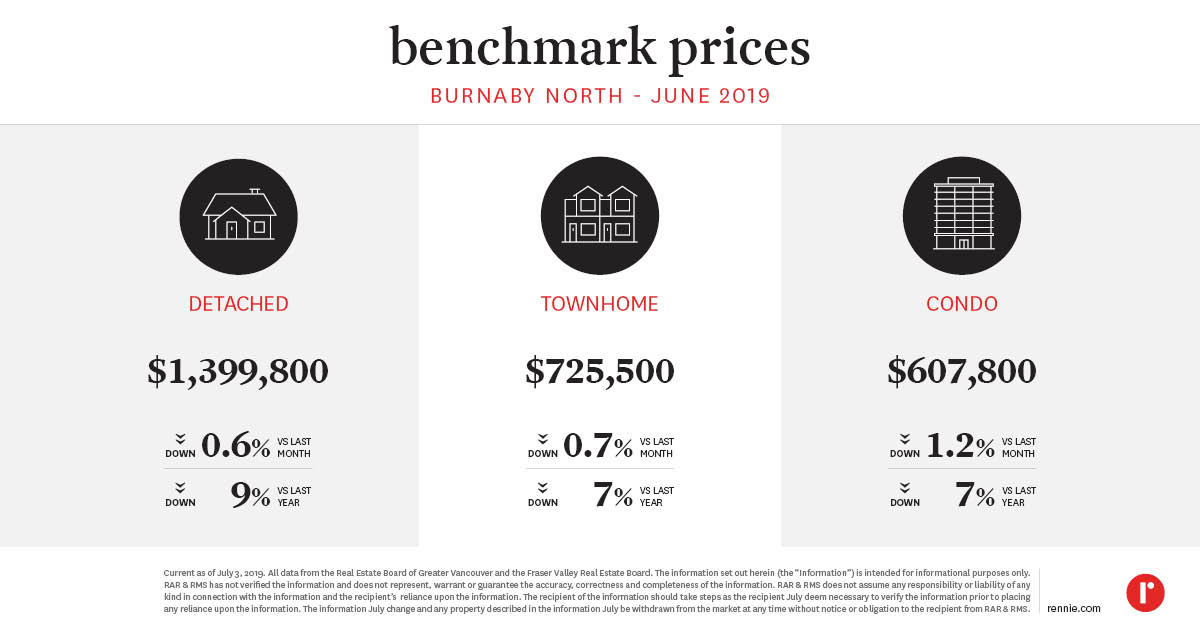 Burnaby South
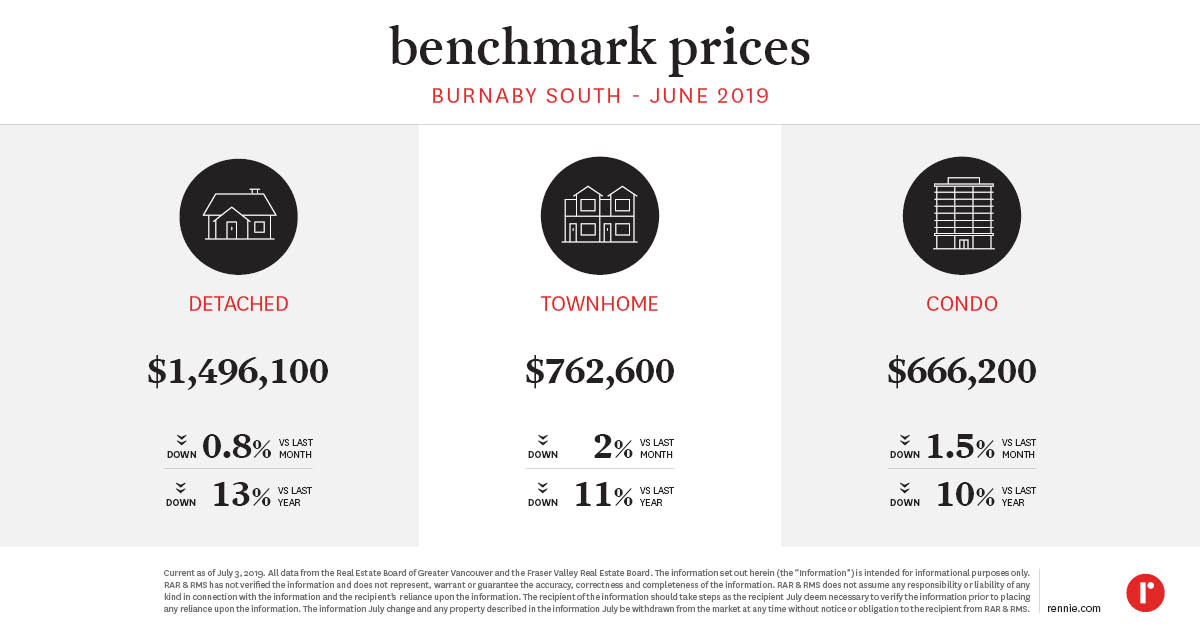 Coquitlam
 North Vancouver
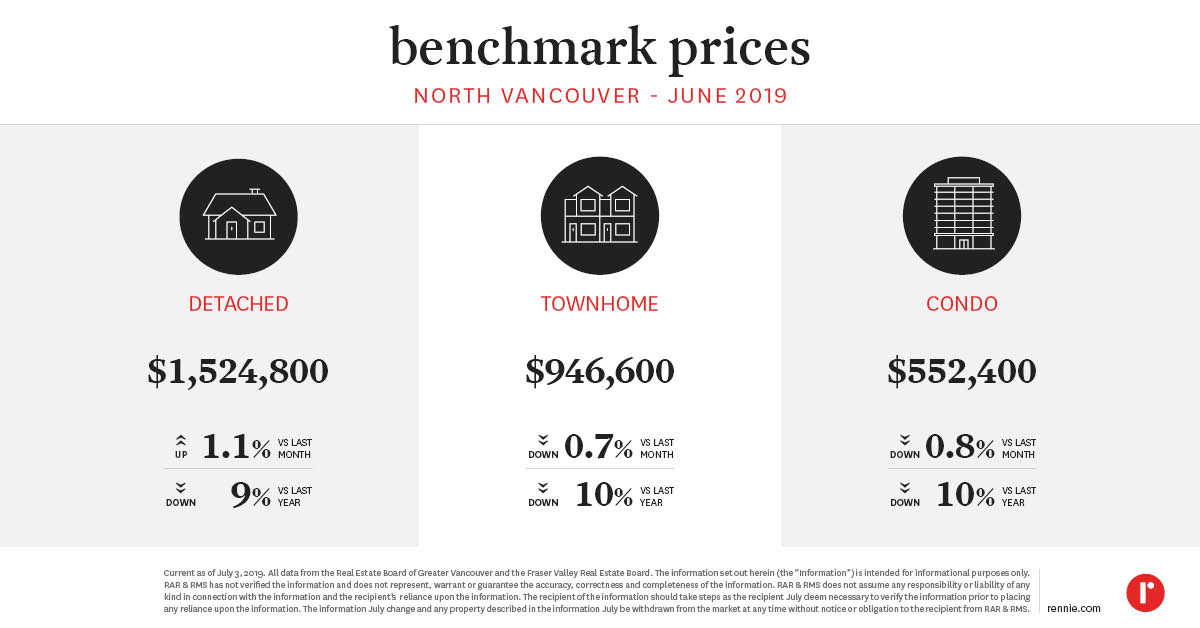 Richmond
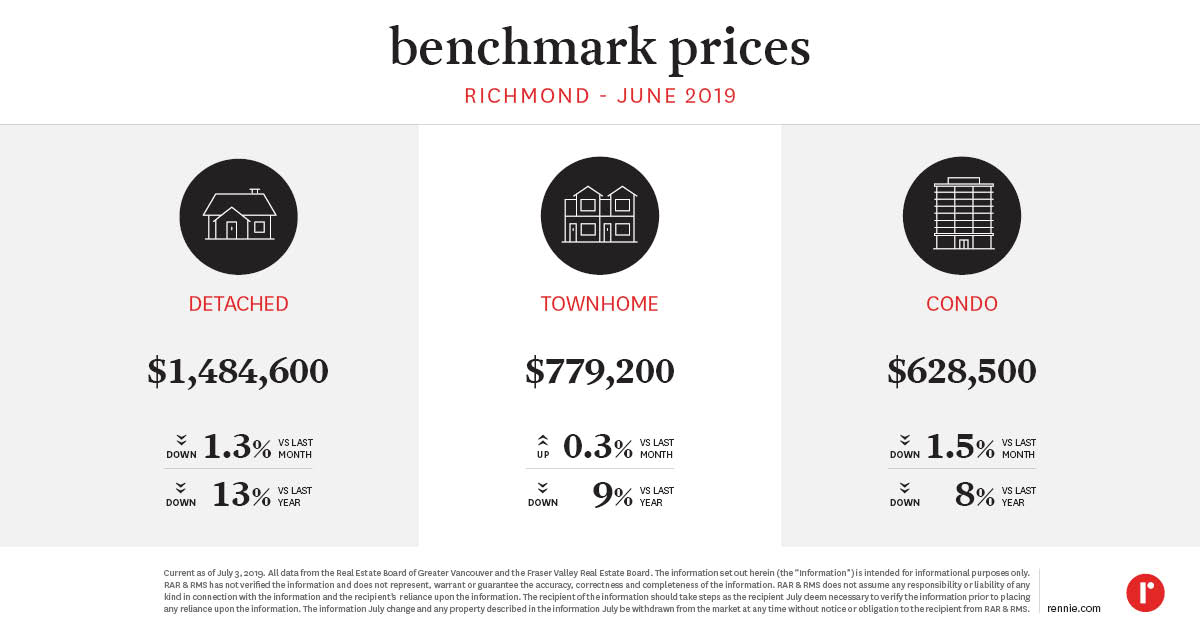 Vancouver East
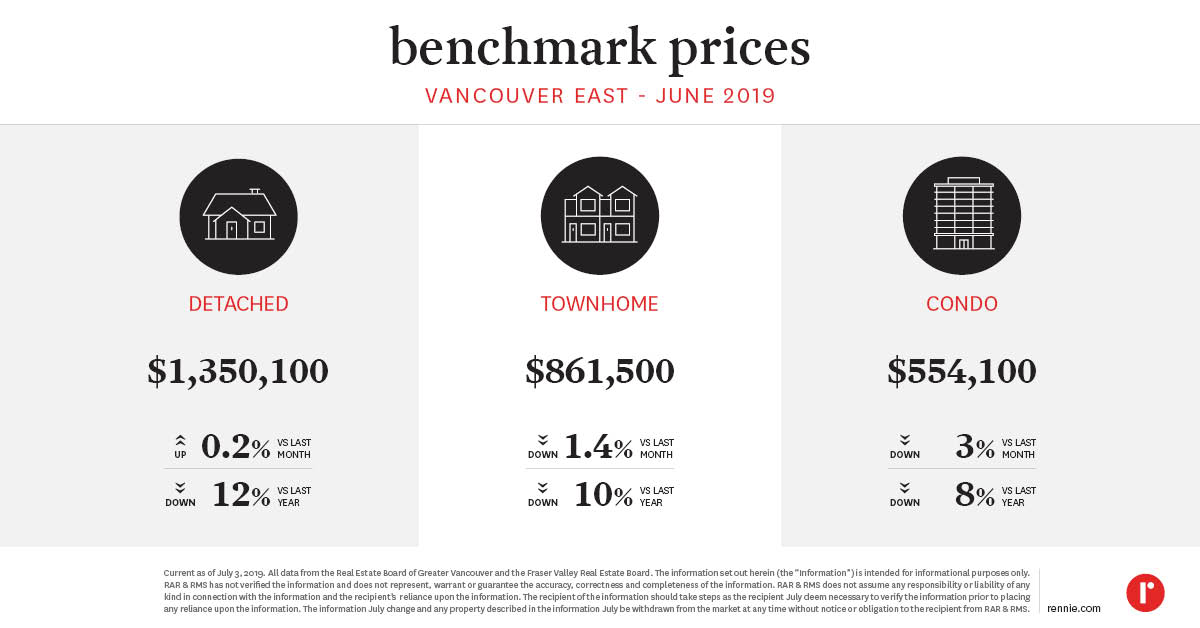 Vancouver West
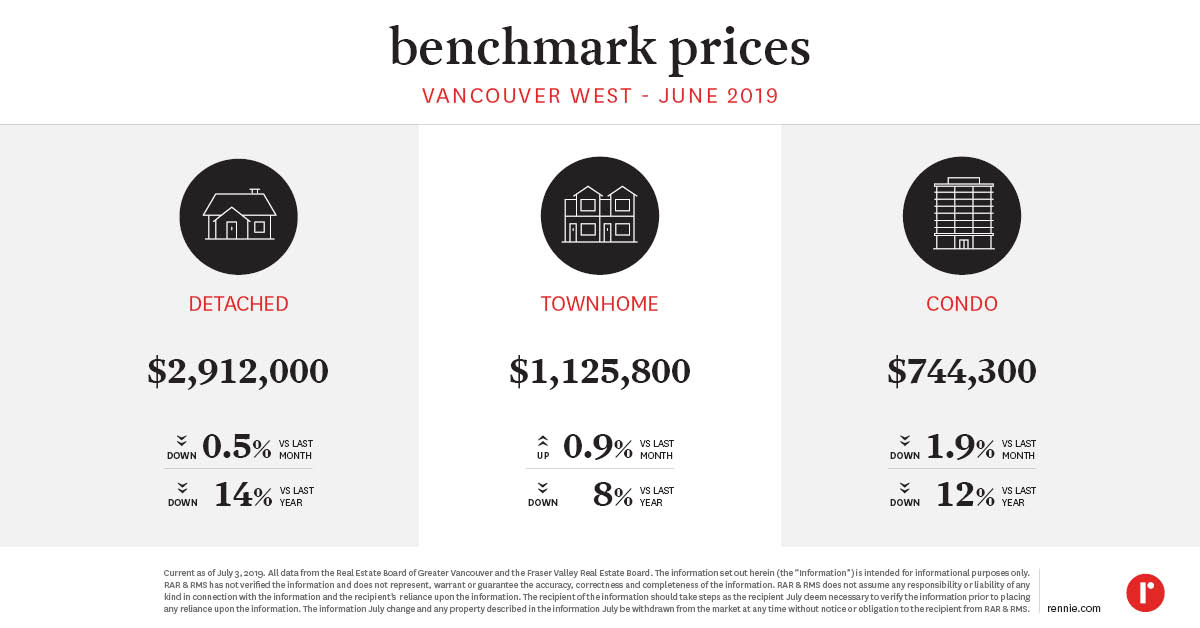 West Vancouver
 New Westminster
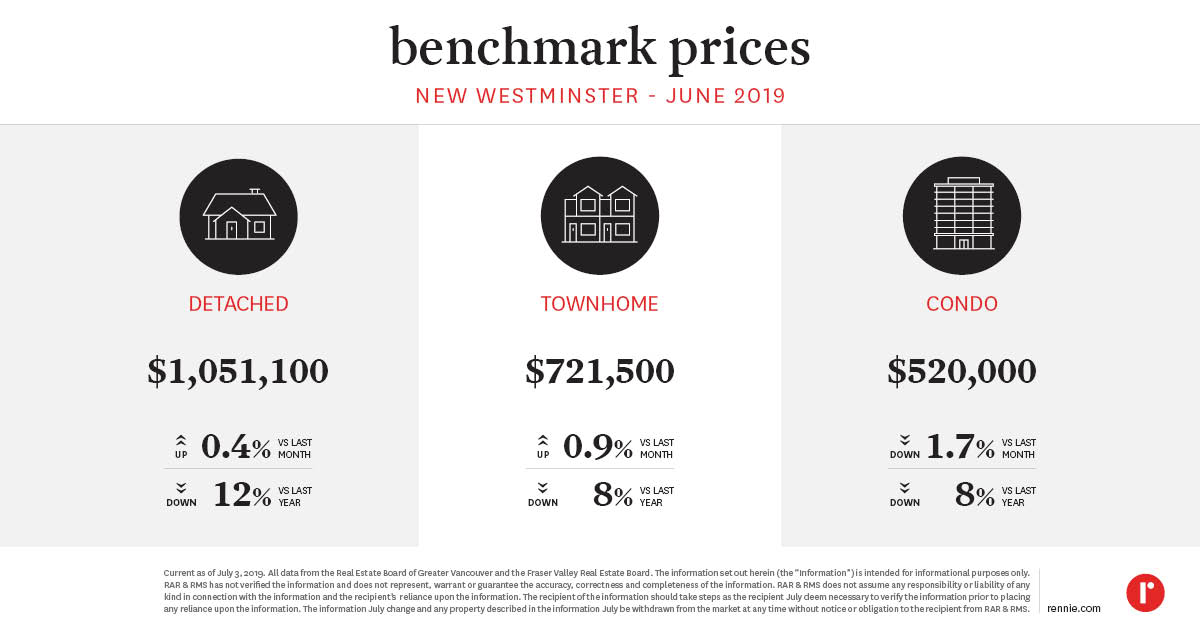 Squamish
 Tsawwassen
 Port Coquitlam
 Port Moody
 Fraser Valley Board Area
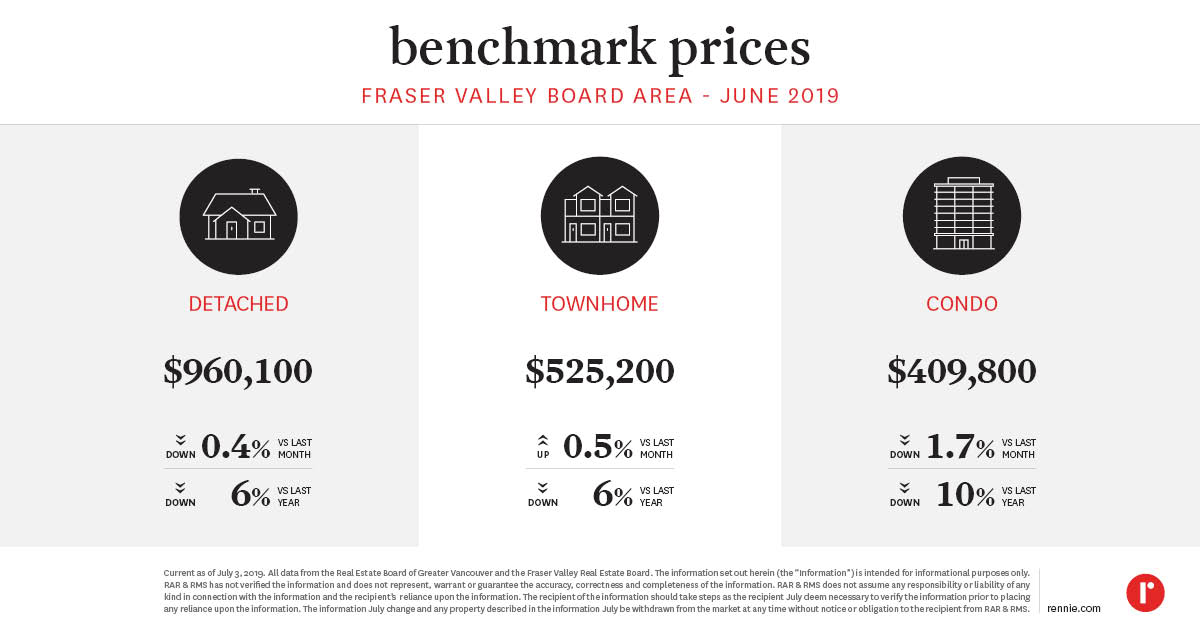 Surrey
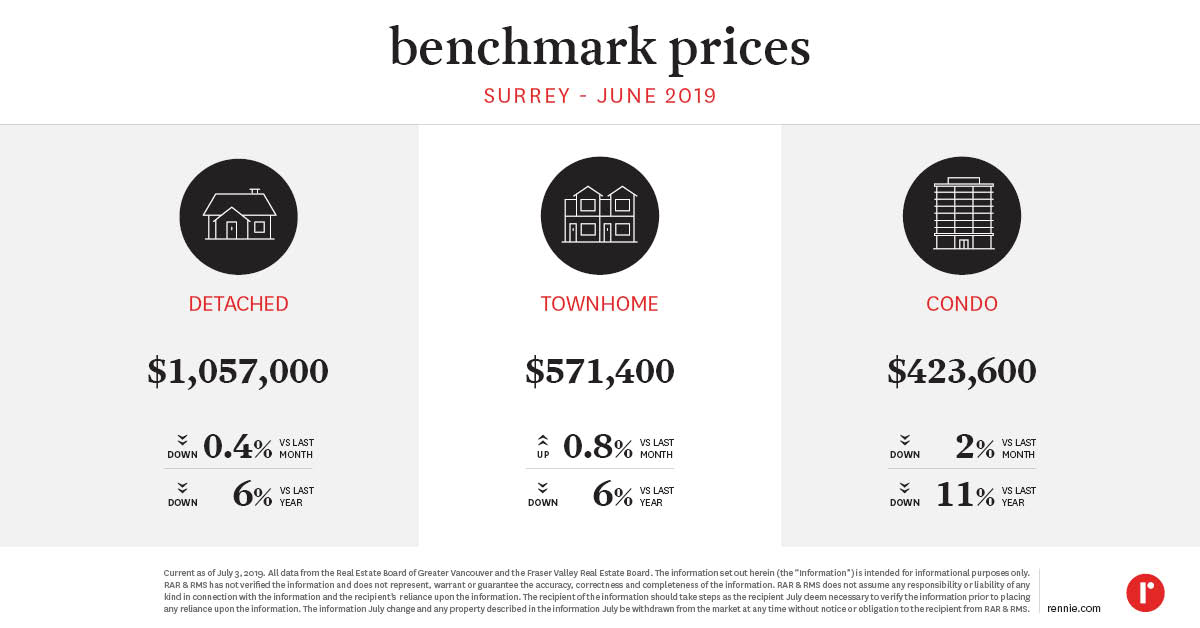 Langley
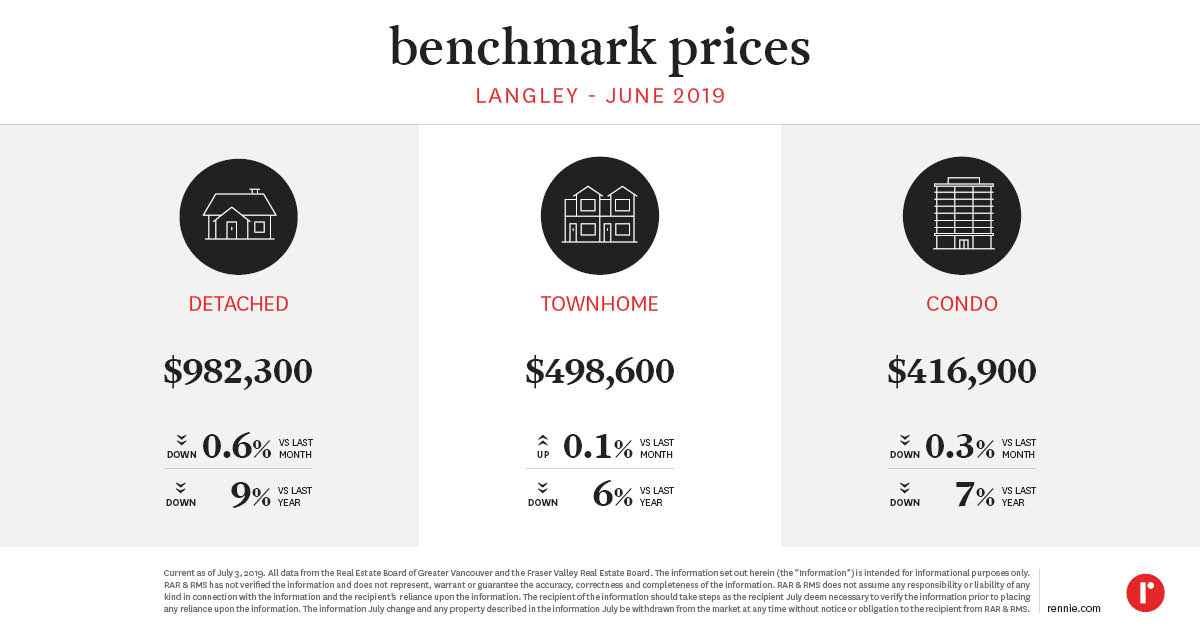 Pitt Meadows
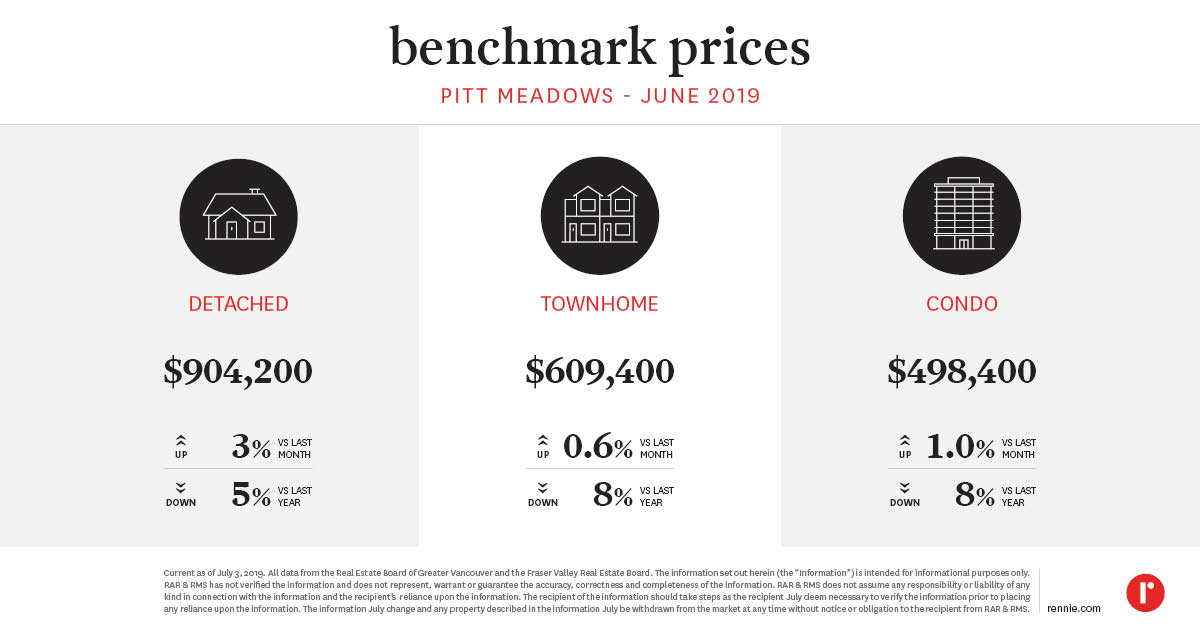 Maple Ridge
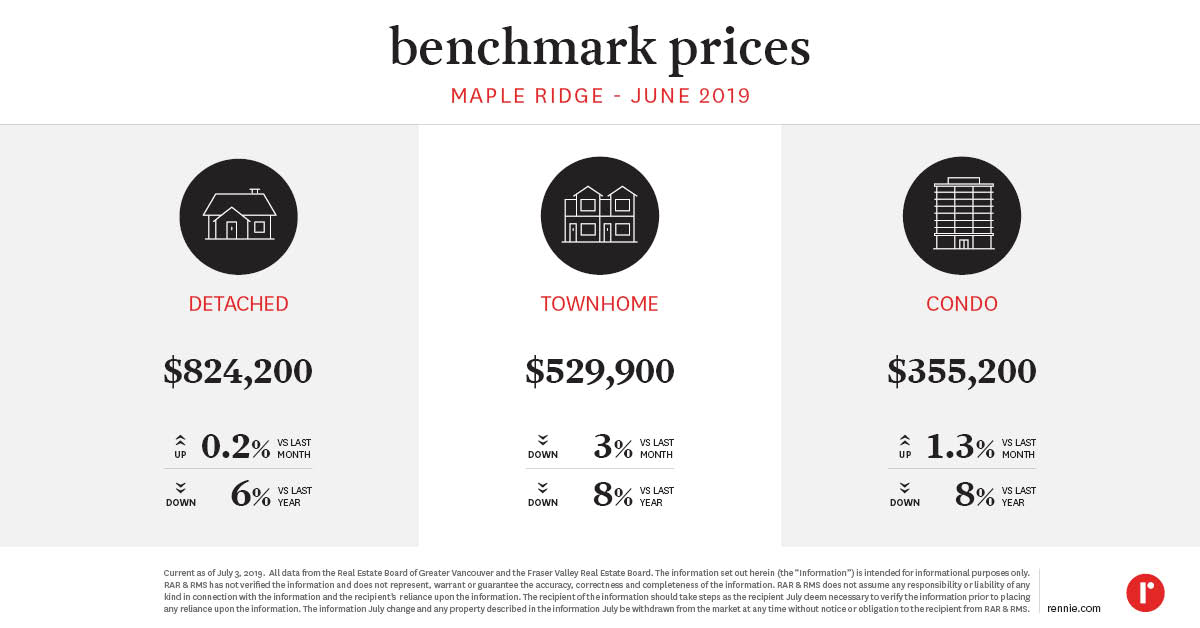 White Rock
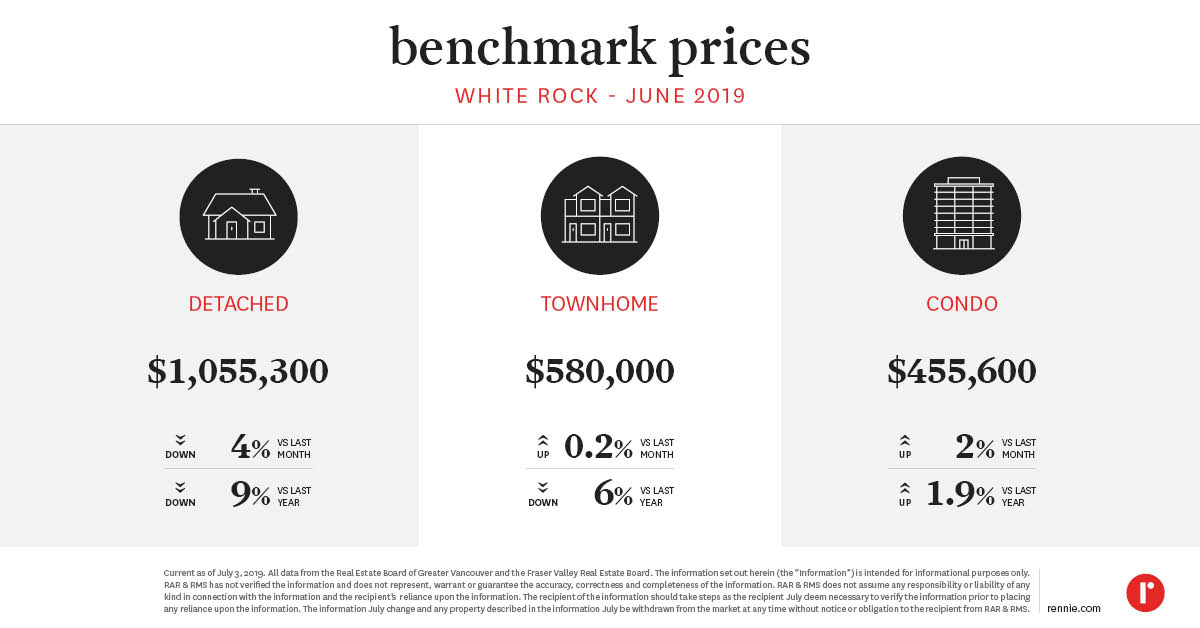 Abbotsford
 Chilliwack and District Board Area
Burnaby EastBurnaby NorthBurnaby SouthCoquitlamNorth VancouverRichmondVancouver EastVancouver WestWest VancouverNew WestminsterSquamishTsawwassenPort CoquitlamPort MoodyFraser Valley Board AreaSurreyLangleyPitt MeadowsMaple RidgeWhite RockAbbotsfordChilliwack and District Board Area Note, the Chilliwack and District Board Area (CADREB) denotes the Median Sales Price rather than the Benchmark Price. The CADREB does not have a benchmark price available for record.
Written by
Ryan Berlin
Related
the vancouver rennie advance | April 2026
The Vancouver Region registered its second-fewest March sales in more than two decades. New listings activity through 2026 remains above long-run average levels, but is down from last year’s record pace, and inventory registered its first year-over-year decline in 31 months.
Today
Report
benchmark prices | March 2026
Benchmark price infographics for detached homes, townhomes, and condos are available for sub-markets in the Vancouver Region, Greater Victoria, and Central Okanagan regions.
Mar 2026
Report