Benchmark Prices - March 2019
Mar 11, 2019
Written by
Ryan BerlinSHARE THIS
Here are the Benchmark Price Infographics for the areas of the Lower Mainland covered in the monthly rennie review. The areas include the REBGV, Burnaby East, Burnaby North, Burnaby South, Coquitlam, North Vancouver, Richmond, Vancouver East, Vancouver West, West Vancouver, New Westminster, Squamish, Tsawwassen, Port Coquitlam, Port Moody, FVREB, Surrey, Langley, Pitt Meadows, Maple Ridge, White Rock, Abbotsford, and CADREB.Greater Vancouver Board Area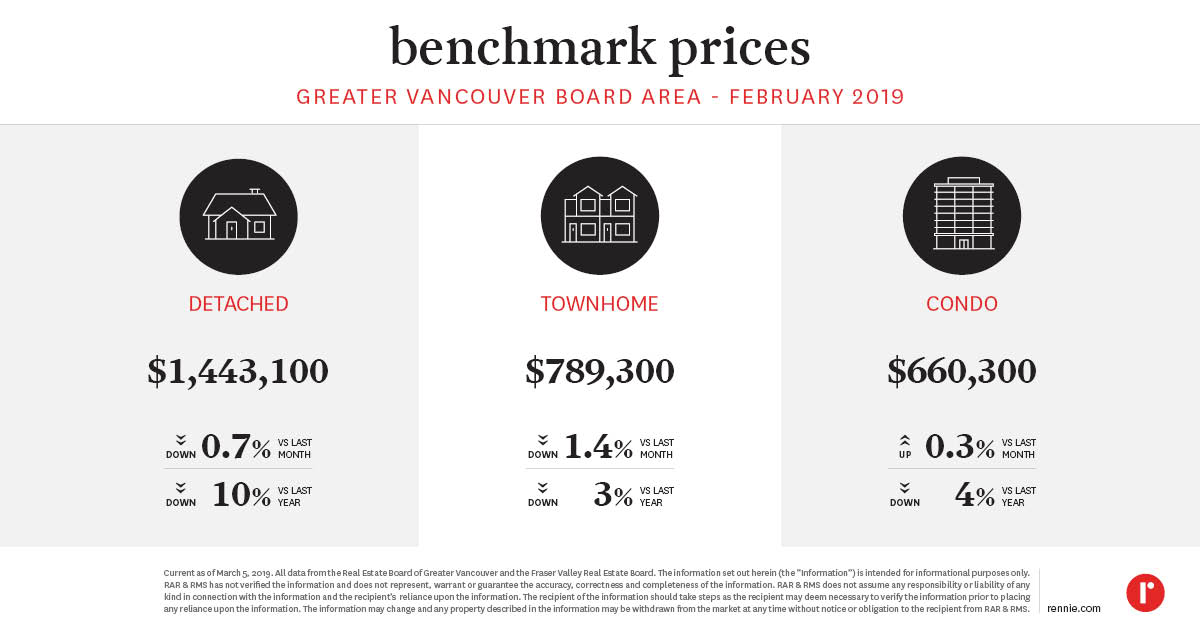 Burnaby East
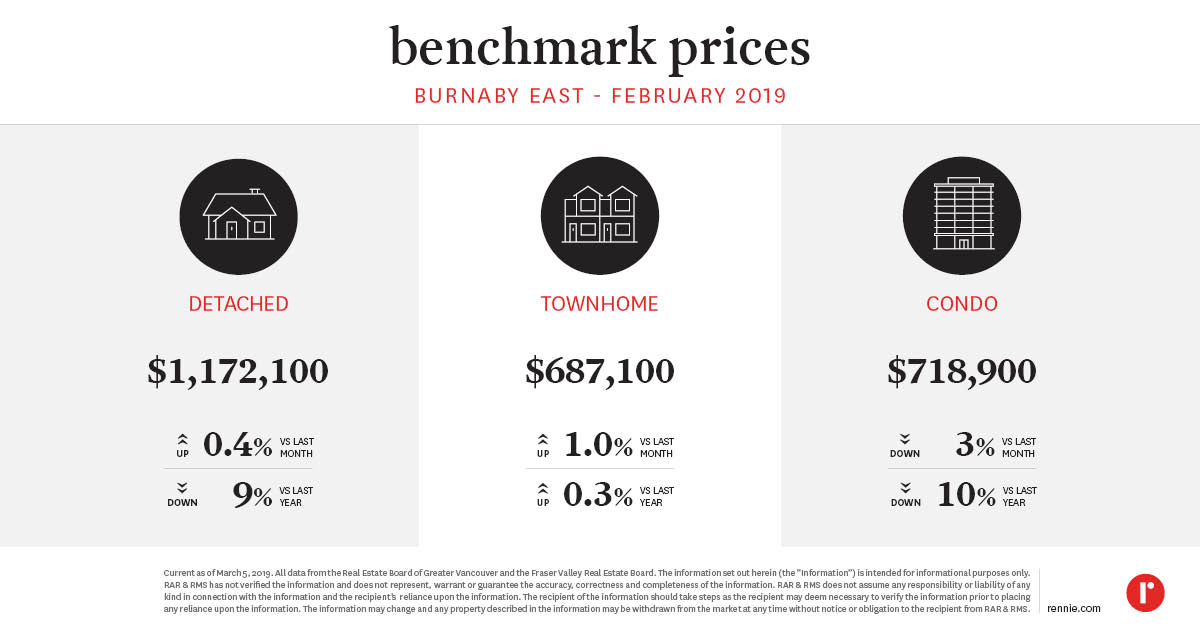 Burnaby North
 Burnaby South
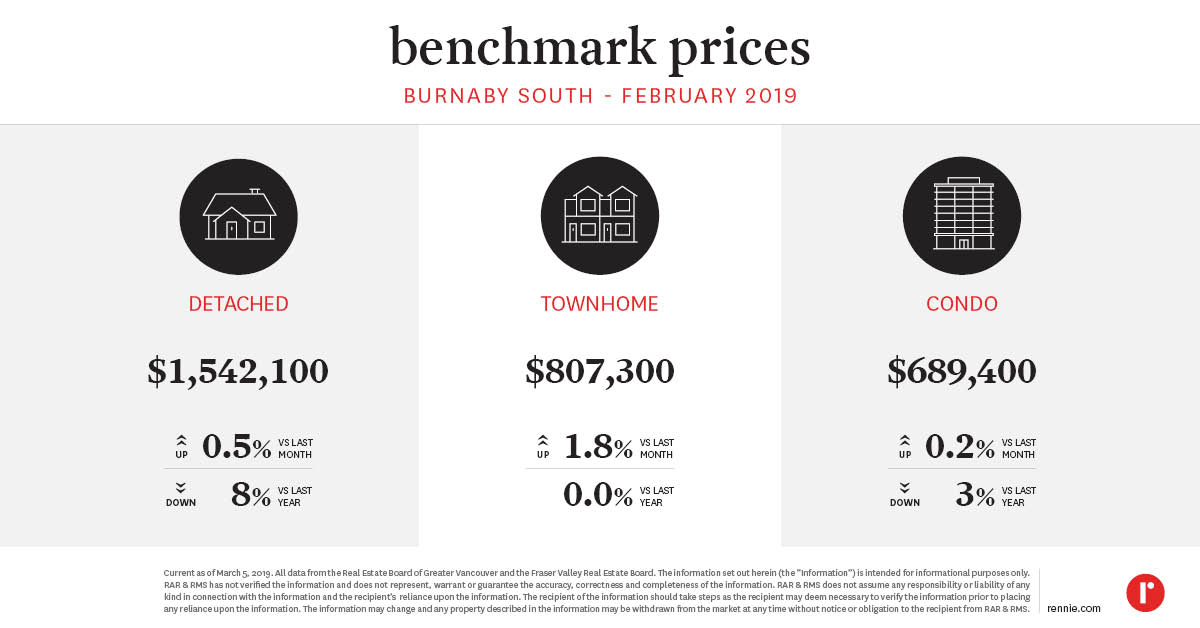 Coquitlam
 North Vancouver
 Richmond
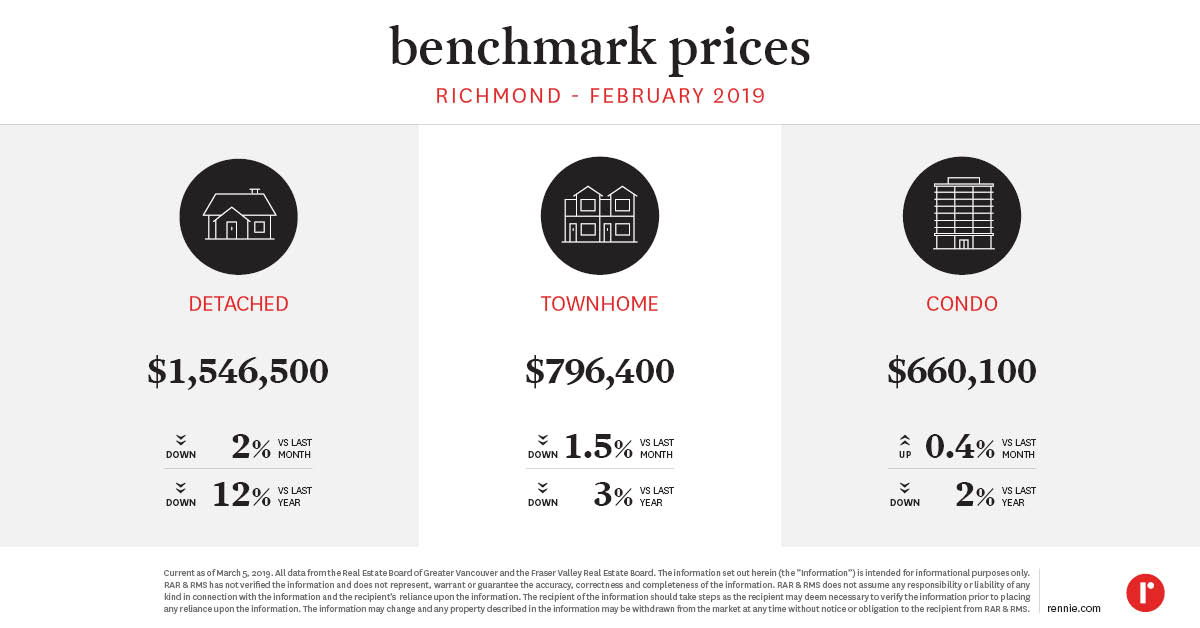 Vancouver East
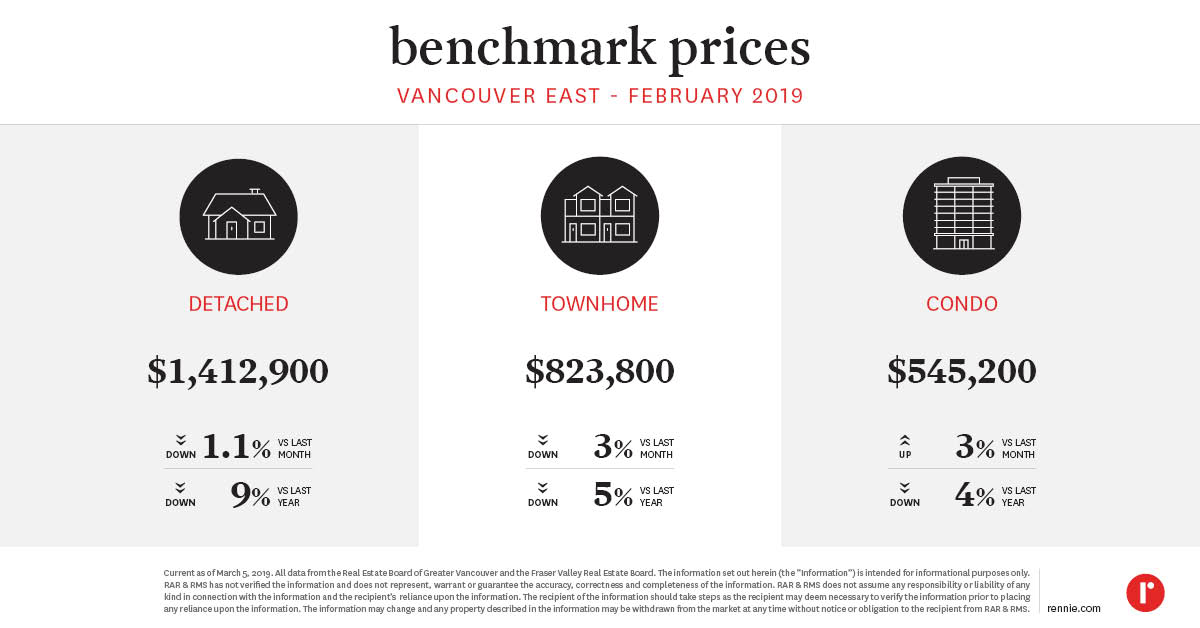 Vancouver West
 West Vancouver
 New Westminster
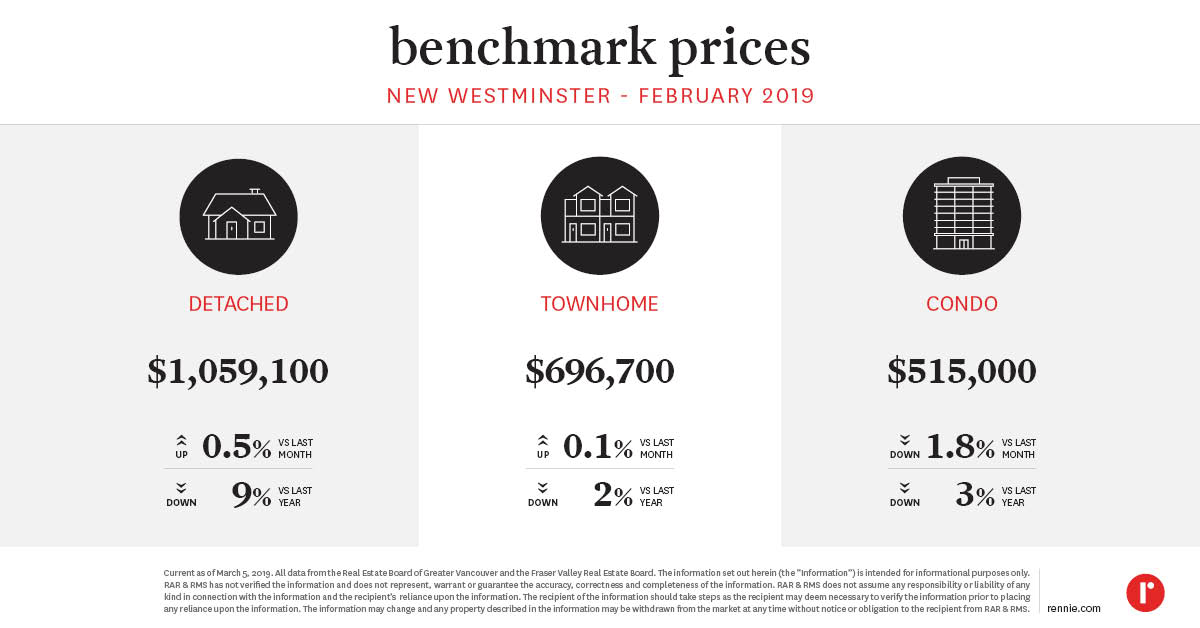 Squamish
 Tsawwassen
 Port Coquitlam
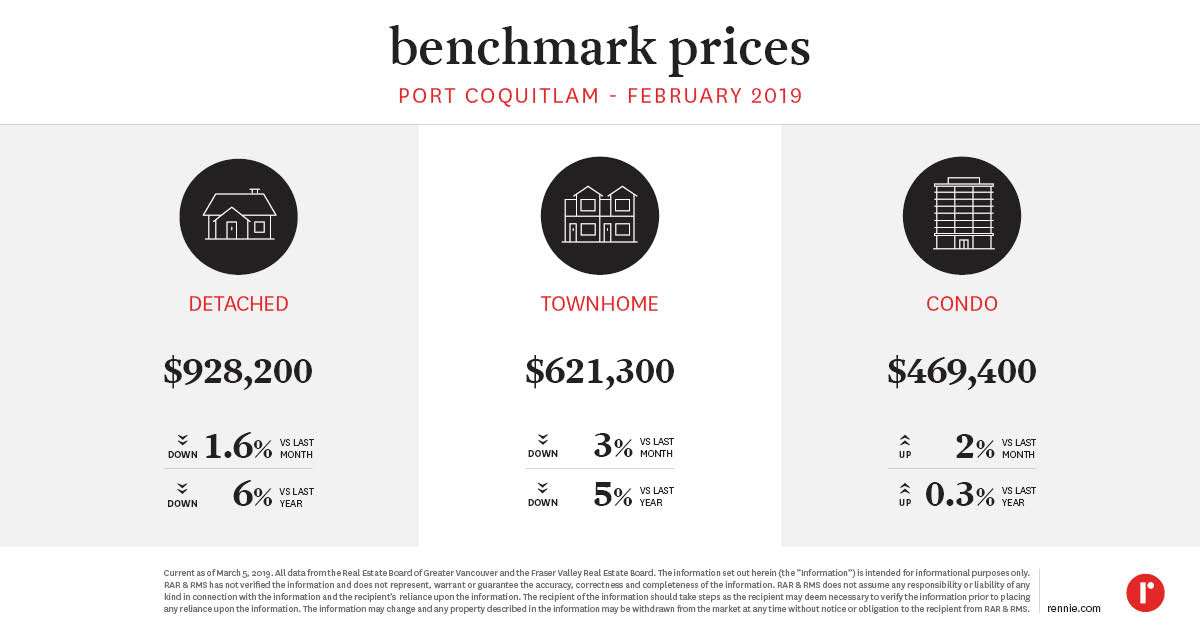 Port Moody
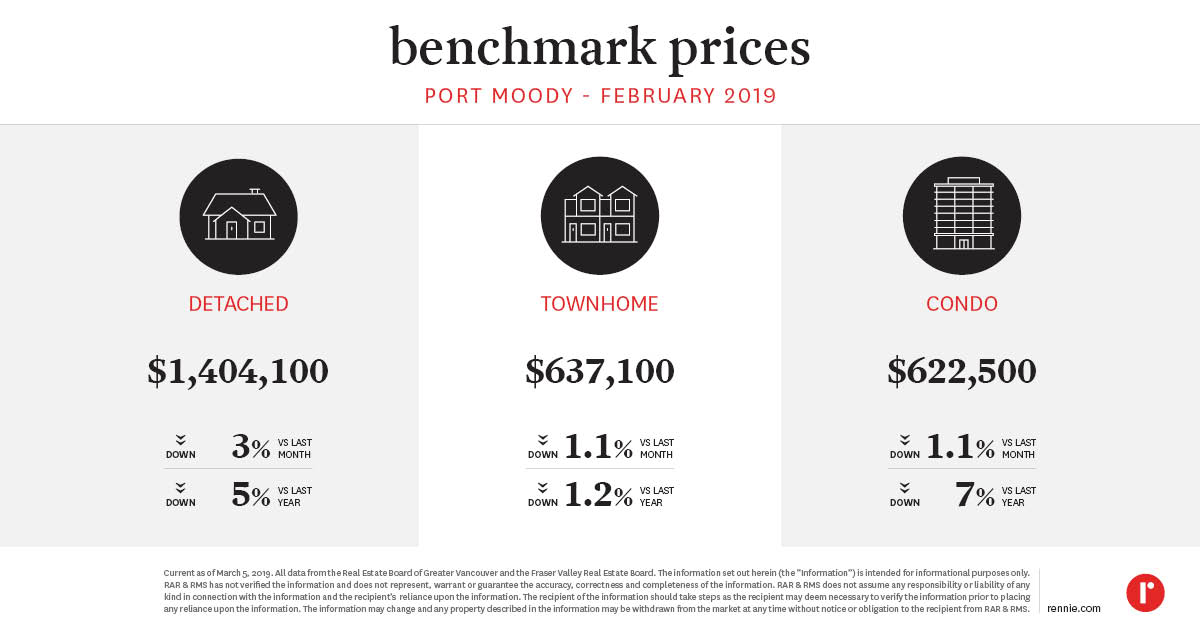 Fraser Valley Board Area
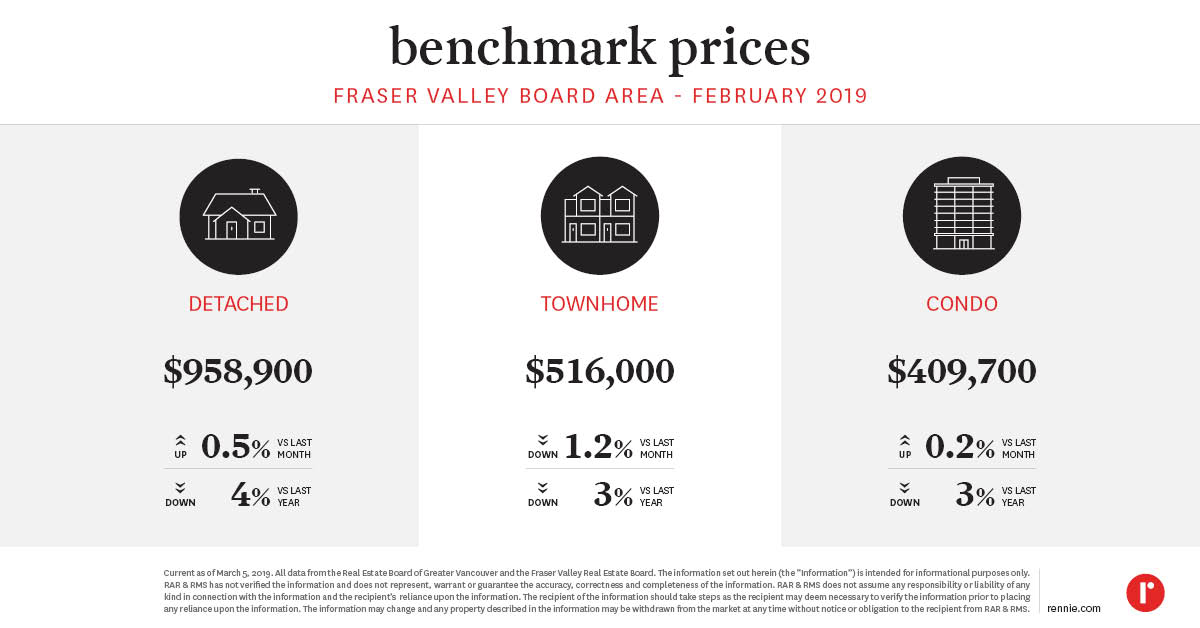 Surrey
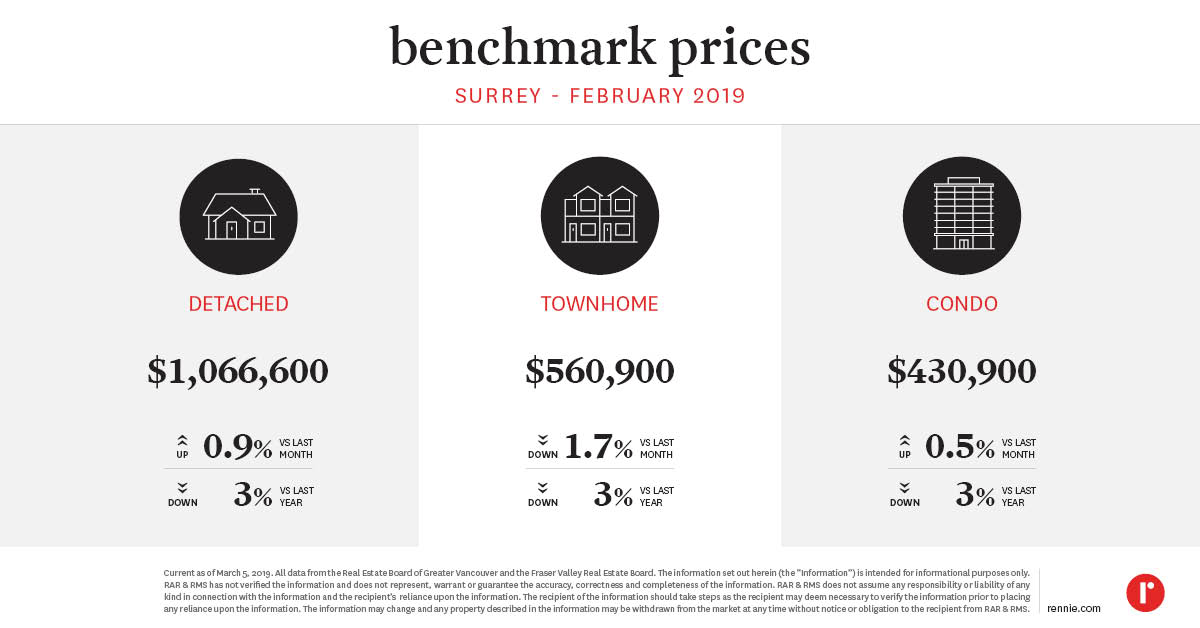 Langley
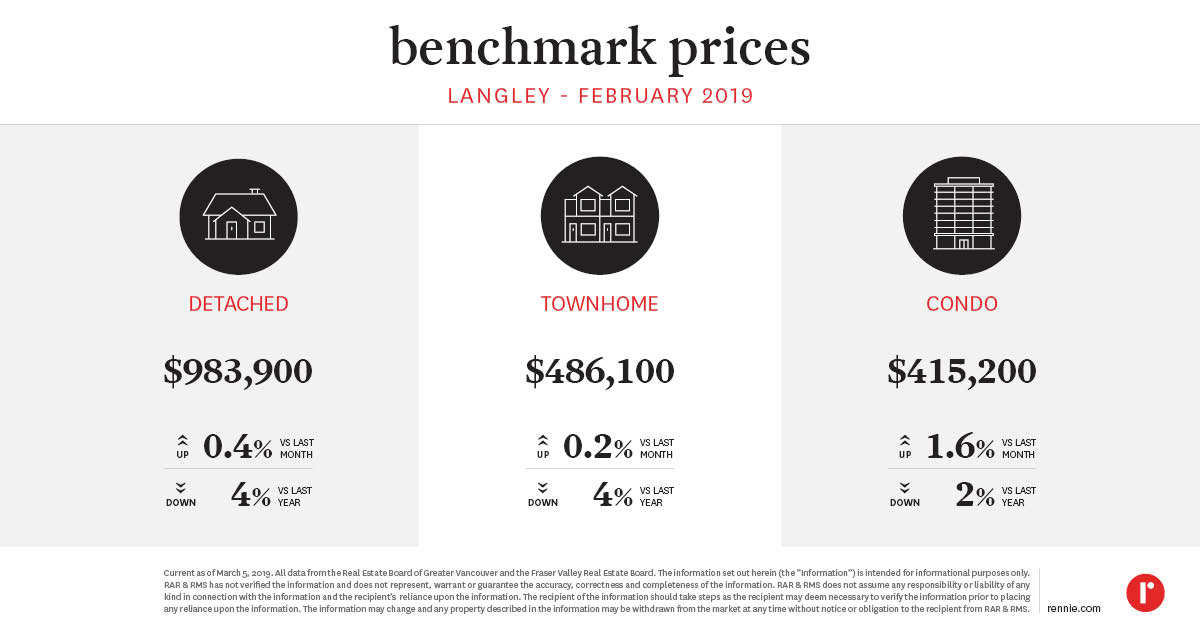 Pitt Meadows
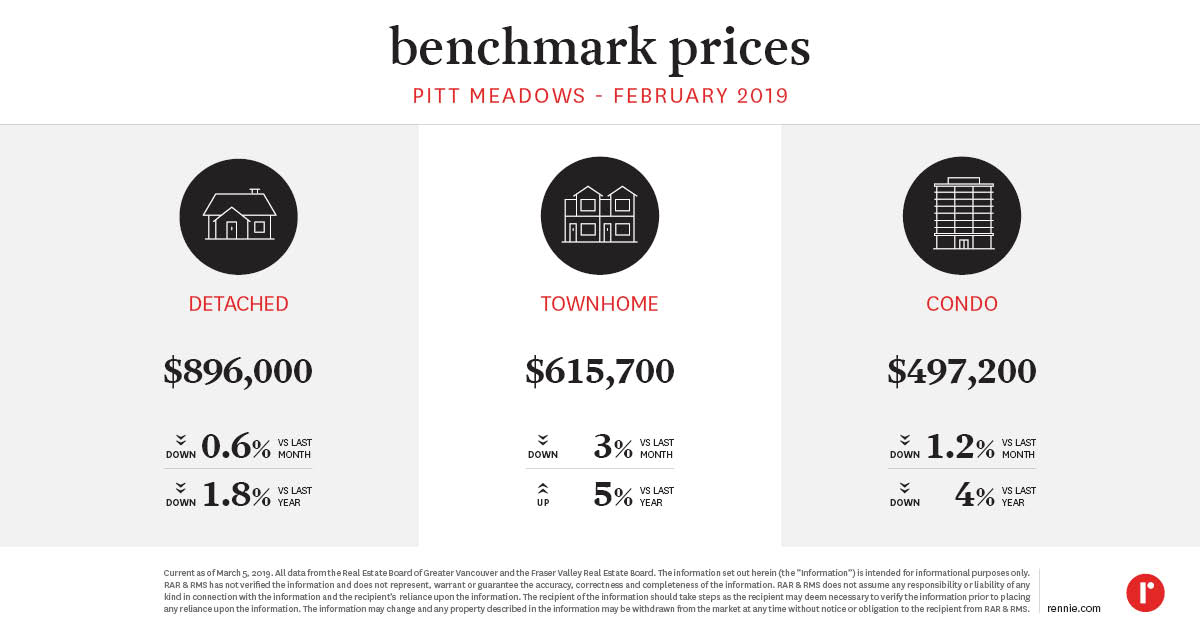 Maple Ridge
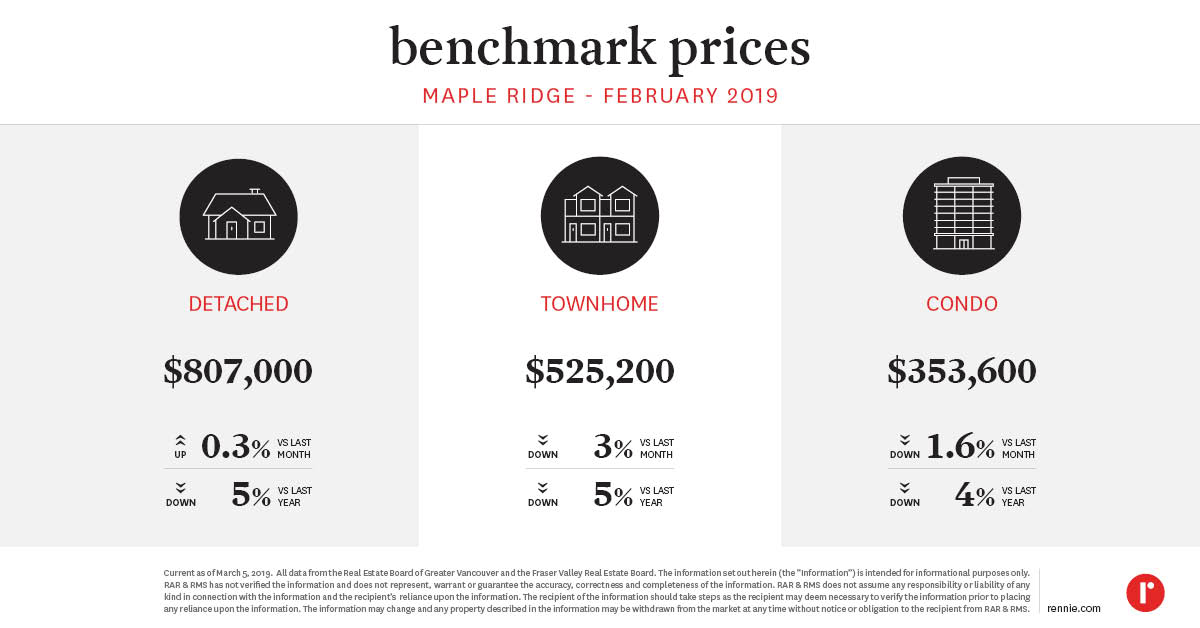 White Rock
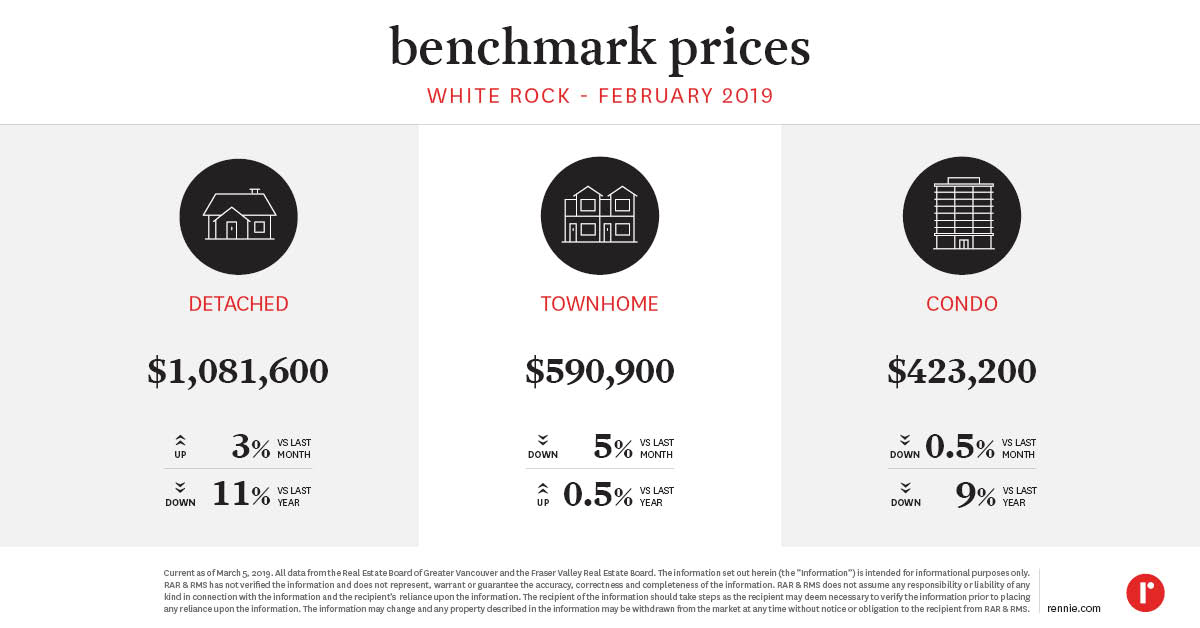 Abbotsford
 Chilliwack and District Board Area
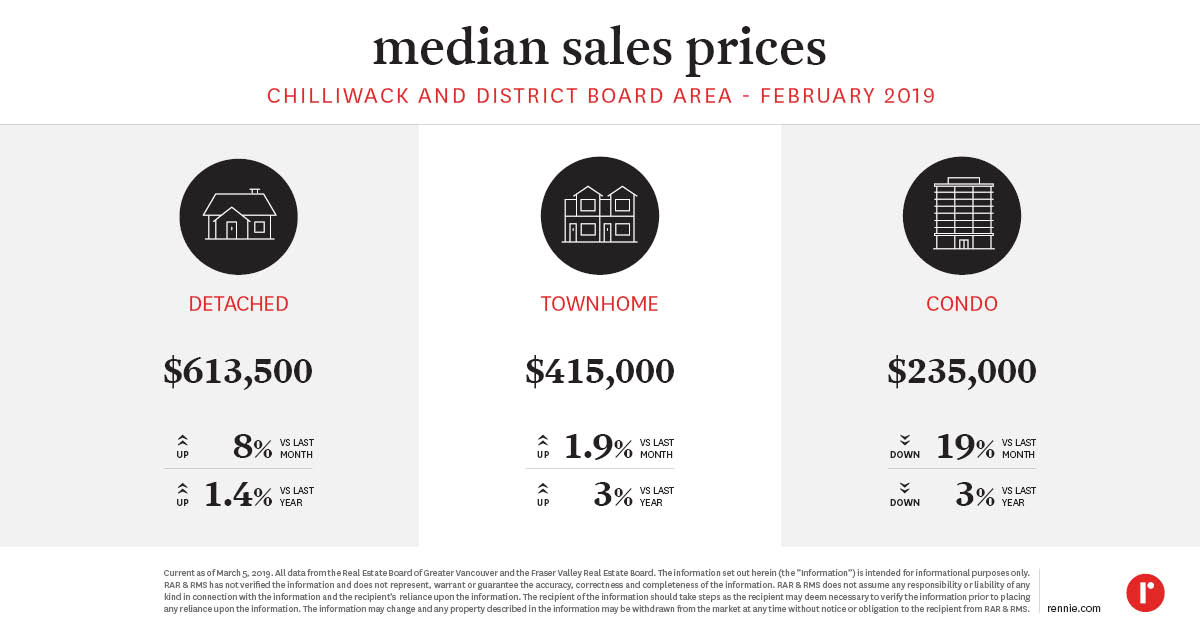 Note, the Chilliwack and District Board Area (CADREB) denotes the Median Sales Price rather than the Benchmark Price. The CADREB does not have a benchmark price available for record.
See Benchmark Prices Infographics for February 2019 here. Our rennie intelligence division empowers individuals, organizations, and institutions with data-driven market insight and analysis. Experts in urban land economics, community planning, shifting demographics, and real estate trends, their strategic research supports a comprehensive advisory service offering and forms the basis of frequent reports and public presentations. Their thoughtful and objective approach truly embodies the core values of rennie.
Written by
Related
San Diego’s housing market remains stable, with middling sales accompanied by slowly-expanding inventory, as rising listing counts may have already peaked on a seasonally-adjusted basis. All eyes are on inflation and interest rates as the war in Iran drives up the price of oil across the globe.
Apr 2026
Report
Home sales in King County remain below long-run levels against a backdrop of expanded listing counts. The war in Iran presents new challenges for inflation and interest rates and, by extension, home buyers and sellers.
Apr 2026
Report