the rennie advance - April 2023
Apr 03, 2023
Written by
Ryan BerlinSHARE THIS
In March, total MLS sales rose by 50% from February, which was a much larger jump than the typical 28% increase. Last month’s total of 4,022 sales, however, was 25% below the past 10-year March average. Inventory, on the other hand, only increased by 3% from the previous month and ended March 25% below the long-run average. Total Listings
 Median Prices
 The rennie advance is a monthly publication which includes a brief summary of the latest regional housing sales and listing activity, produced the same morning as the data is released.Our rennie intelligence team comprises our in-house demographer, senior economist, and market analysts. Together, they empower individuals, organizations, and institutions with data-driven market insight and analysis. Experts in urban land economics, community planning, shifting demographics, and real estate trends, their strategic research supports a comprehensive advisory service offering and forms the basis of frequent reports and public presentations. Their thoughtful and objective approach truly embodies the core values of rennie.
Sales
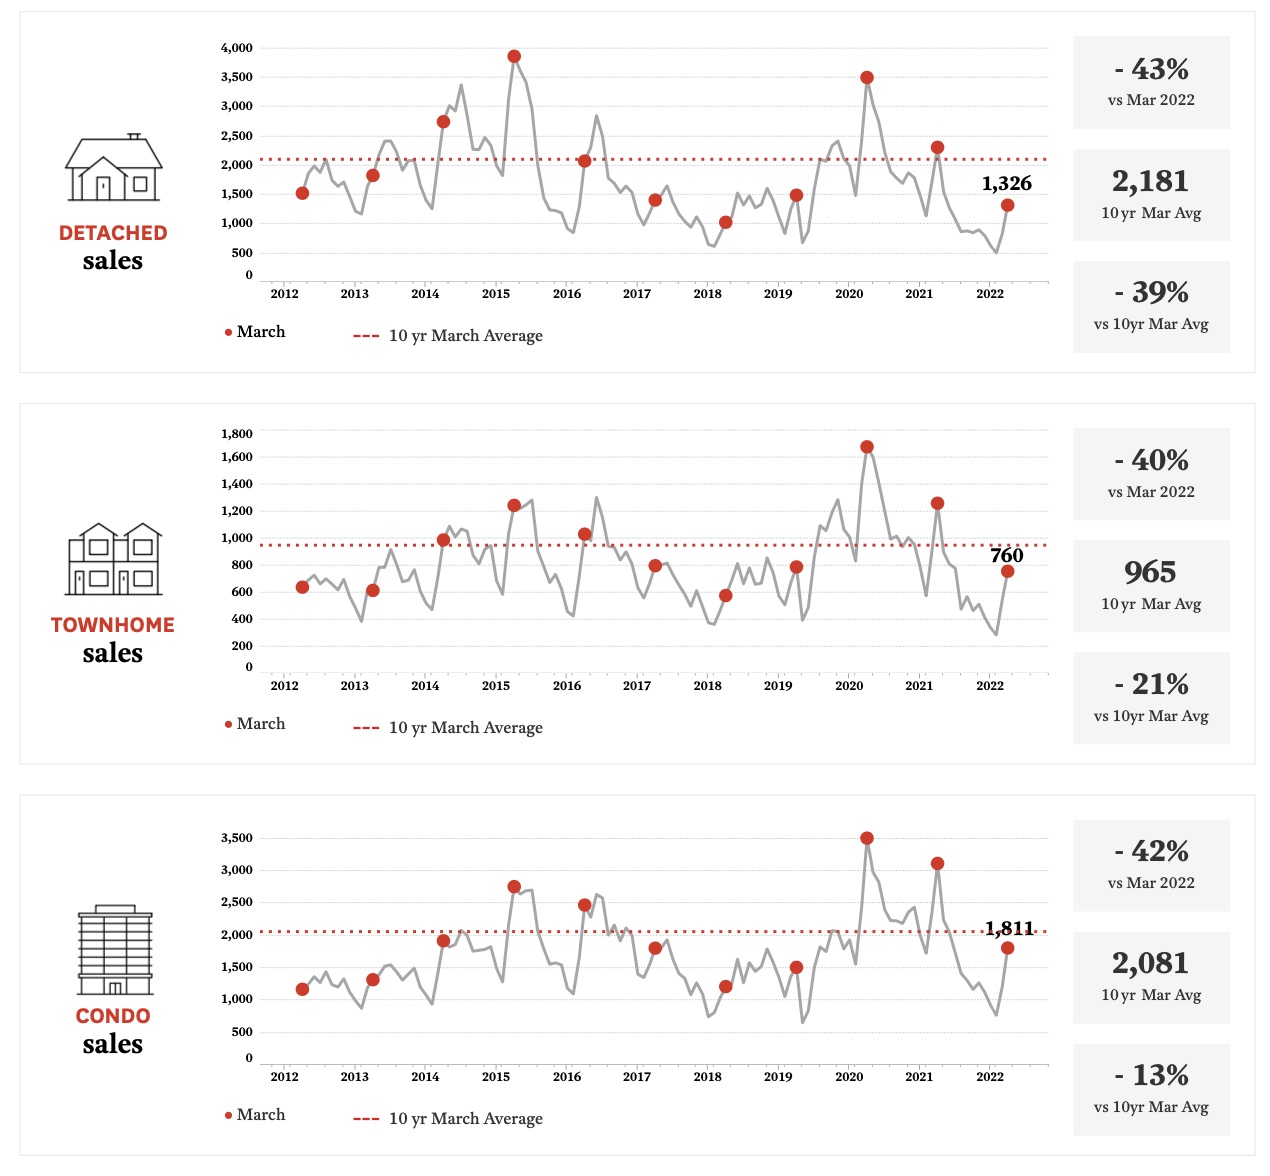
- There were 4,022 MLS sales in the Vancouver Region in March, a 50% increase (1,349 additional sales) compared to February, and greater than the typical 28% month-over-month increase. Despite this, the total sales count was 25% below the past 10-year average of 5,335 and 41% below the sales count of March 2022 (of 6,833).
- On a month-over-month basis, sales of detached homes increased by 58% (to 1,326) in March, from February’s 838. Condo sales followed closely behind, increasing by 49% (to 1,811), while townhome sales increased by 39% (to 760).
- Compared to March of last year, detached home sales were down the most among home types (by 43%), followed by condo sales (which were down 42%), and townhome sales (down 40%).
 Total Listings
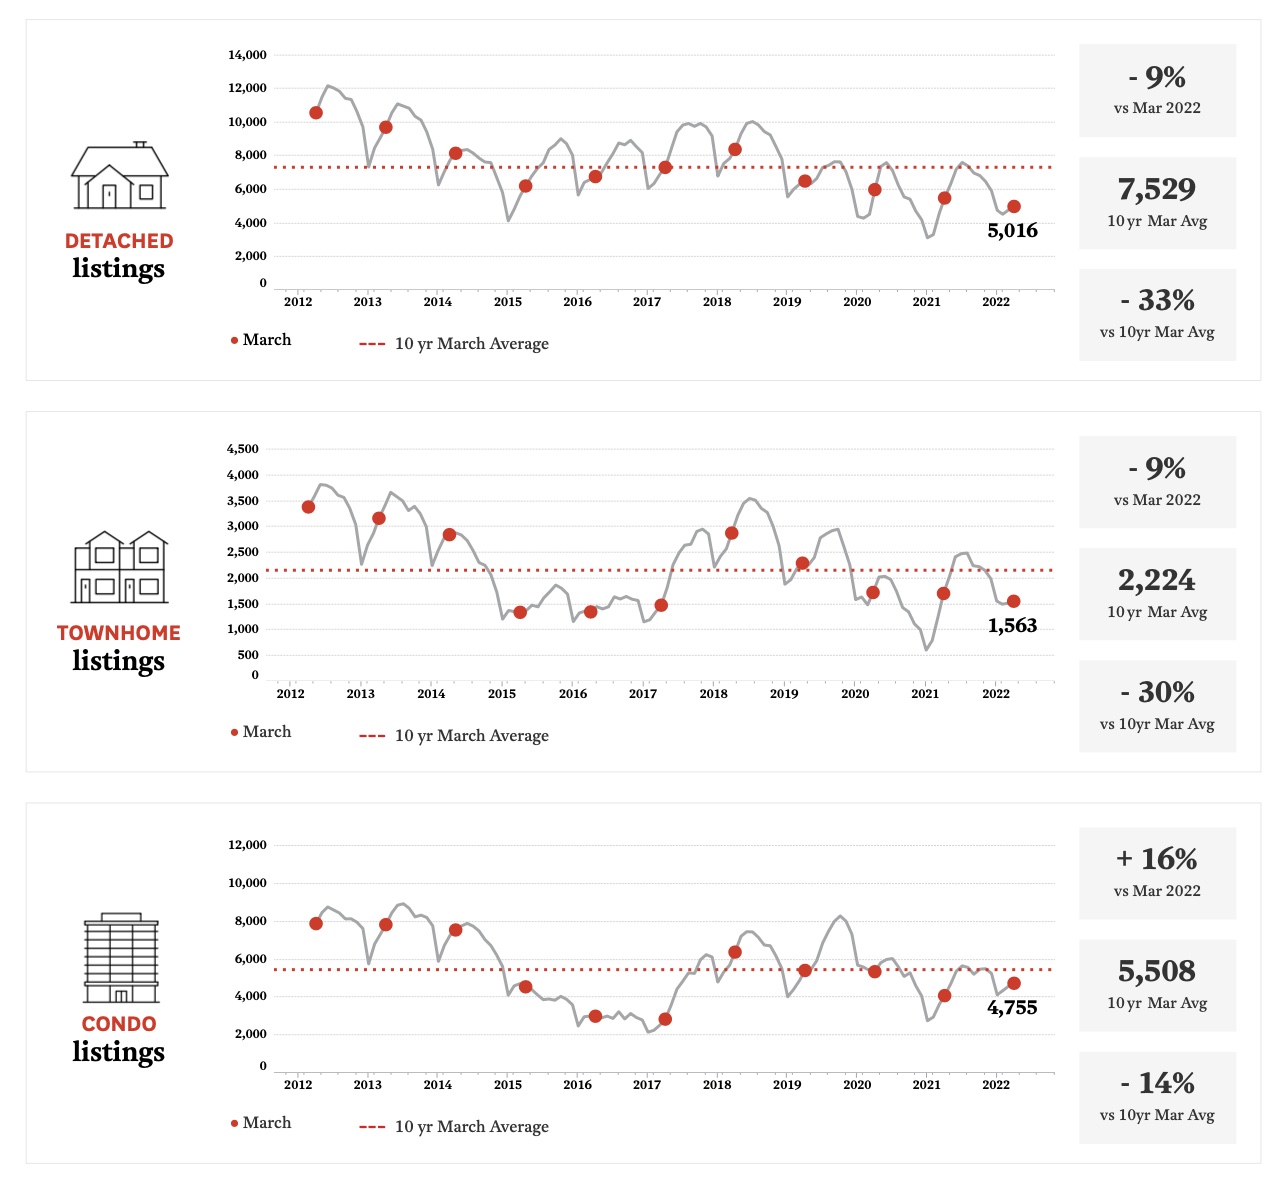
- The 3% increase in total MLS listings in the Vancouver Region between February and March (11,758) was lower than the typical seasonal increase of 7%. Overall, March’s inventory was 25% below the past 10-year average of 15,622.
- On a month-over-month basis, detached home inventory rose by 4% (to 5,016 listings), closely followed by condo inventory, which rose by 3% (to 4,755). Townhome inventory rose by 2% (to 1,563). On a year-over-year basis, detached home and townhome inventories were down the most, at 9%, while condo listings were actually up by 16%.
- Overall, there were 2.9 months of inventory (MOI) in March, which was a significant decline from February’s MOI of 4.2. The market, on the whole, strongly favoured sellers, as did the markets of each home type: the detached home market had 3.8 MOI, the condo market 2.6, and townhome market 2.1.
 Median Prices
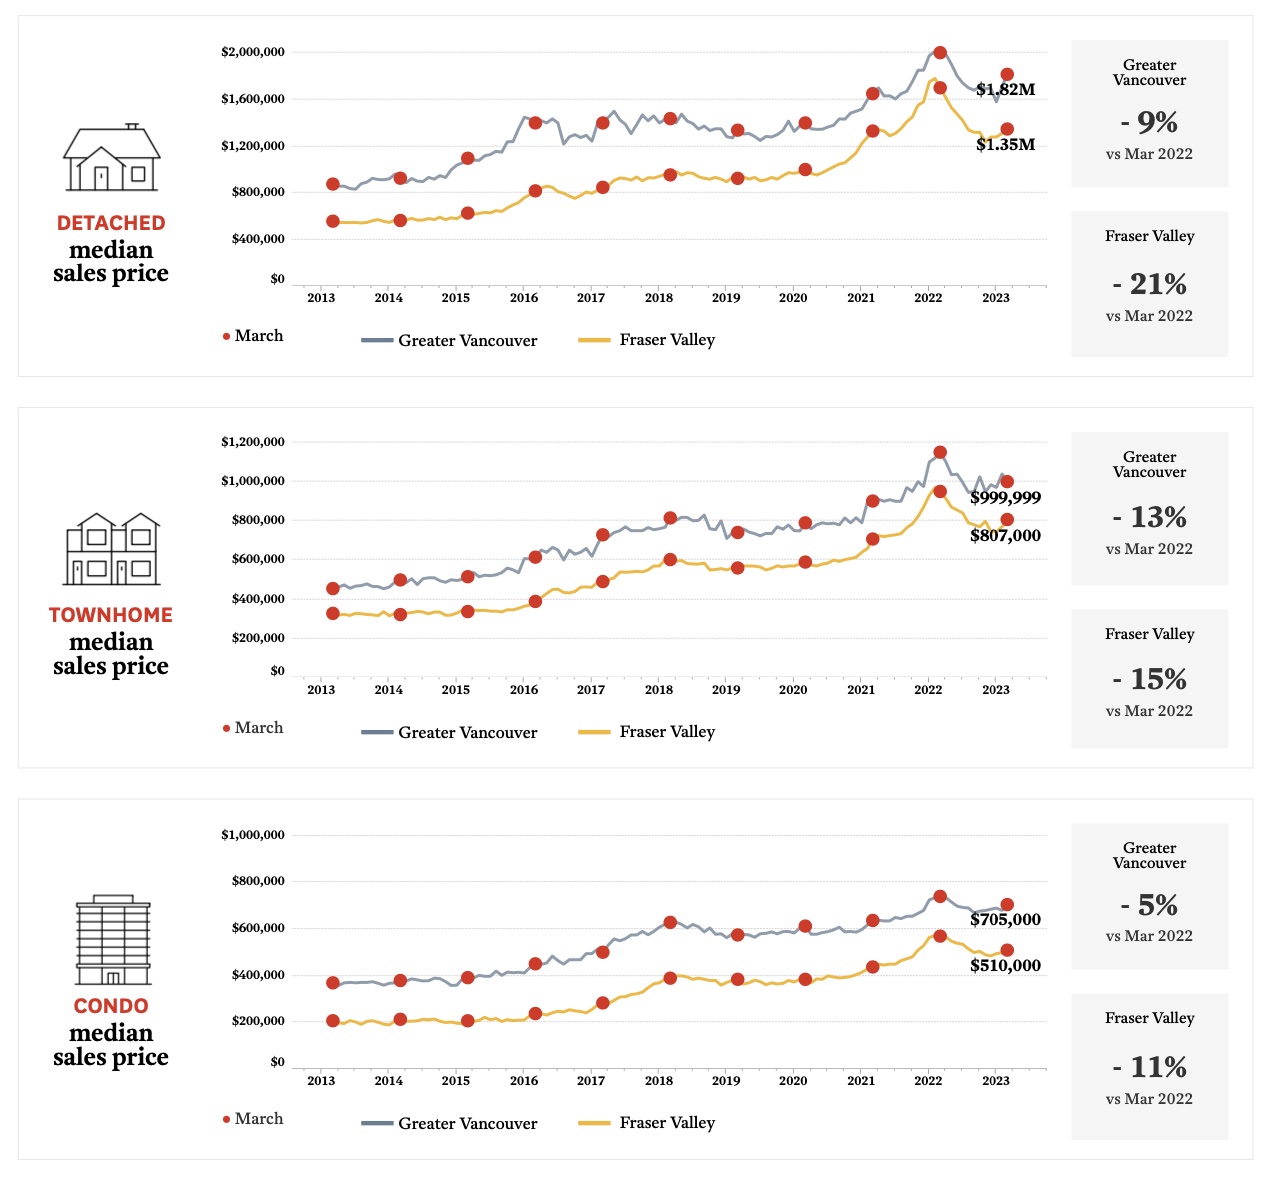
- On a month-over-month basis, March’s median prices increased, on average, by 3% in the Fraser Valley board area, and by 2% in the Greater Vancouver board area. Year-over-year, median prices were, on average, down by 15% in the Fraser Valley and by 9% in Greater Vancouver.
- Compared to February, detached home prices in Greater Vancouver in March were up 6%, and for condos they were up 4%; that said, townhome median prices were down 4%. In the Fraser Valley, median prices were up for all home types, with townhomes up the most, by 5%, followed by detached homes at 3% and condos at 2%.
- Compared to March 2022, median prices were lower for all home types in both board areas. In Greater Vancouver, townhomes were down the most (by 13%), followed by detached homes (by 9%), and condos (by 5%). In the Fraser Valley, detached home median prices were down the most (by 21%), followed by townhomes (by 15%), and condos (by11%).
 The rennie advance is a monthly publication which includes a brief summary of the latest regional housing sales and listing activity, produced the same morning as the data is released.Our rennie intelligence team comprises our in-house demographer, senior economist, and market analysts. Together, they empower individuals, organizations, and institutions with data-driven market insight and analysis. Experts in urban land economics, community planning, shifting demographics, and real estate trends, their strategic research supports a comprehensive advisory service offering and forms the basis of frequent reports and public presentations. Their thoughtful and objective approach truly embodies the core values of rennie.
Written by
Ryan Berlin
Related
the kelowna rennie review | December 2025
Active listings in the Central Okanagan are much more elevated than in neighbouring markets like the South and North Okanagan, largely a function of condos. As a result, overall supply-demand conditions in the Central Okanagan are much looser than its peers.
Dec 2025
Report
the victoria rennie review | December 2025
While resale transactions in Greater Victoria have been trending well below average this year, housing starts have moved in the opposite direction, buoyed by the record pace of new purpose-built rental construction.
Dec 2025
Report