Contact
Phone 604.682.2088
E-mail [email protected]
Office
110 - 1650 West 1st Avenue
Vancouver, BC V6J 1G1
Canada

Personal Real Estate Corporation | Rennie & Associates Realty Ltd.
Phil began his career as a rennie Advisor in 2010 and has since become one of the Brokerage's top-producing agents, achieving “rennie Leaders" multiple times, and Medallion Club, top 10% amongst the Greater Vancouver Realtors.
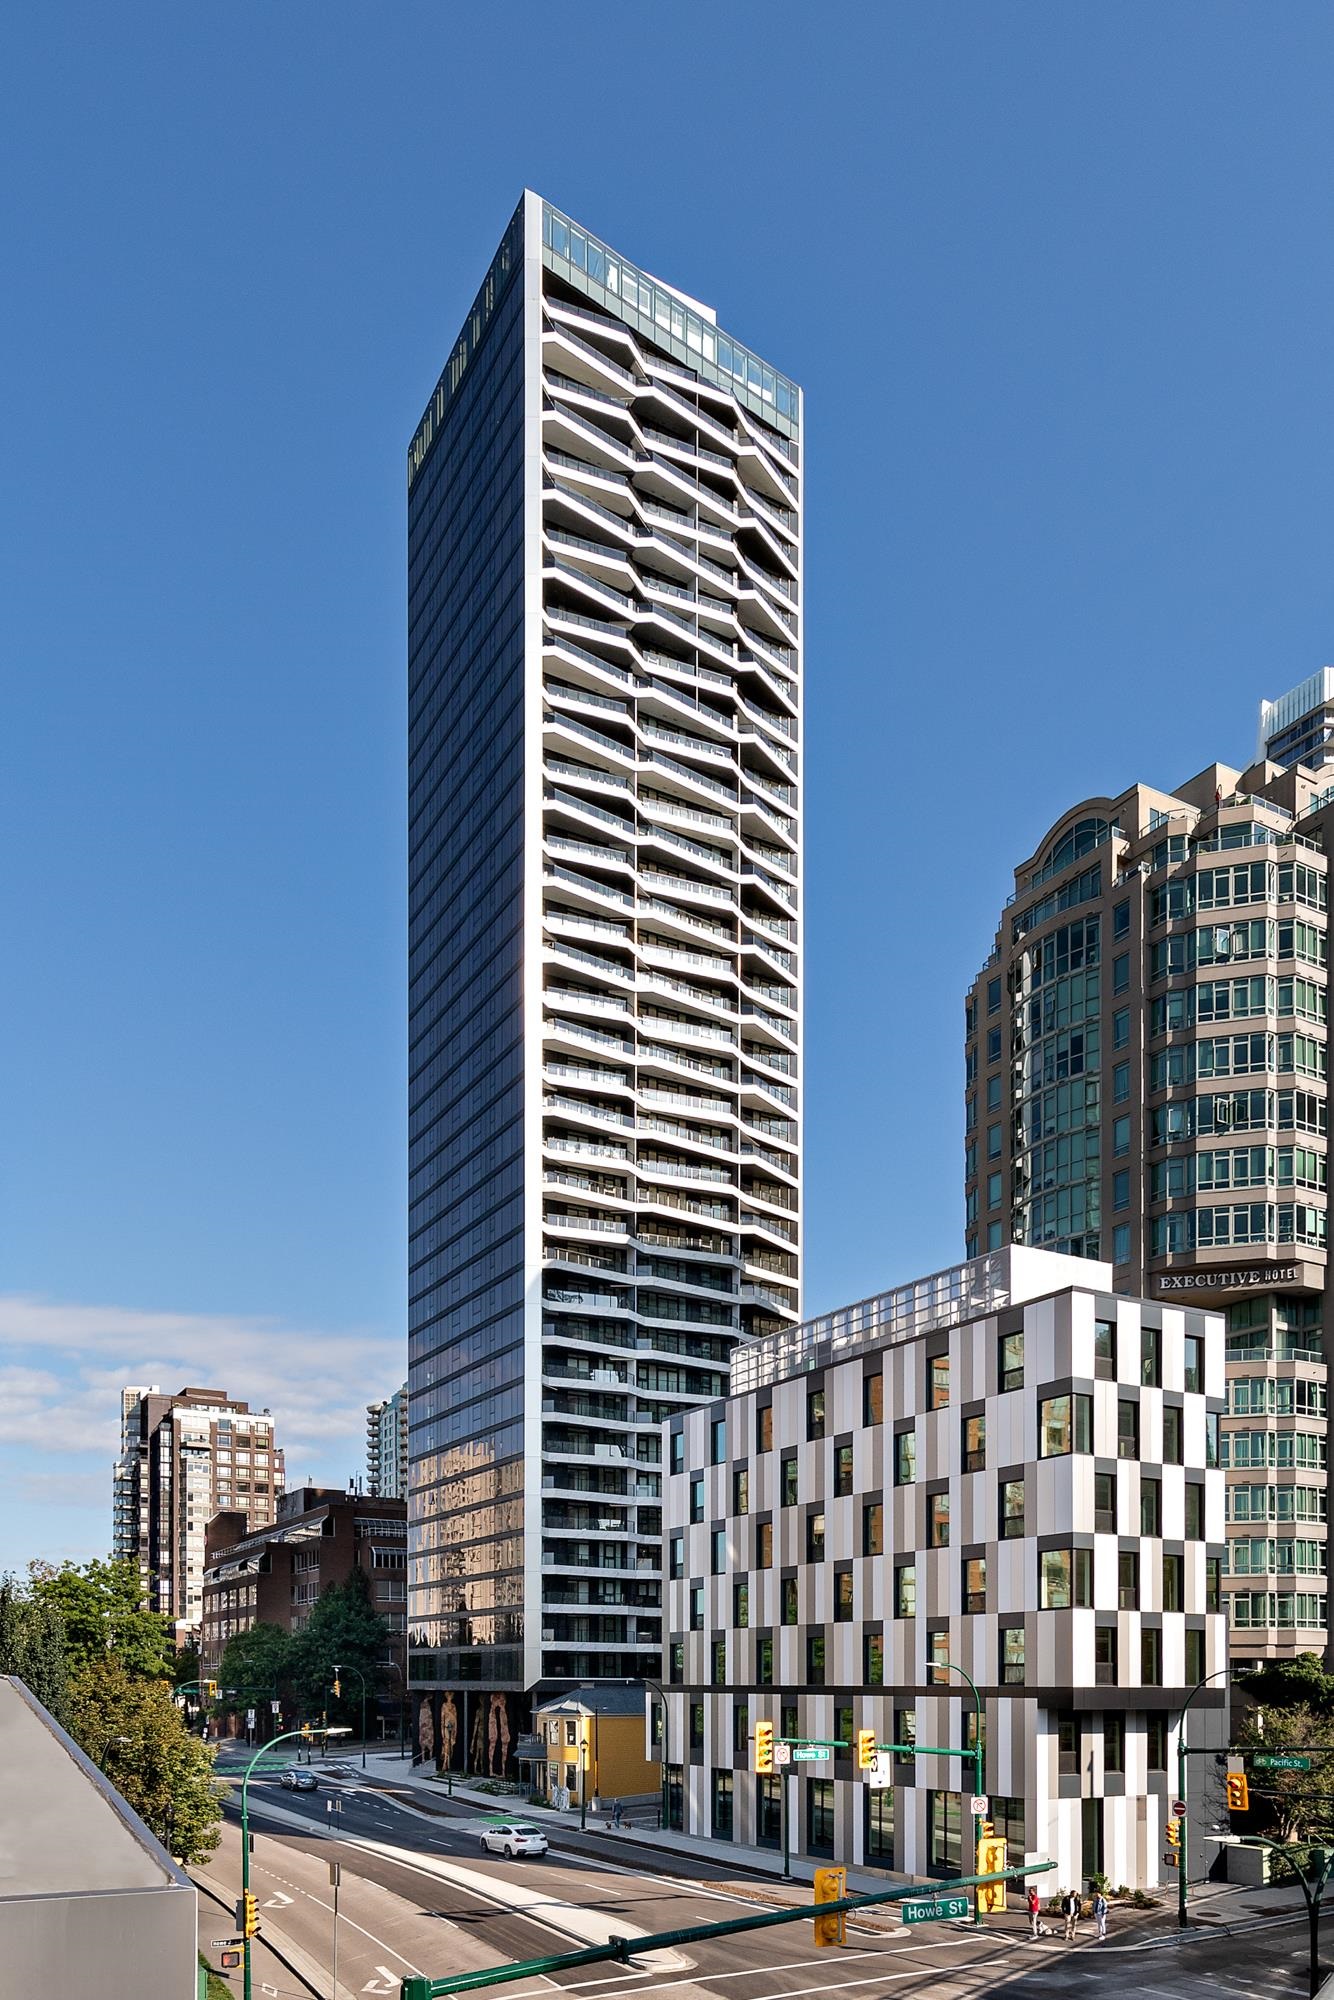
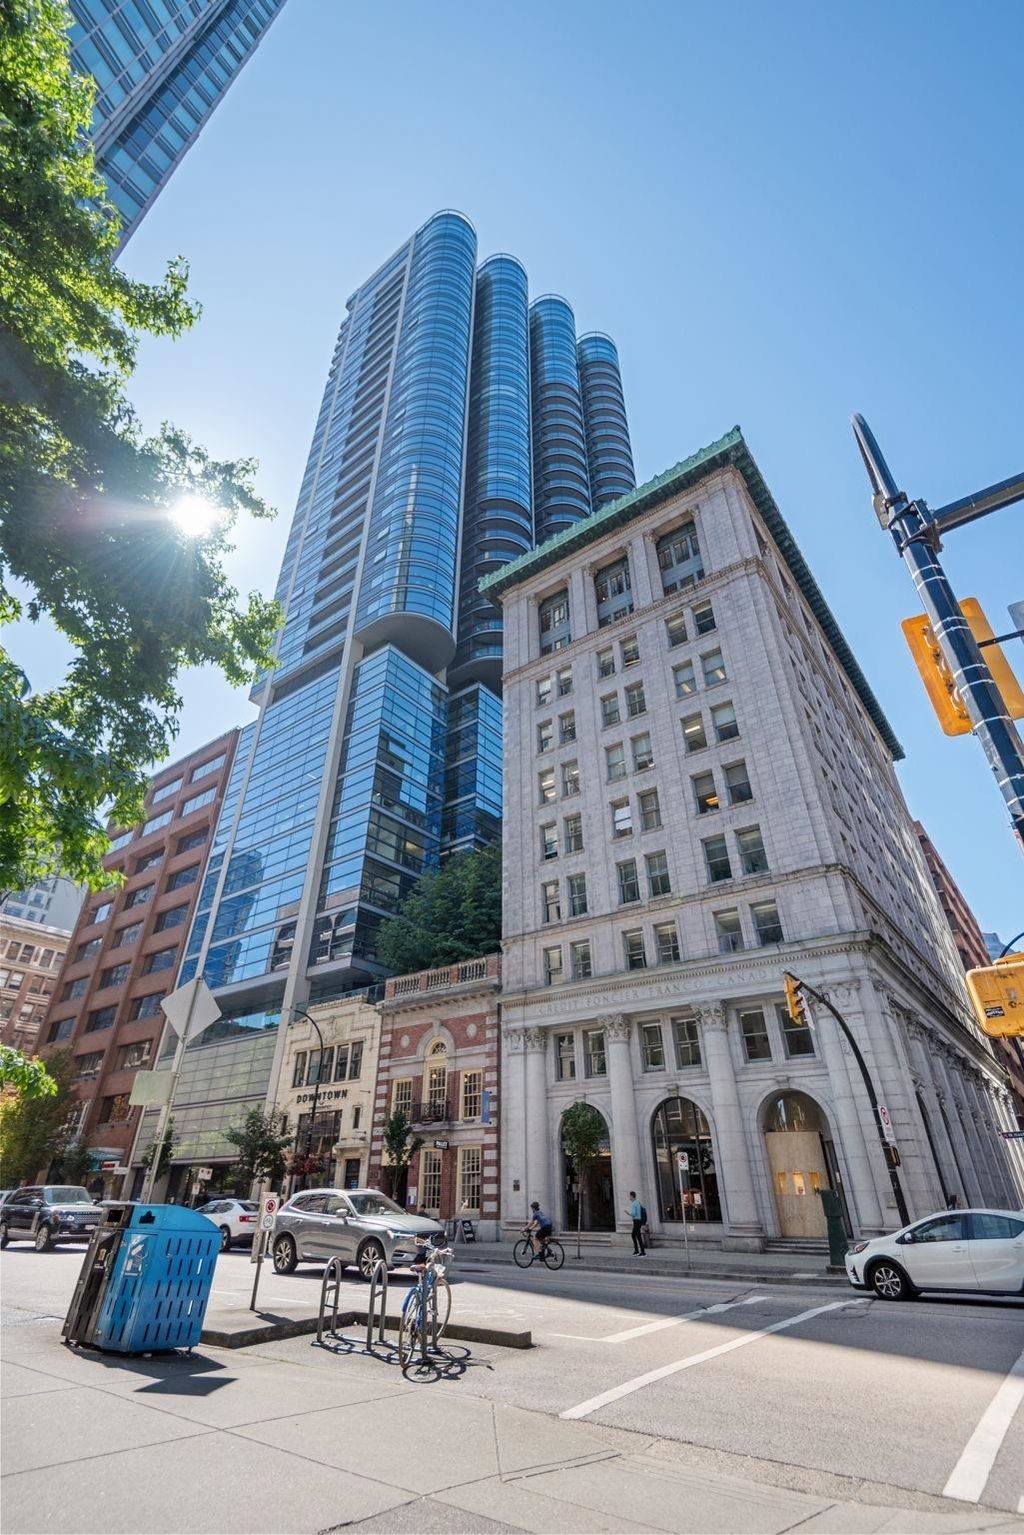
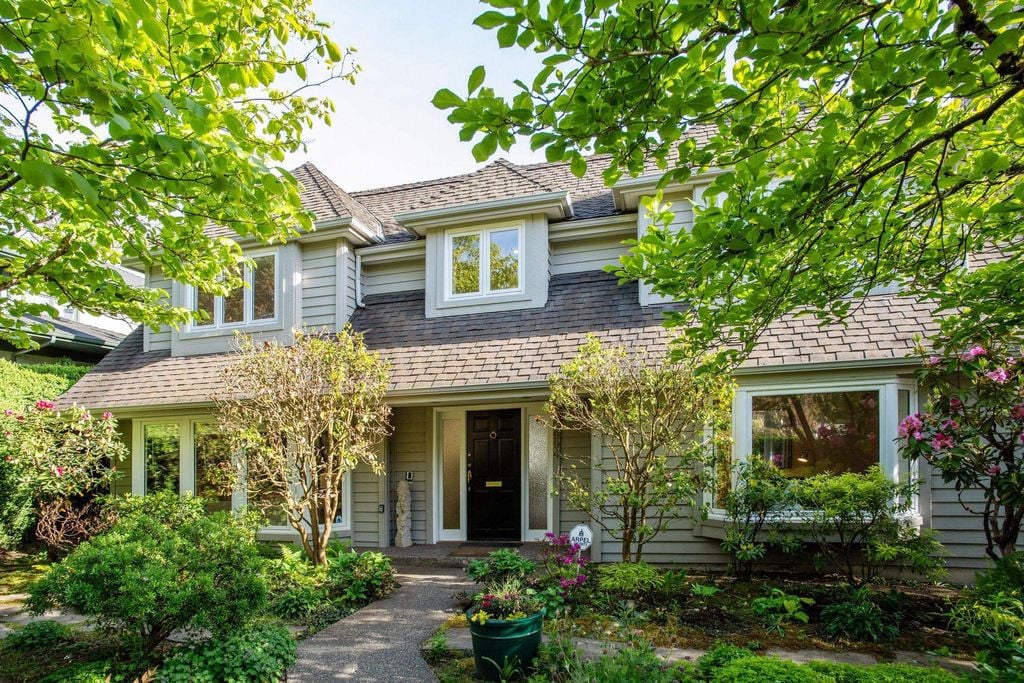
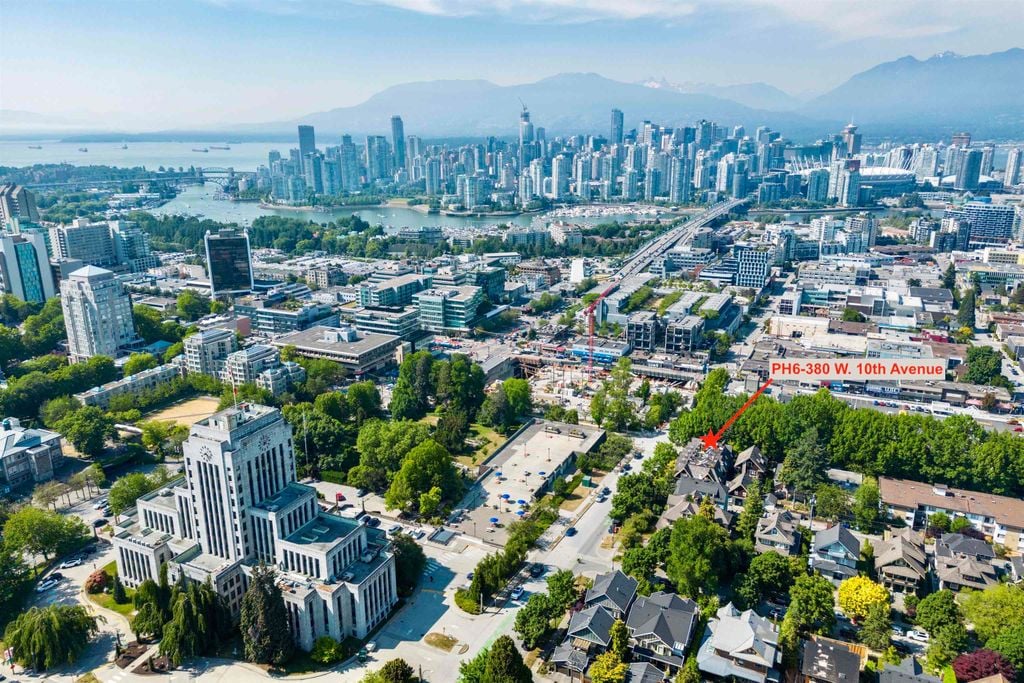
He’s not only demonstrated immense success in real estate but has also built a reputation for leadership and mentorship. He played a pivotal role in the successful marketing and sales of significant landmark projects, including the Village on False Creek, Canada House on the Water, Grosvenor Ambleside, and The Pacific by Grosvenor. His ability to navigate complex, high-profile developments with poise and expertise is a testament to his skill.
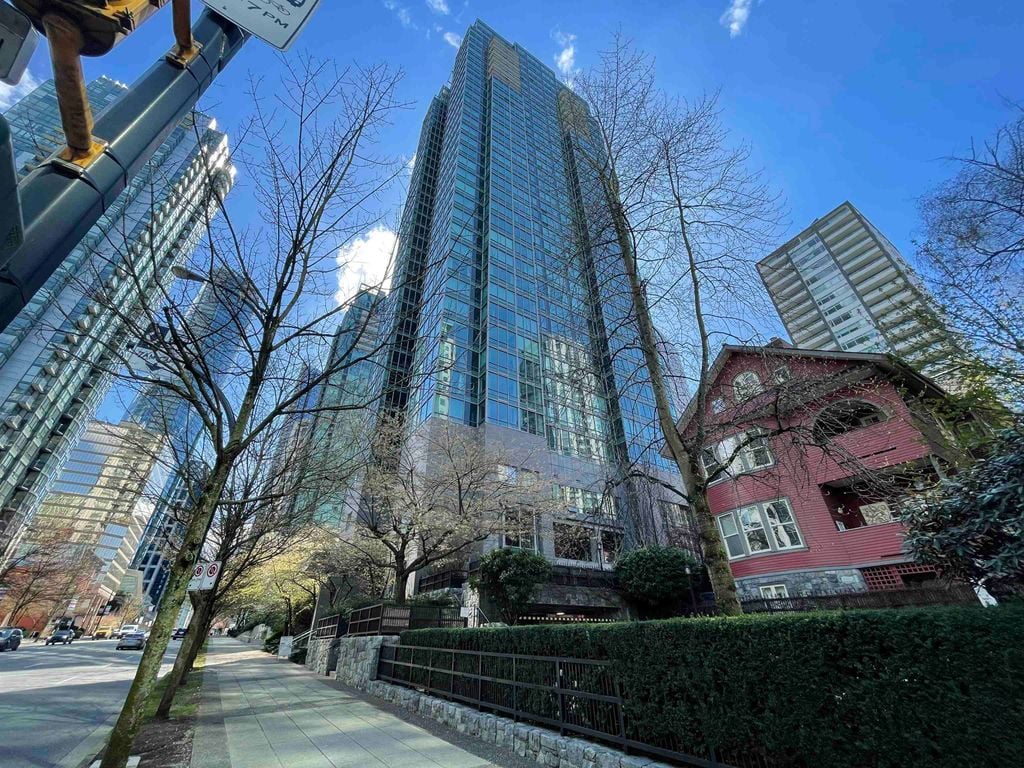
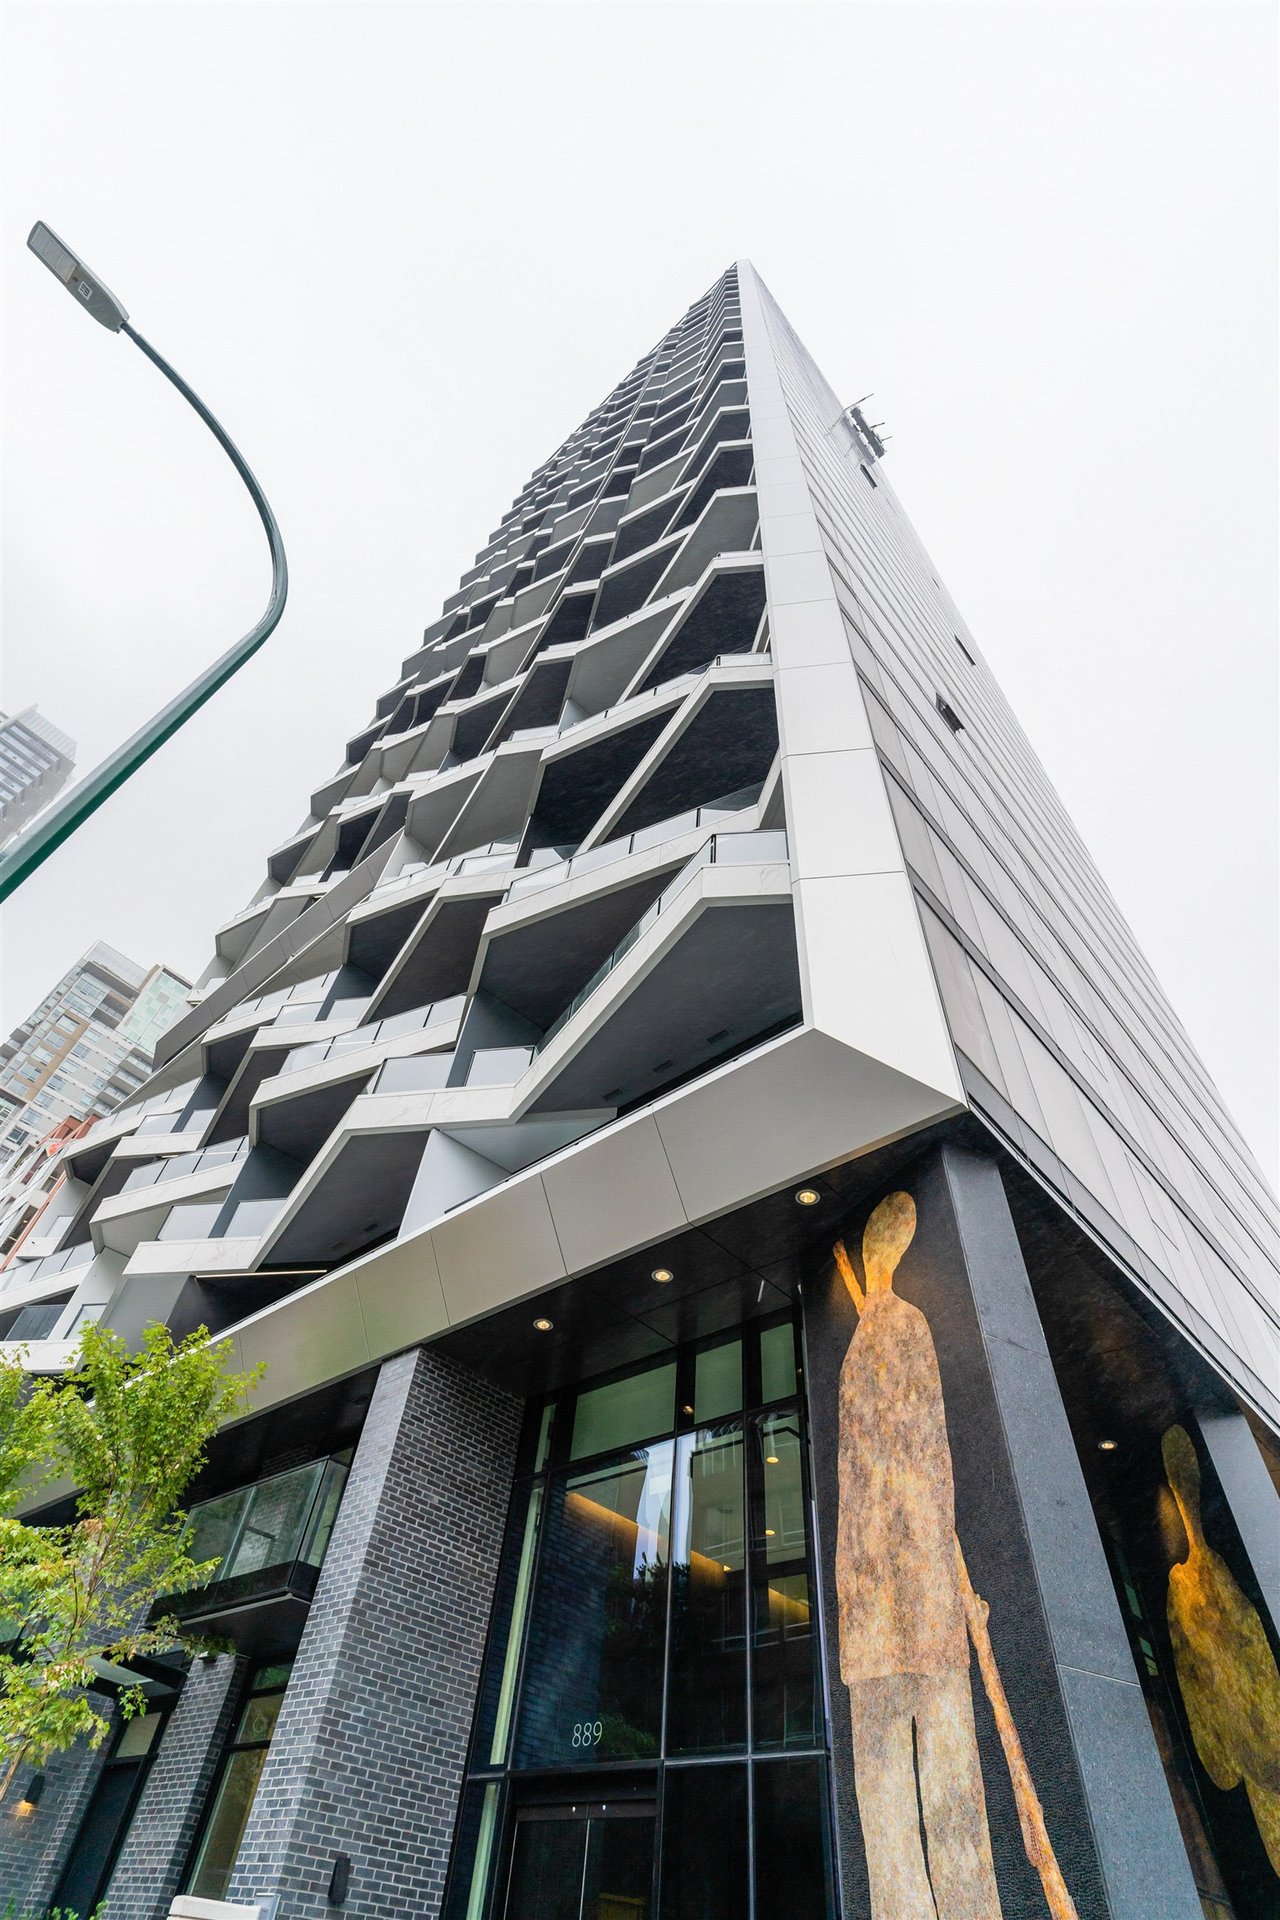
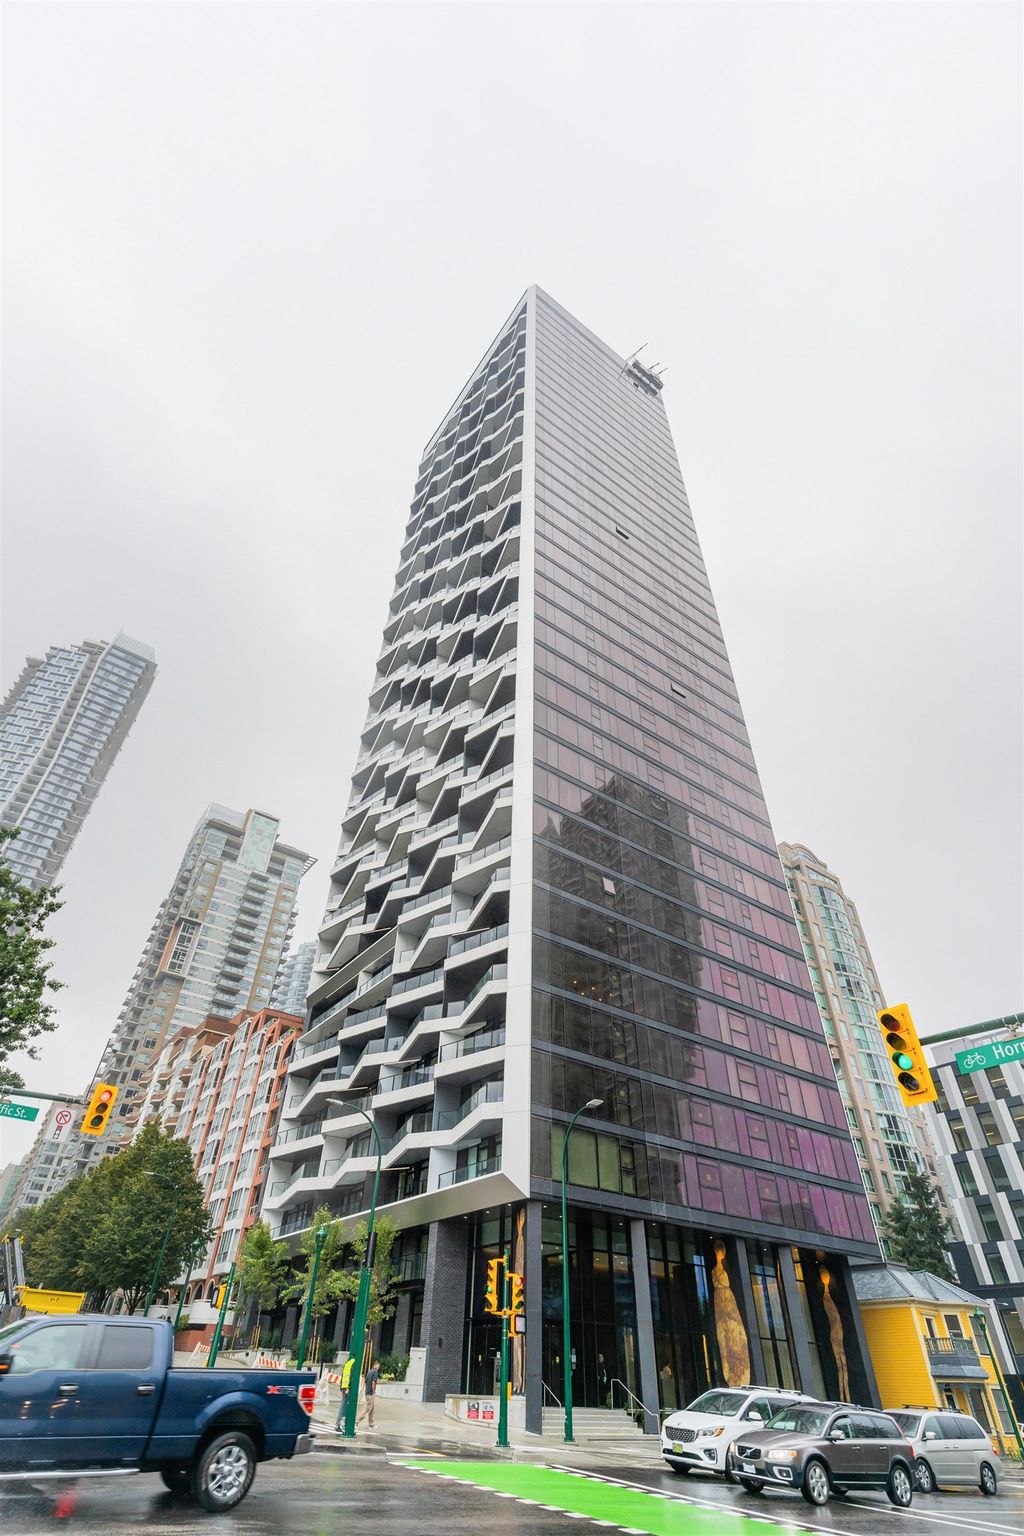
His leadership role at Grosvenor Americas is particularly noteworthy. Achieving 88% of unit sales at The Pacific by Grosvenor during the global pandemic shows not just his resilience but his ability to steer a team through unprecedented challenges. The fact that he’s also a resident and owner at The Pacific adds depth to his expertise, grounding his professional success in lived experience.
Phil has been a mentor to fellow Rennie Advisors, offering practical support to peers and shaping the future of the brokerage. His background in hospitality further enhances his services approach, as he brings an unmatched attention to detail and a personalized, client-first approach to real estate.
Clients consistently commend Phil for his professionalism and genuine commitment to helping them achieve their real estate goals. At the core of Phil’s values and strengths is his unwavering dedication to customer service, which sets him apart in the competitive world of real estate.
Whether you're looking to buy or sell, Phil's experience, market insight, and client-focused approach make him an invaluable partner on your real estate journey.
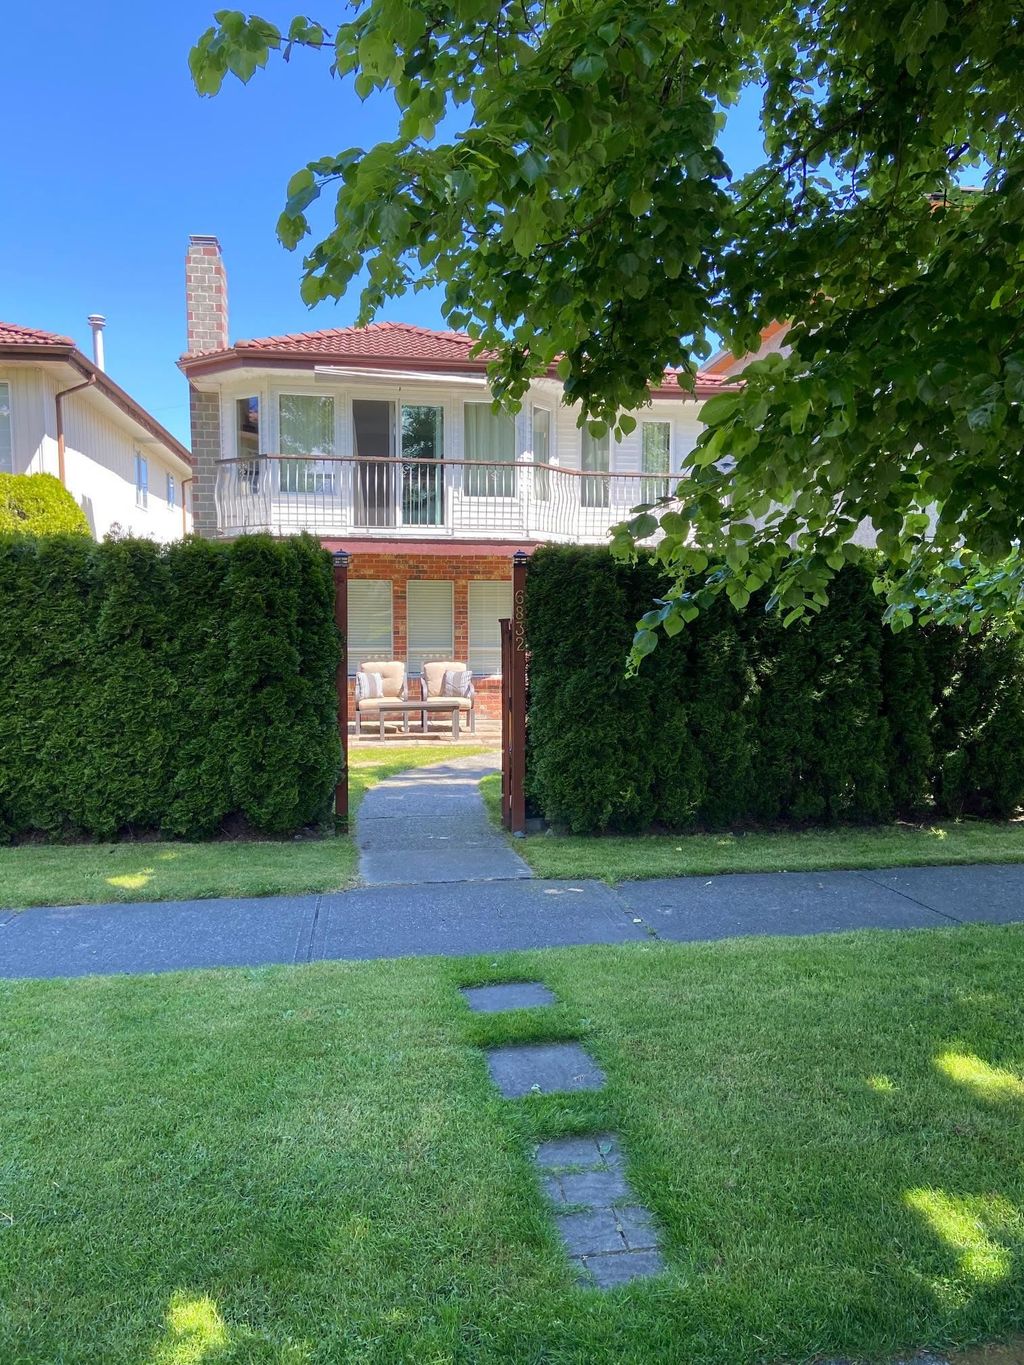
Courtesy of Rennie & Associates Realty Ltd.
Courtesy of Rennie & Associates Realty Ltd.


Estimate your monthly mortgage payment, including the principal and interest, property taxes, and Maintenance/HOA Dues. Adjust the values to generate a more accurate rate.
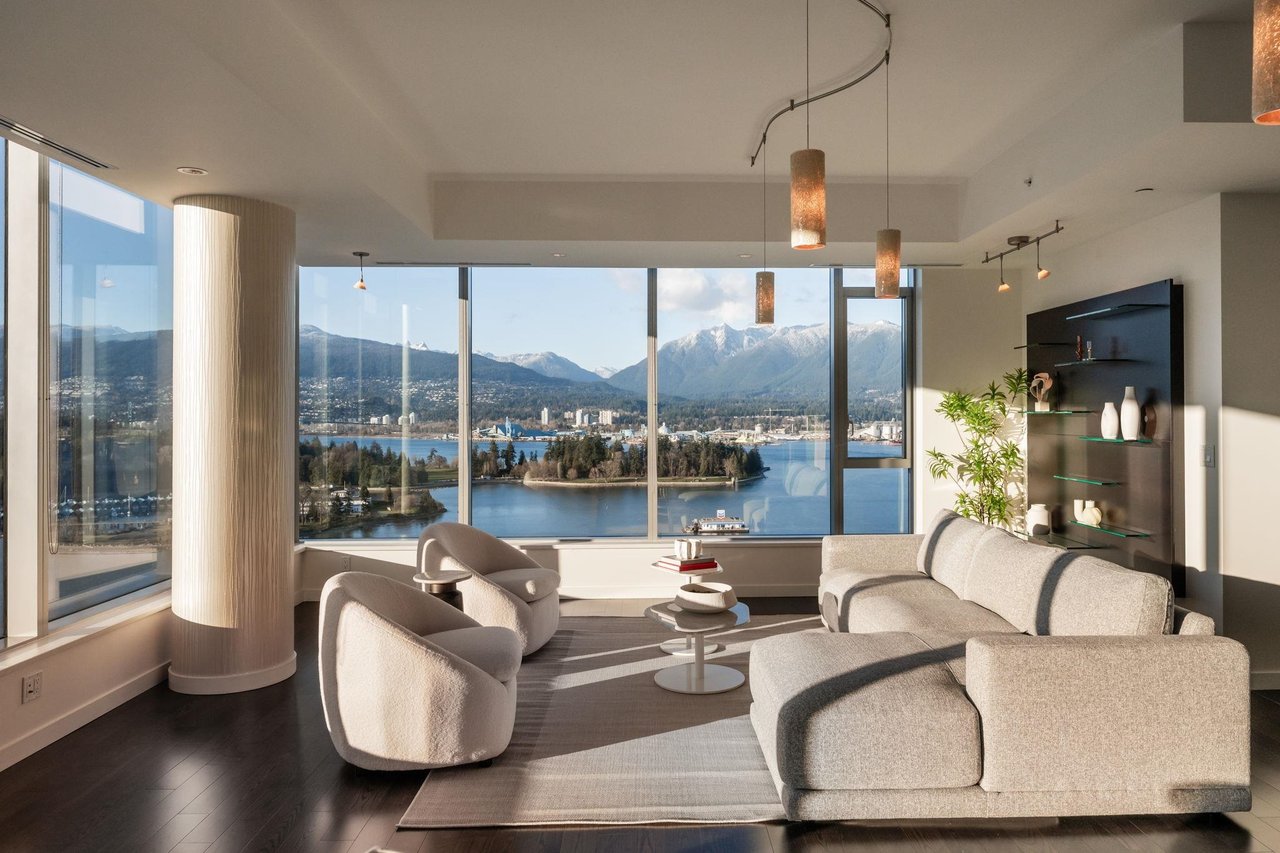
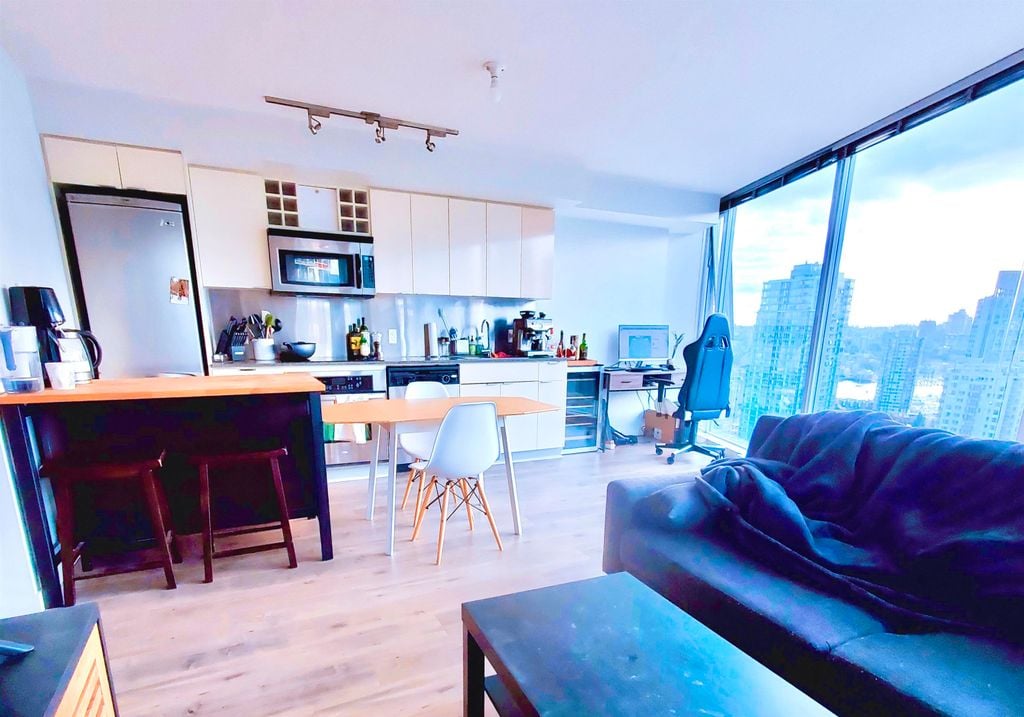
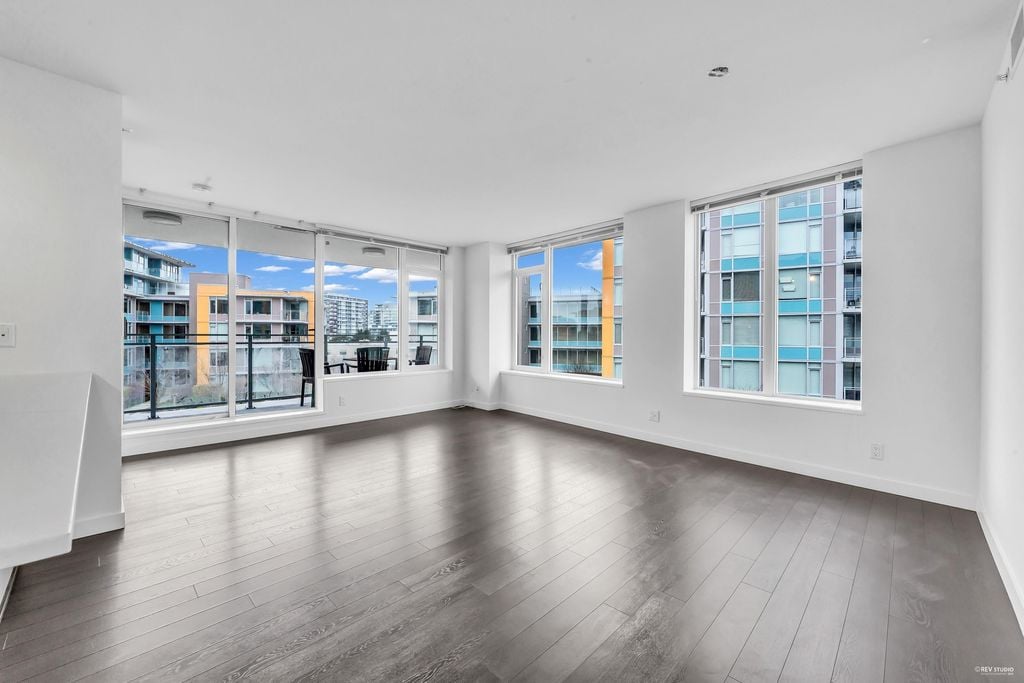
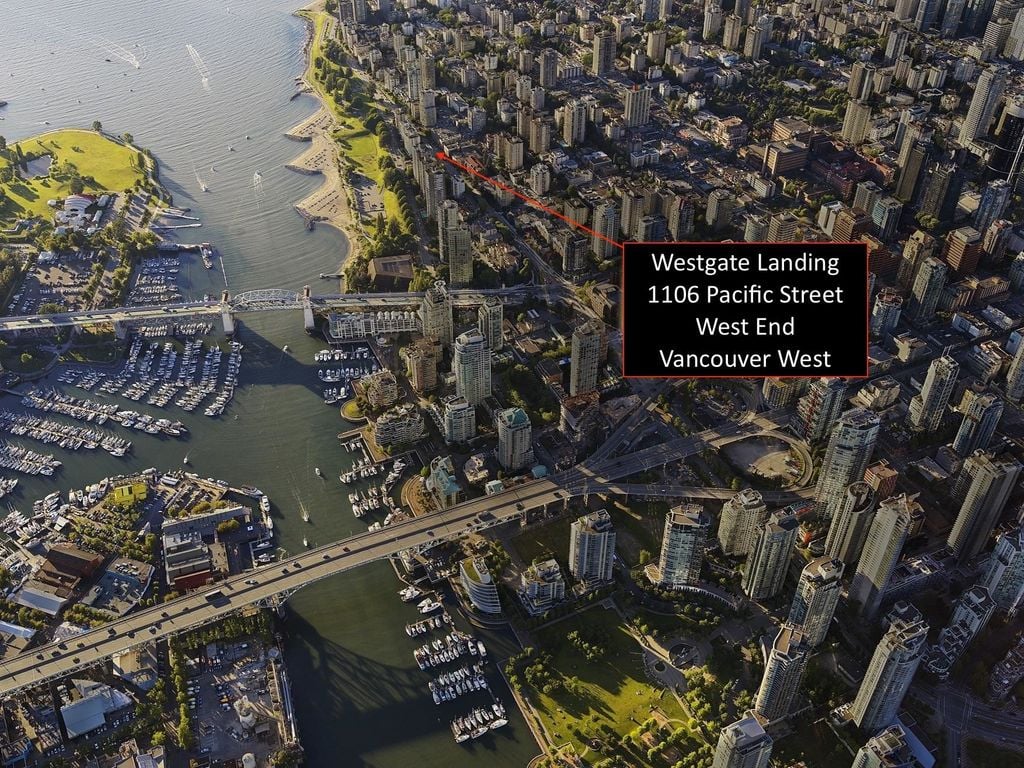
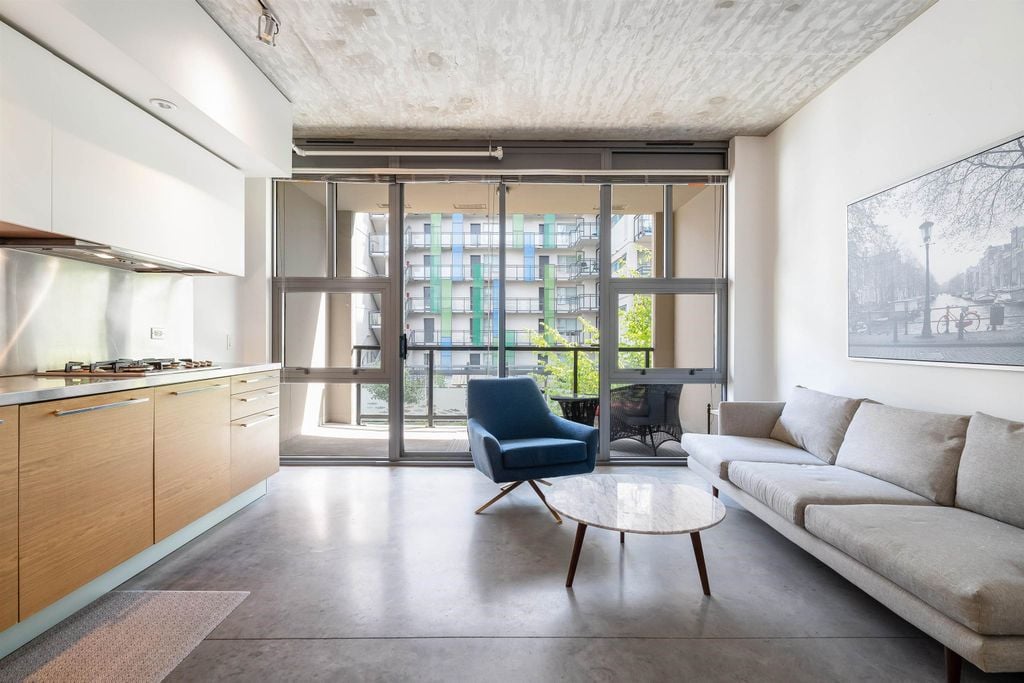
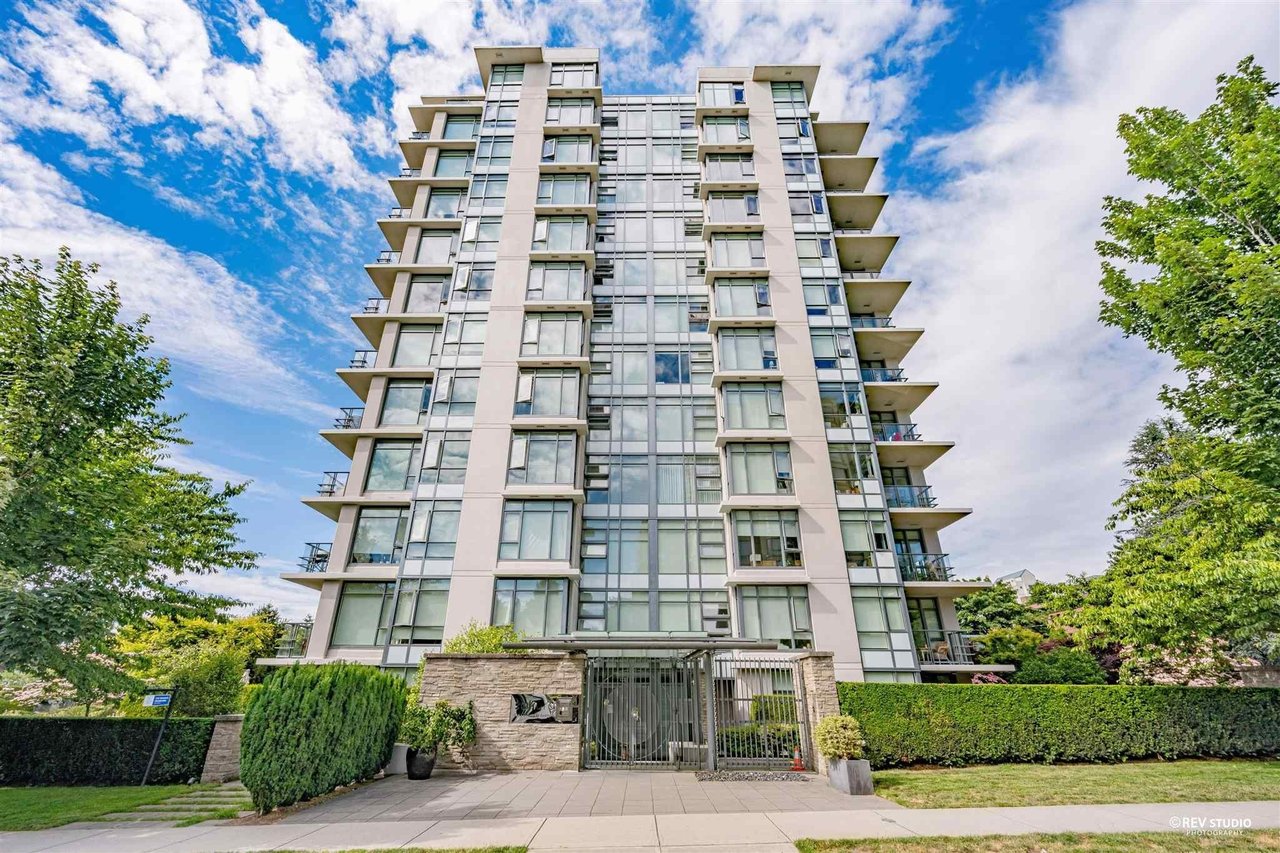
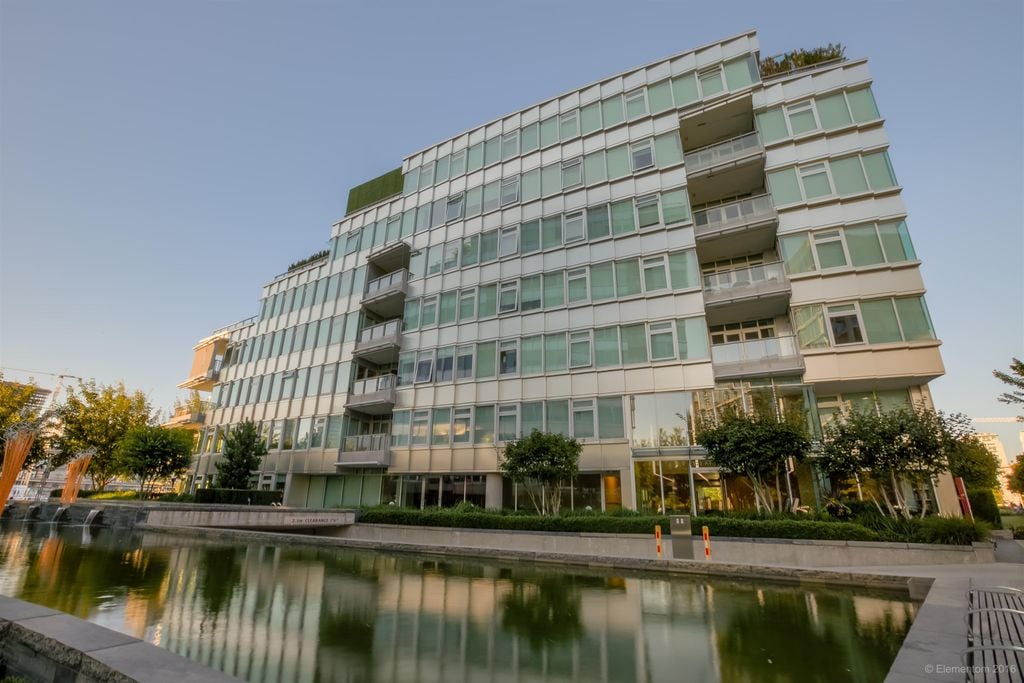
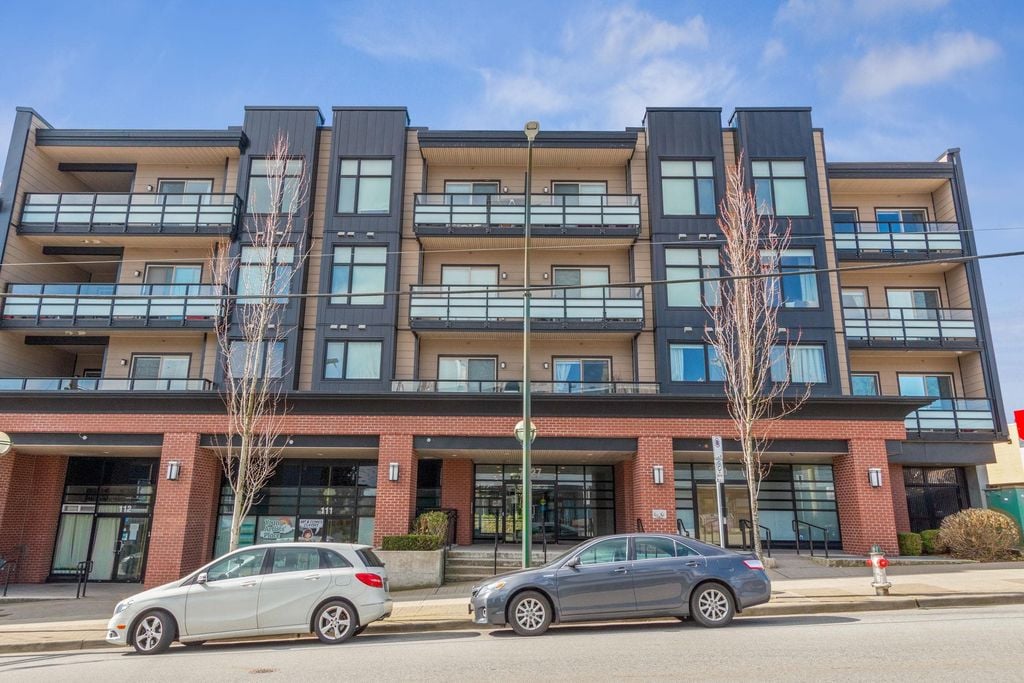
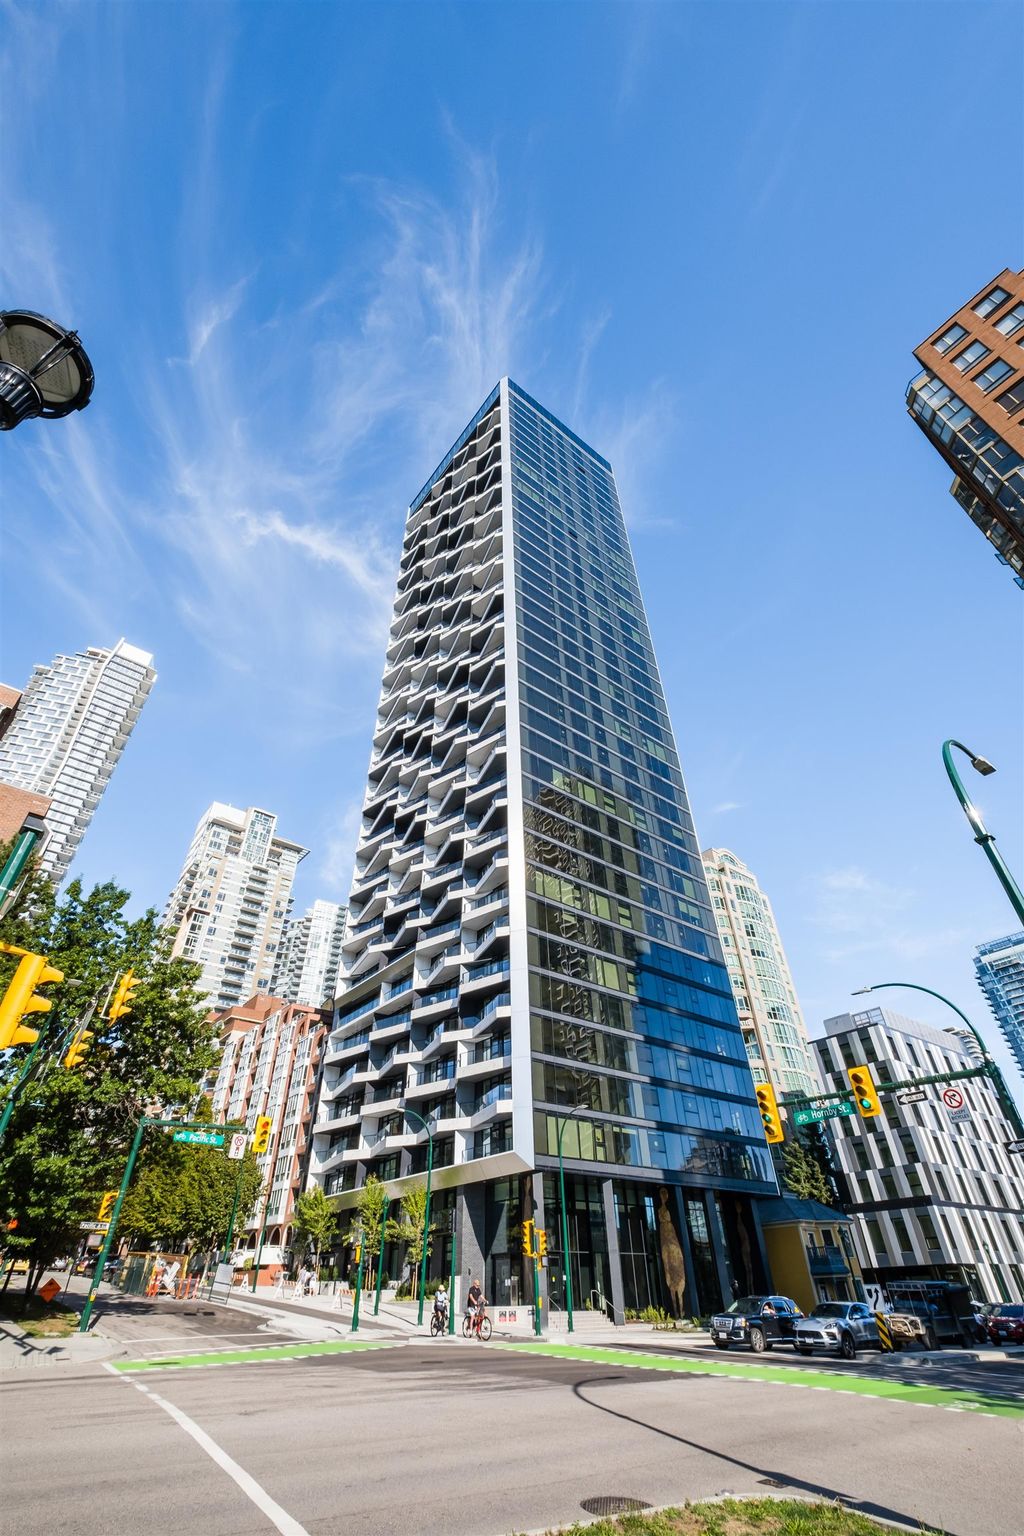
1207 889 PACIFIC STREET, Vancouver, BC V6Z 1C3, CA
Courtesy of Rennie & Associates Realty Ltd.
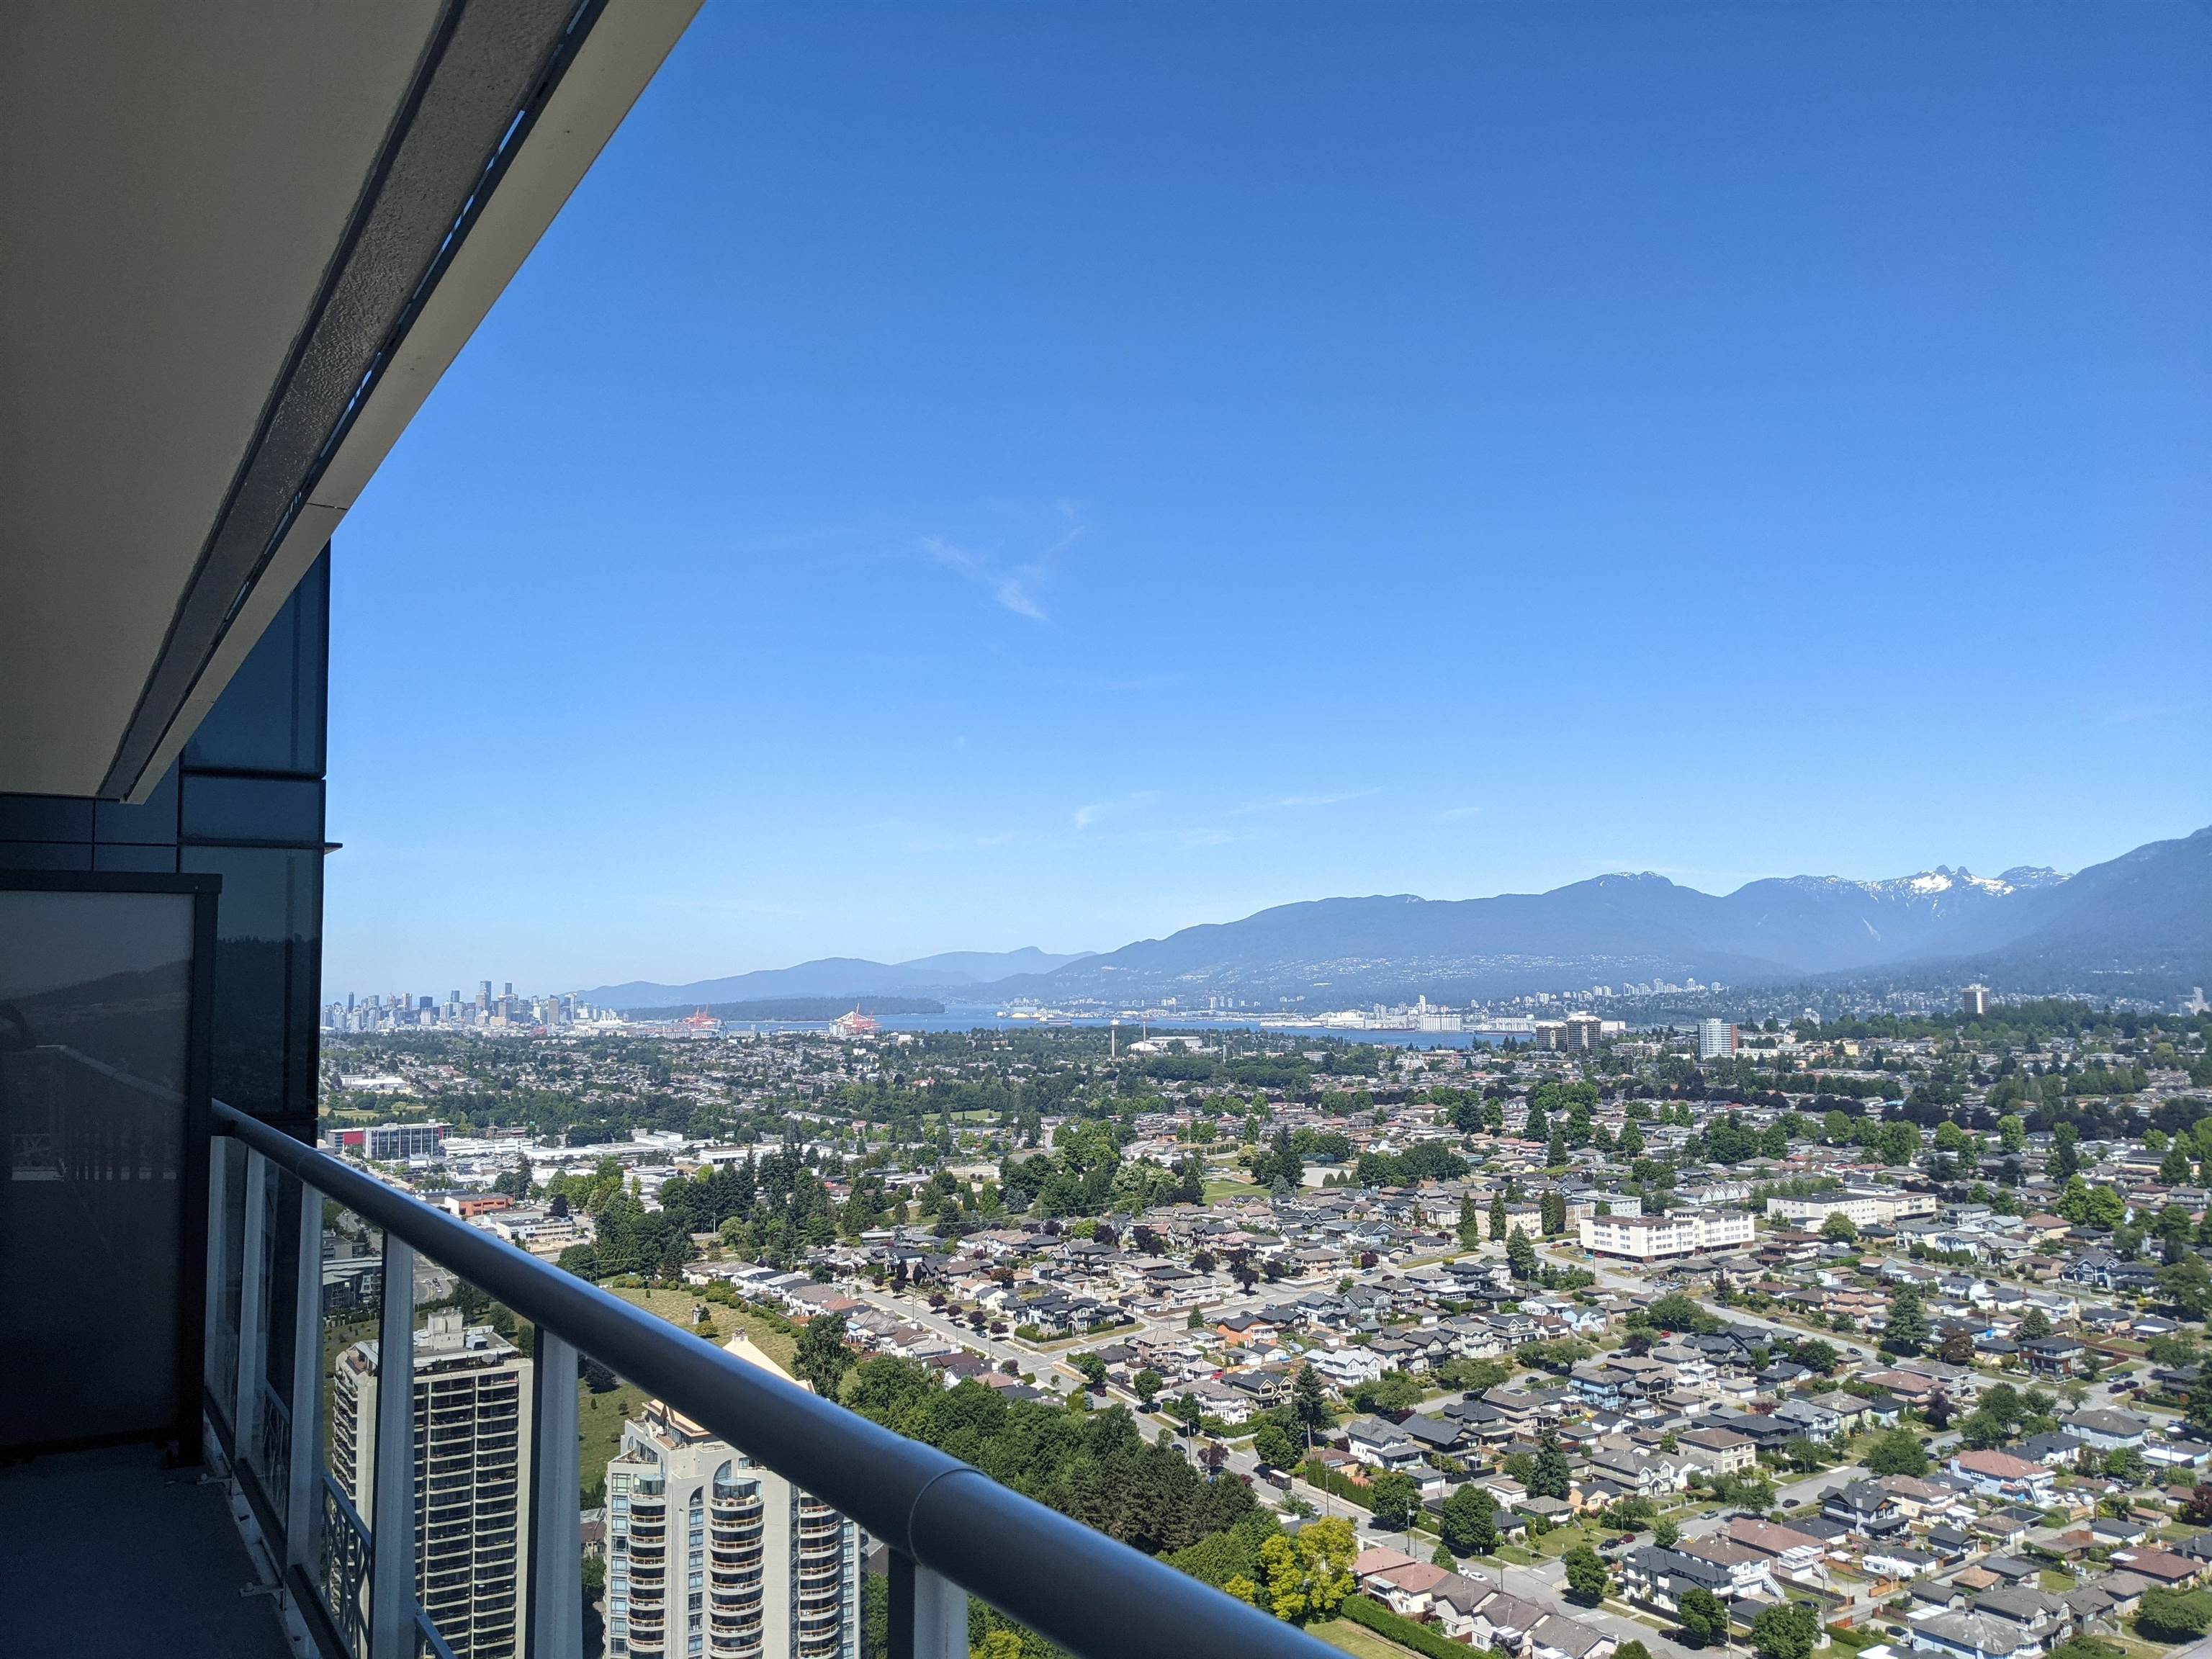
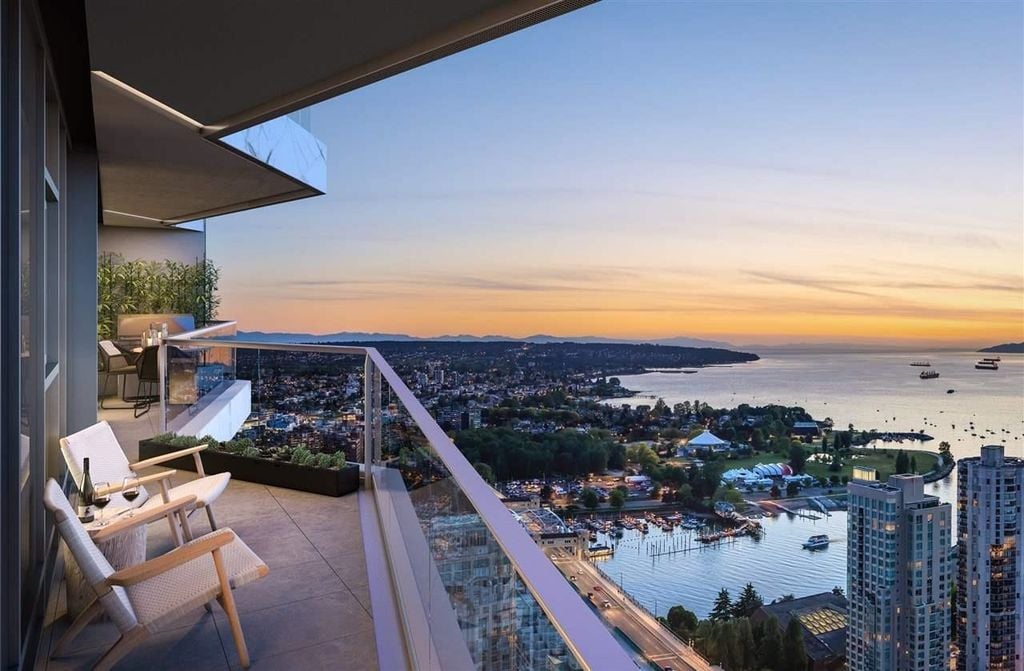
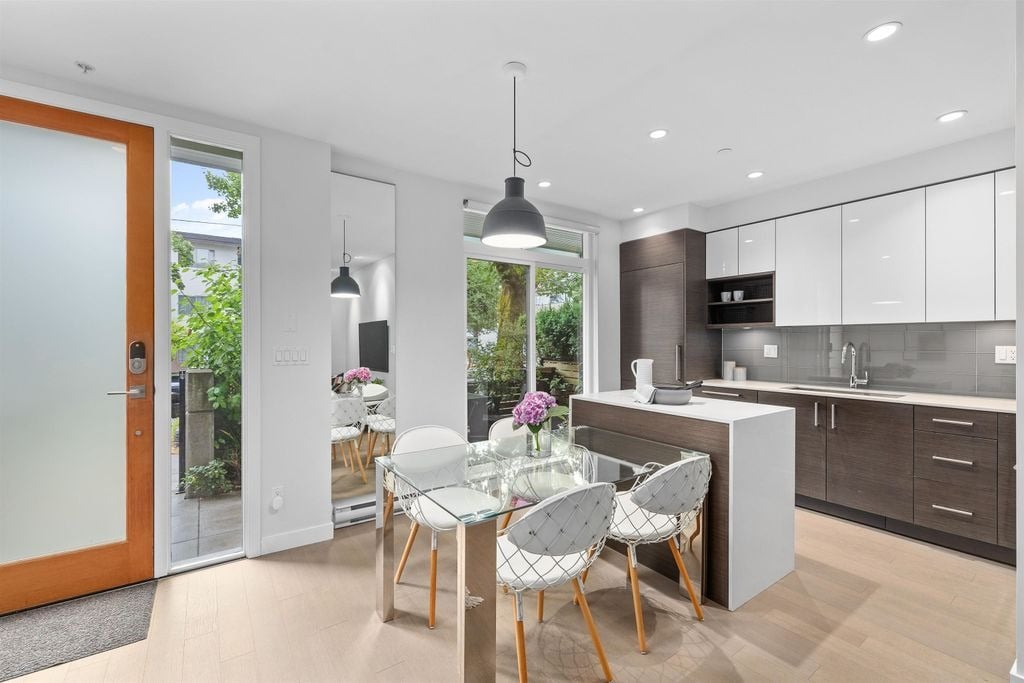
Property description
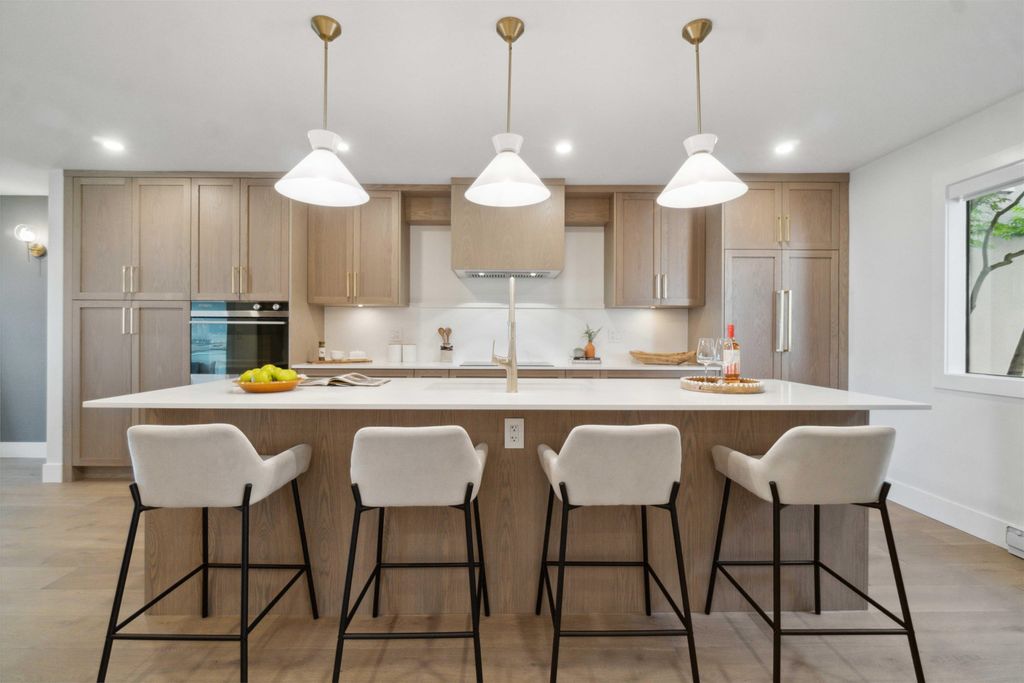
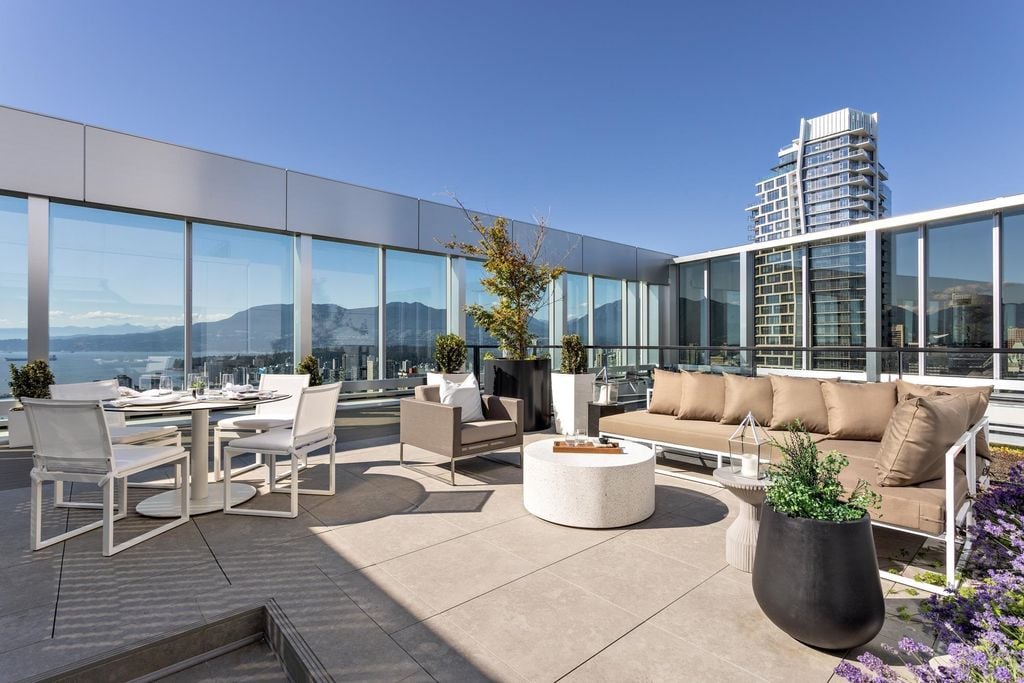
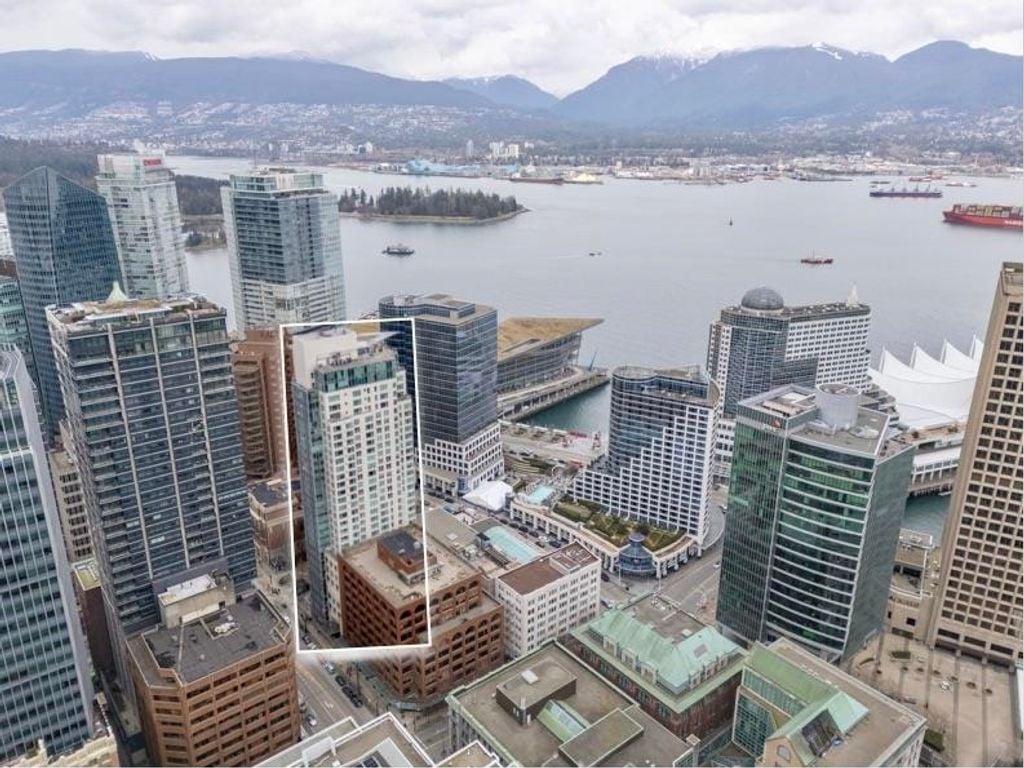
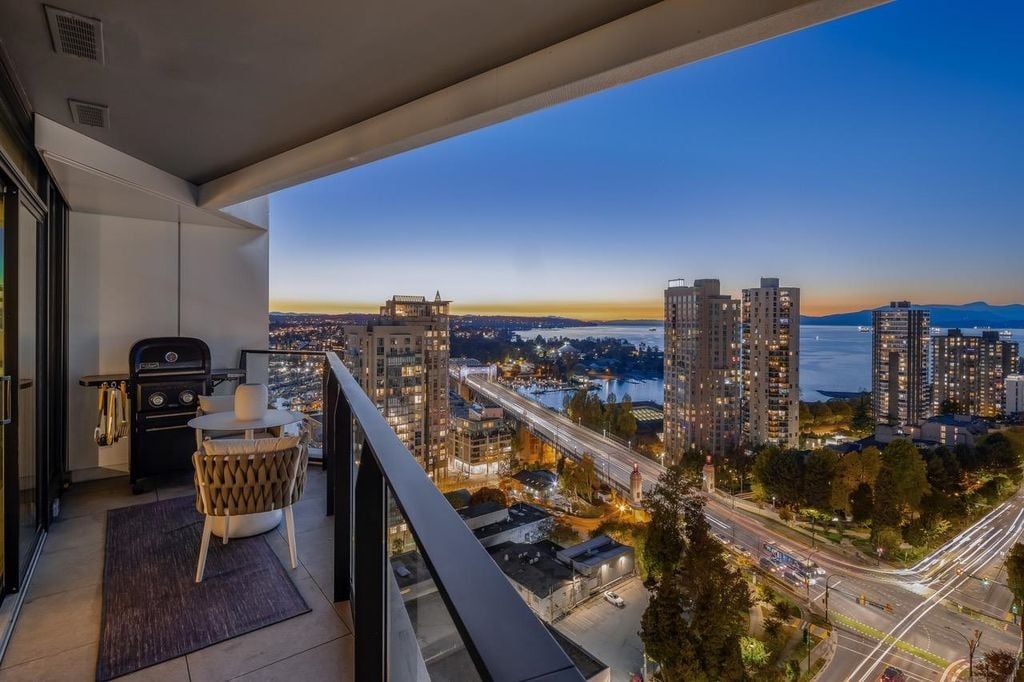
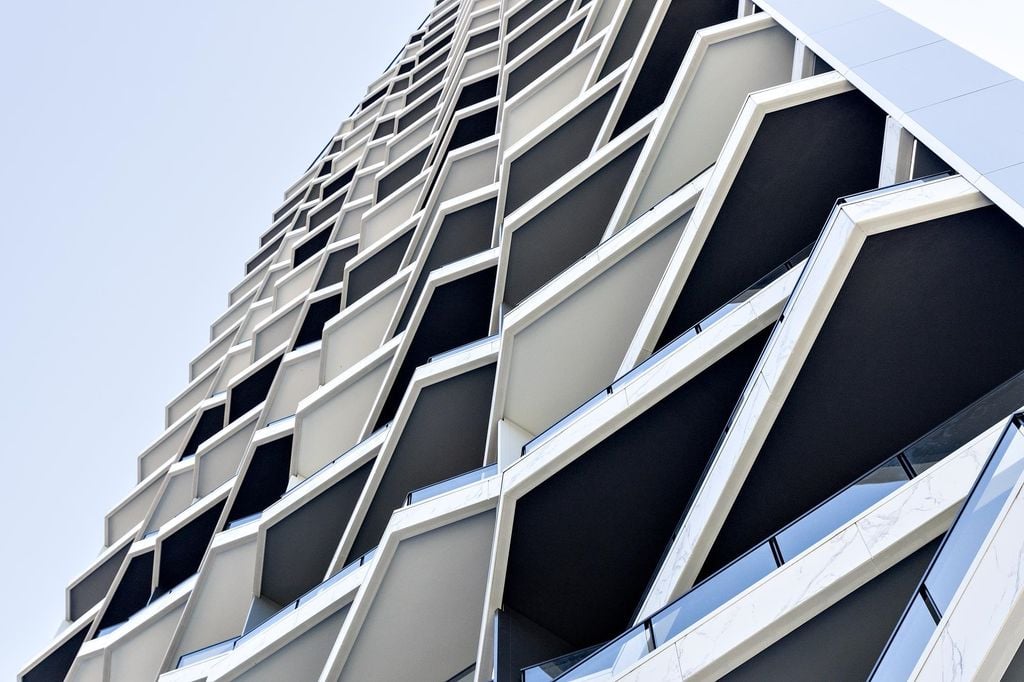
Welcome to THE PACIFIC BY GROSVENOR, world-renowned for quality & timeless elegance! Crafted with great attention todetail, this pristine 820 SF, 2-bed, 2-bath NE corner home offers quiet sophistic...
Courtesy of Rennie & Associates Realty Ltd.
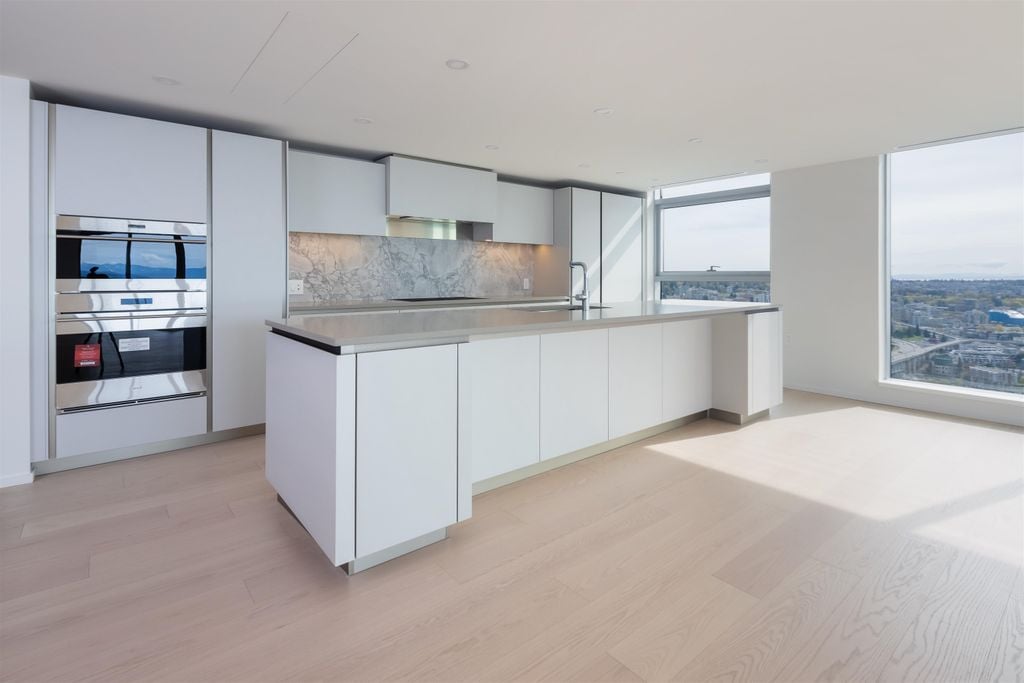
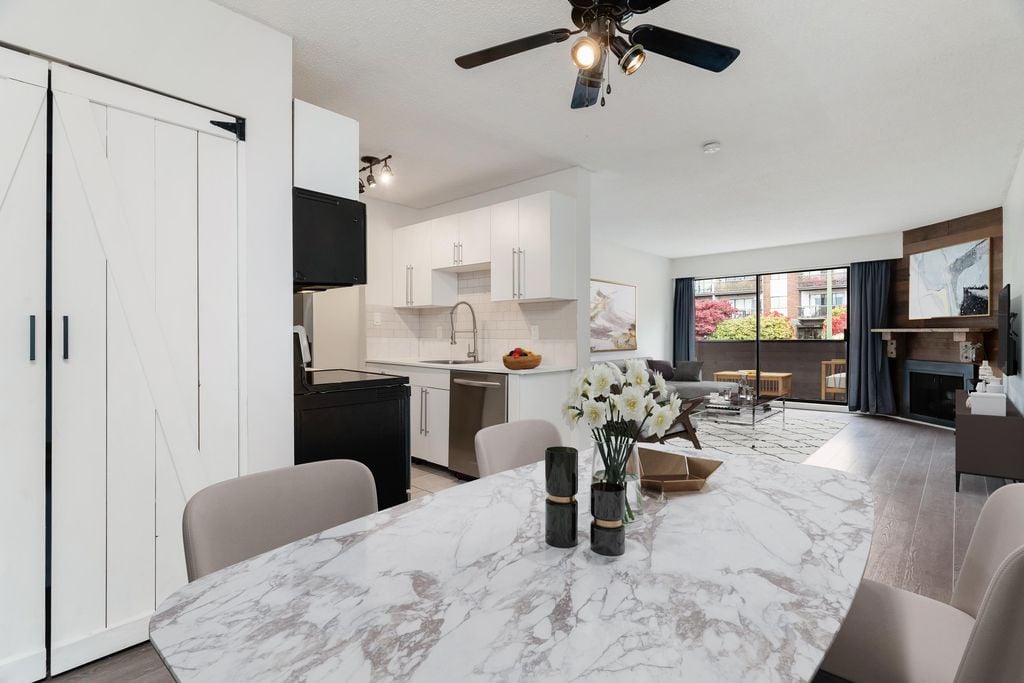
4312 4510 HALIFAX WAY, Burnaby, BC V5C 0K4, CA
Courtesy of Rennie & Associates Realty Ltd.
Property description
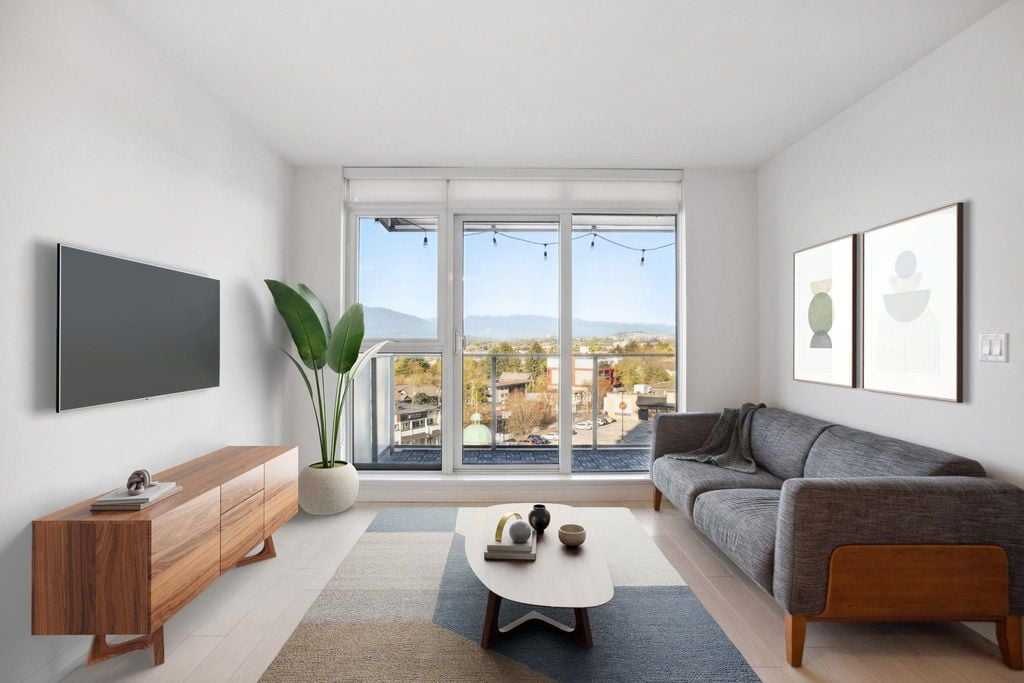
Welcome to Burnaby North-Living at THE AMAZING BRENTWOOD TOWER 1! This high floor, highly desirable, 733 sq ft north-facing 2-bed, 2-bath home features an efficient and bright open-concept layout w...
Courtesy of Rennie & Associates Realty Ltd.
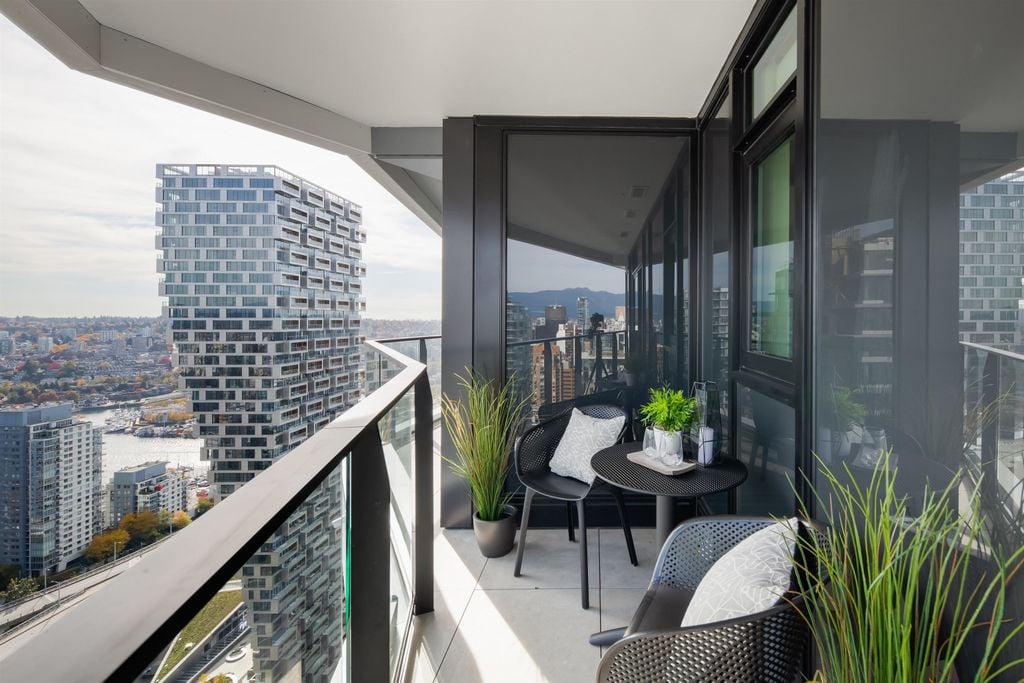
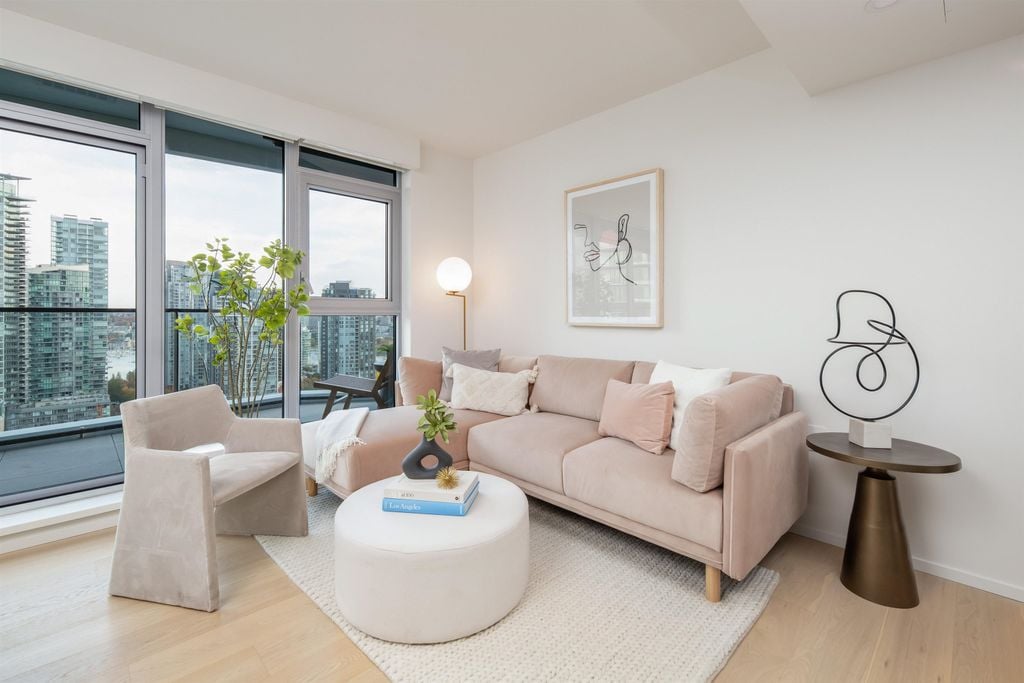
889 Pacific Street, Unit 2001, Vancouver, BC V6Z 1C3, Canada
Property description
THE PACIFIC by GROSVENOR! A Timeless design, World Class views, elegant home at Pacific & Hornby in Downtown Vancouver. This well appointed 1 Bedroom, 1 Full Bath offers open concept living. Interi...
889 Pacific Street, Unit 2404, Vancouver, BC V6Z 1C3, Canada
Property description
THE PACIFIC by GROSVENOR! A Timeless design, World Class views, elegant home at Pacific & Homby in Downtown Vancouver. This well appointed 637 sq.ft.,1 Bedroom, 1 Full Bath and flex offers open con...
889 Pacific Street, Unit 403, Vancouver, BC V6Z 1C3, Canada
Property description
THE PACIFIC by GROSVENOR! A Timeless design, World Class views, elegant home at Pacific & Hornby in Downtown Vancouver. This well appointed 2 Bed, 2 Full Bath & flex offers open concept living. 1 p...
889 Pacific Street, Unit 706, Vancouver, BC V6Z 1C3, Canada
Property description
THE PACIFIC by GROSVENOR! A Timeless design, World Class views, elegant home at Pacific & Hornby in Downtown Vancouver. This well appointed 2 Bed, 2 Full Bath offers open concept living. 1 parking ...
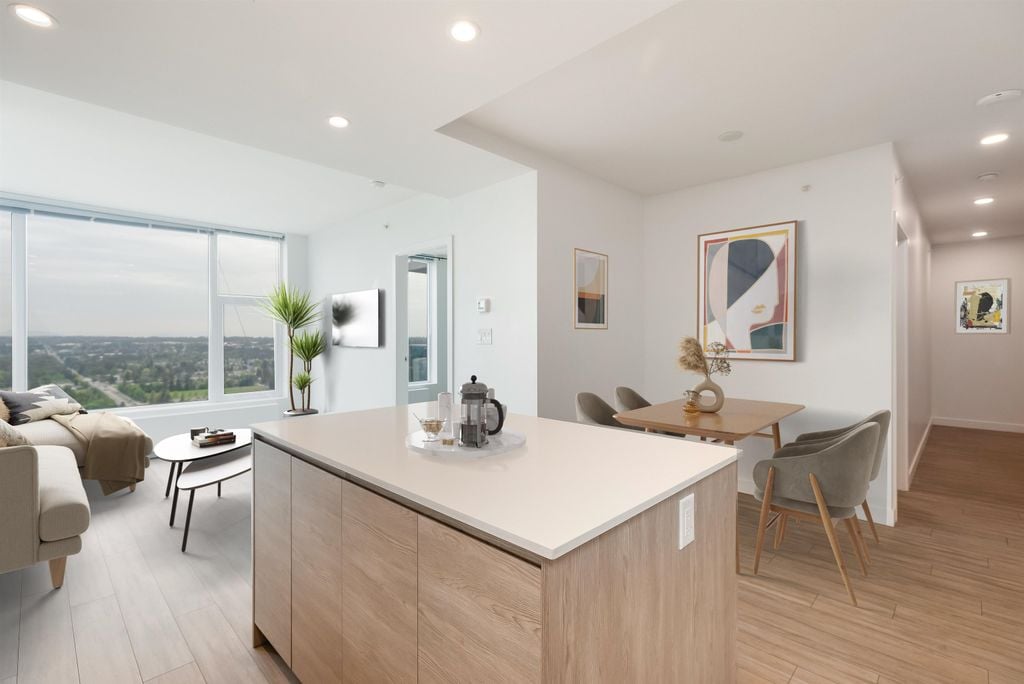
1288 West Georgia Street, Unit 3405, Vancouver, BC V6E 4R3, Canada
Property description
Welcome to RESIDENCES ON GEORGIA, located in the heart of Downtown Vancouver, steps to the financial, shopping, restaurants, entertainment districts & Stanley Park. This beautifully-kept southeast ...
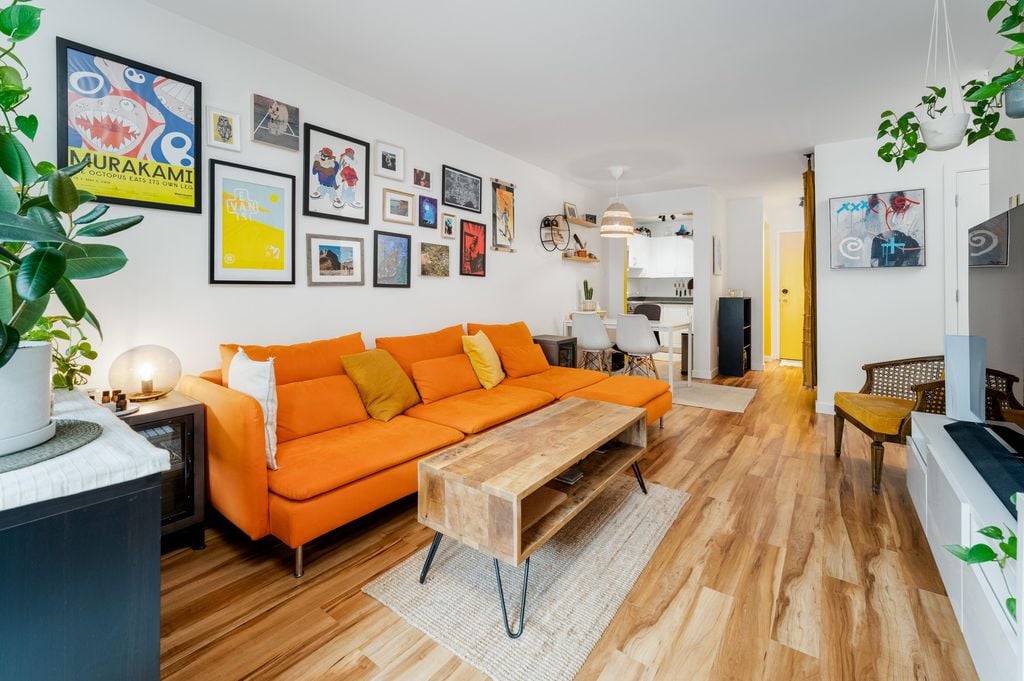
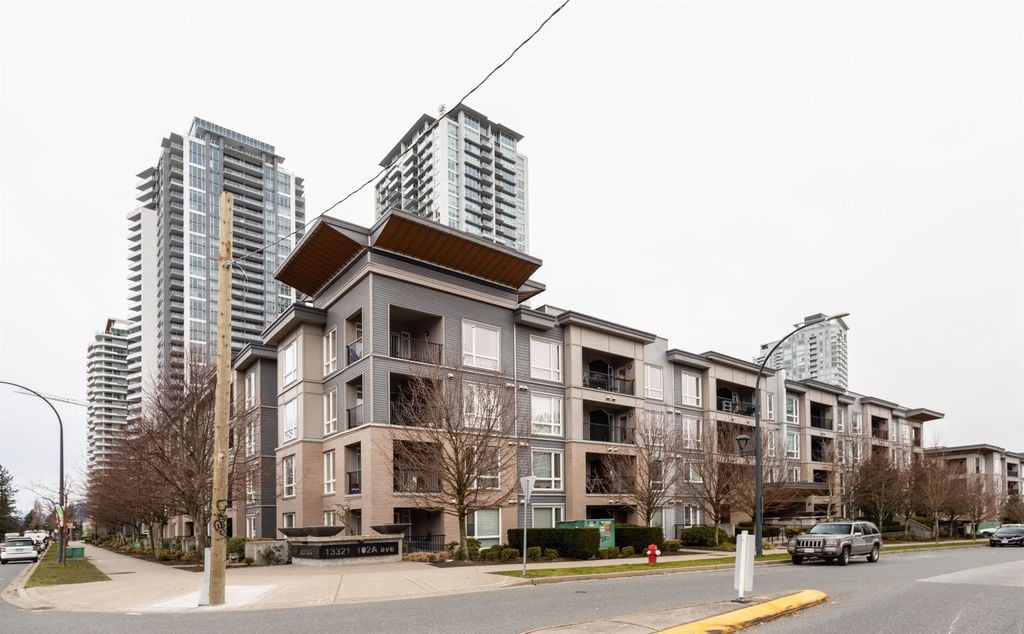
13321 102a Avenue, Unit 308, Surrey, BC V3T 1P6, Canada
Property description
AGENDA in Urban Village developed by reputable Weststone Group is Centrally-located in the heart of Whalley. This wellmaintained One Bedroom is an excellent open floor plan layout featuring vaulted...
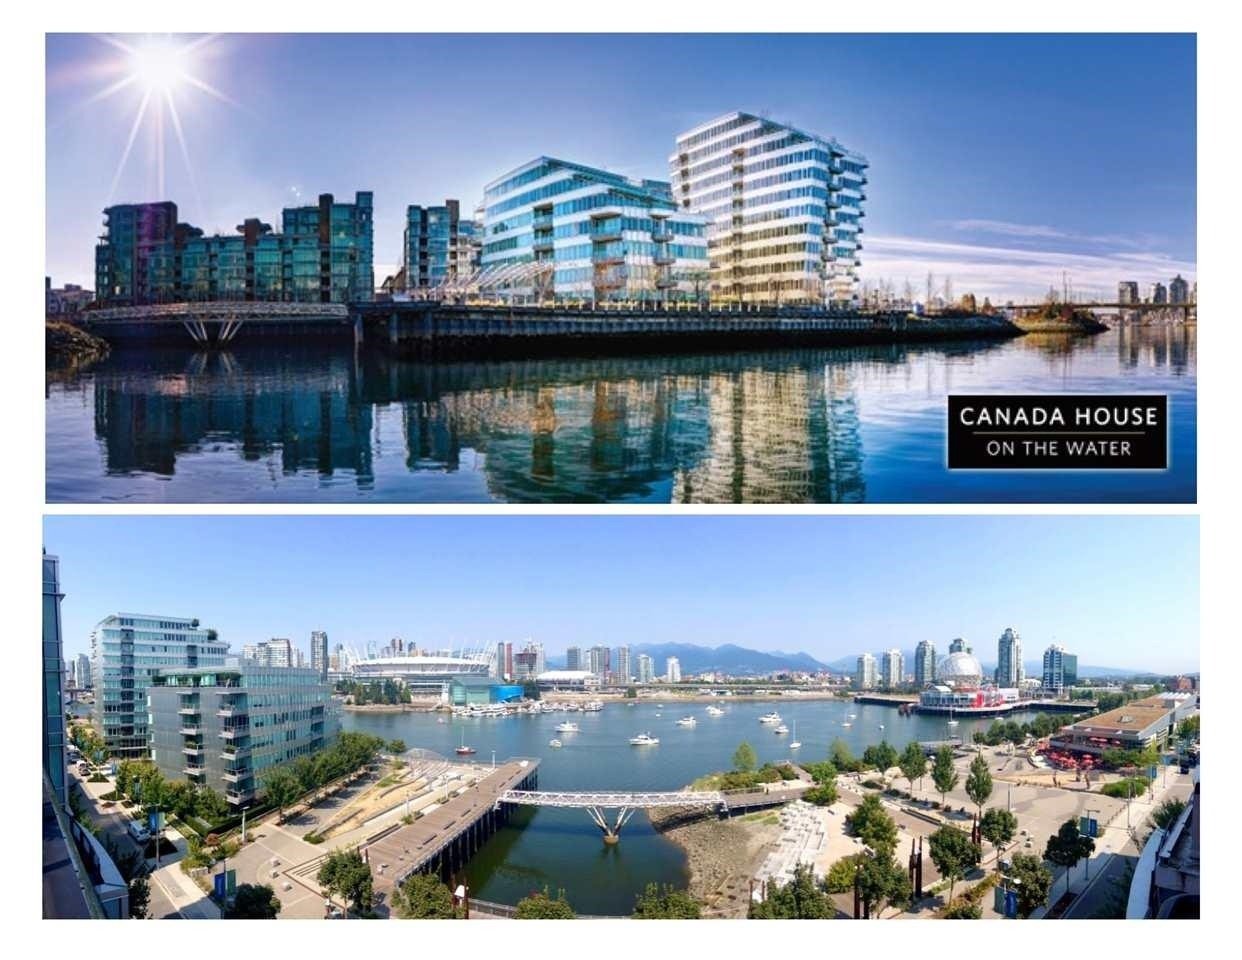
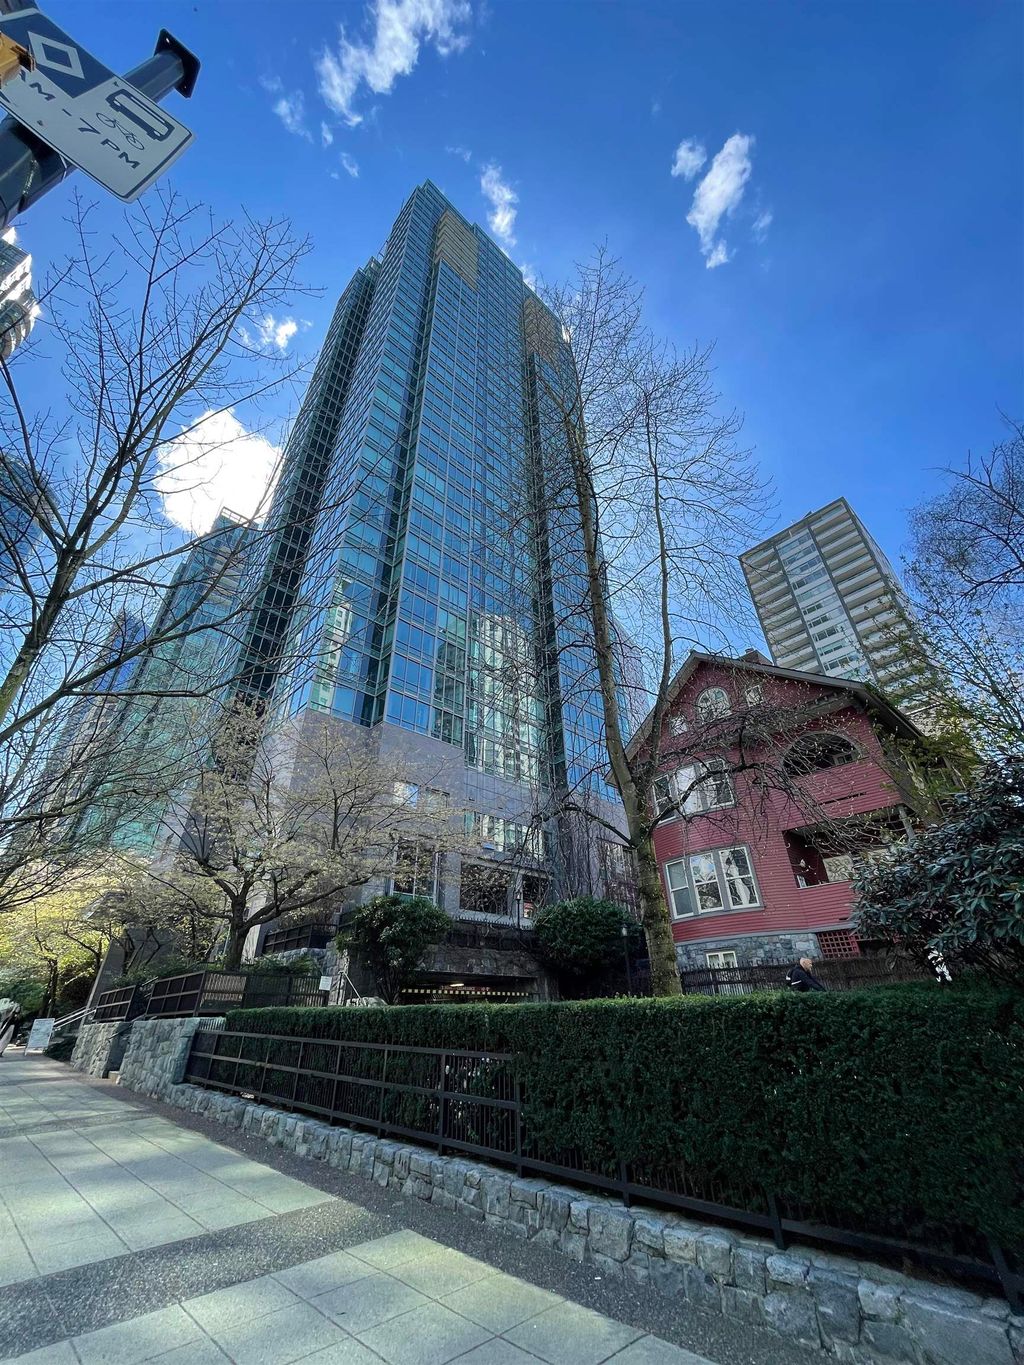
151 Athletes Way, Unit 402, Vancouver, BC V5Y 0E5, Canada
Property description
CANADA HOUSE ON THE WATER, represents the gold standard in The Olympic Village - an Arthur Erickson-designed gem. This spacious 1,630 sq ft 2-BR + Den + 3 Bathroom home is in False Creek’s coveted ...
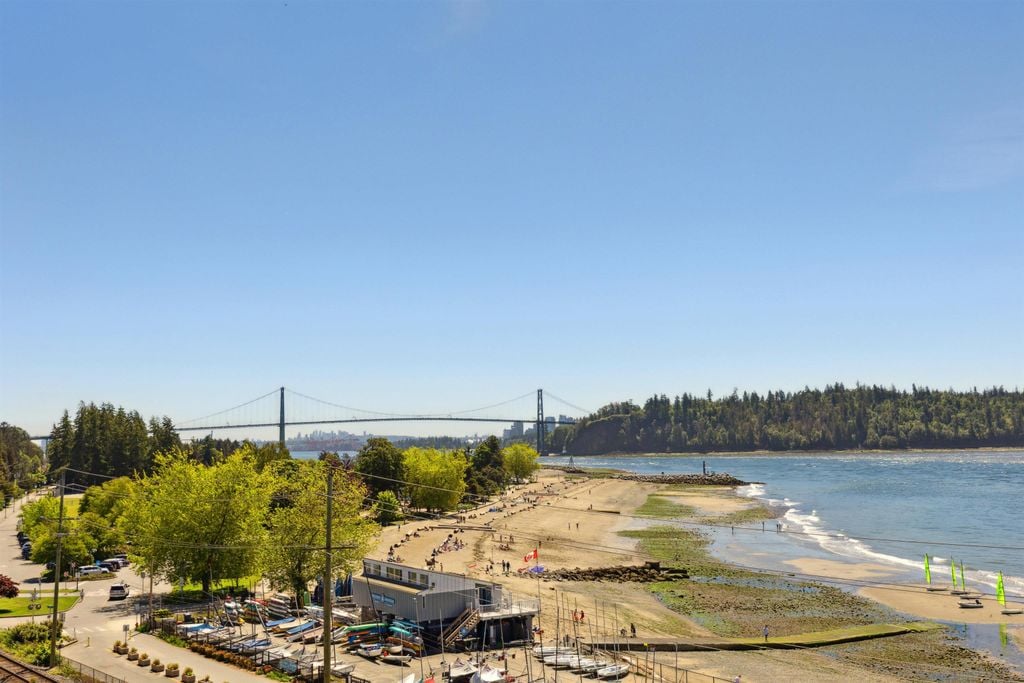
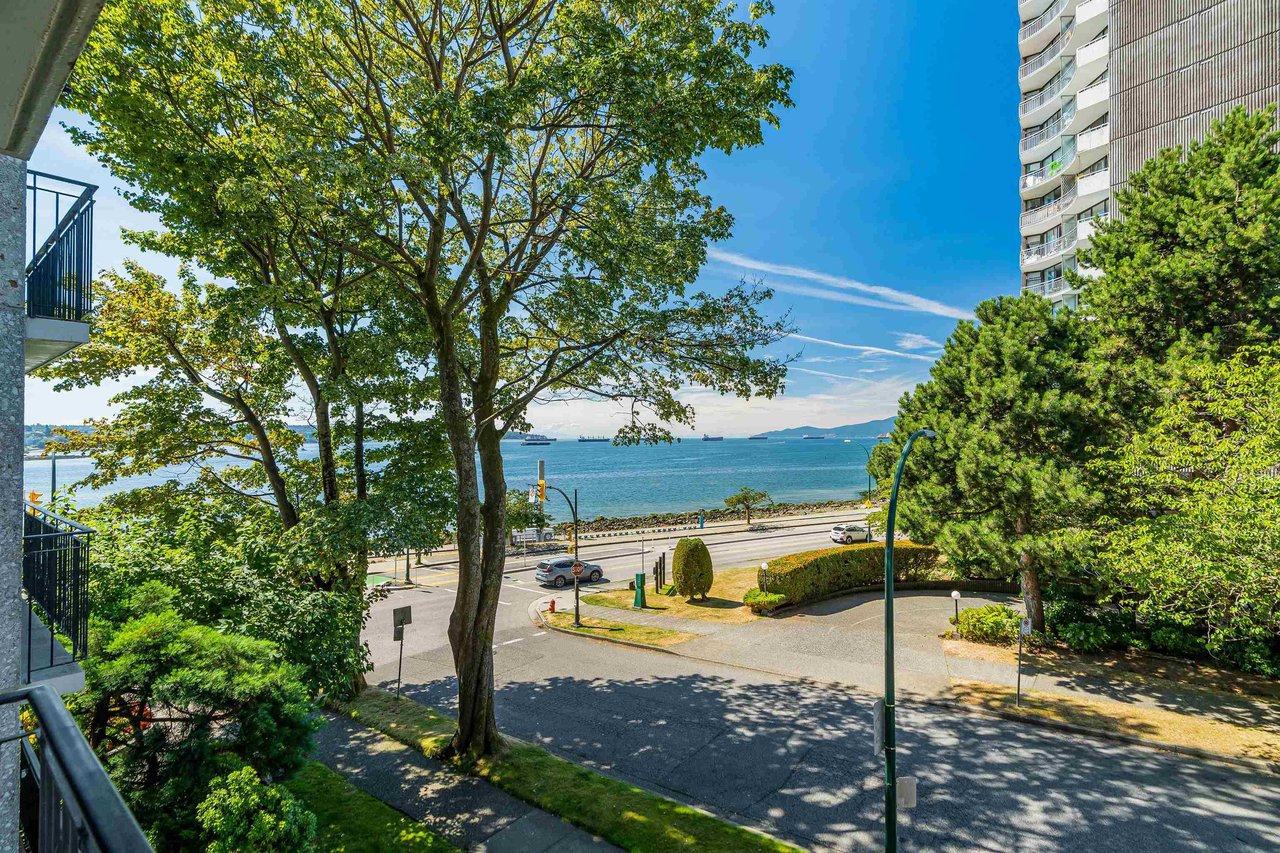
1525 Bellevue Avenue, Unit 104, West Vancouver, BC V7V 1A6, Canada
Property description
A truly extraordinary 2 level executive style penthouse on the golden mile of Ambleside. Building rebuilt/rain screened in 2015 and unit completely renovated in 2020 to the highest standard, includ...
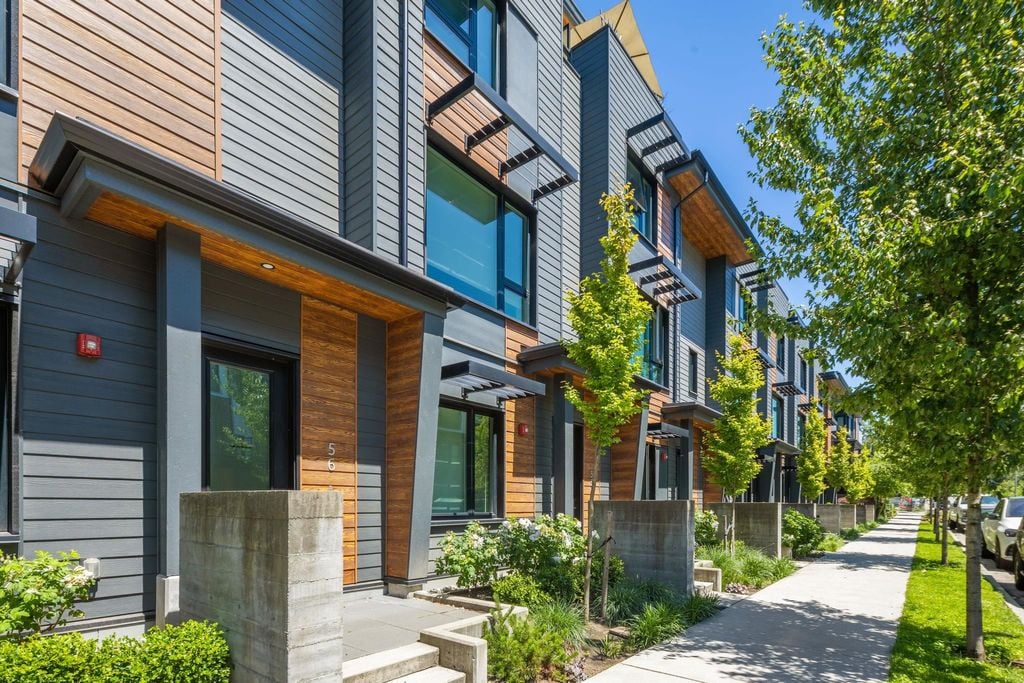
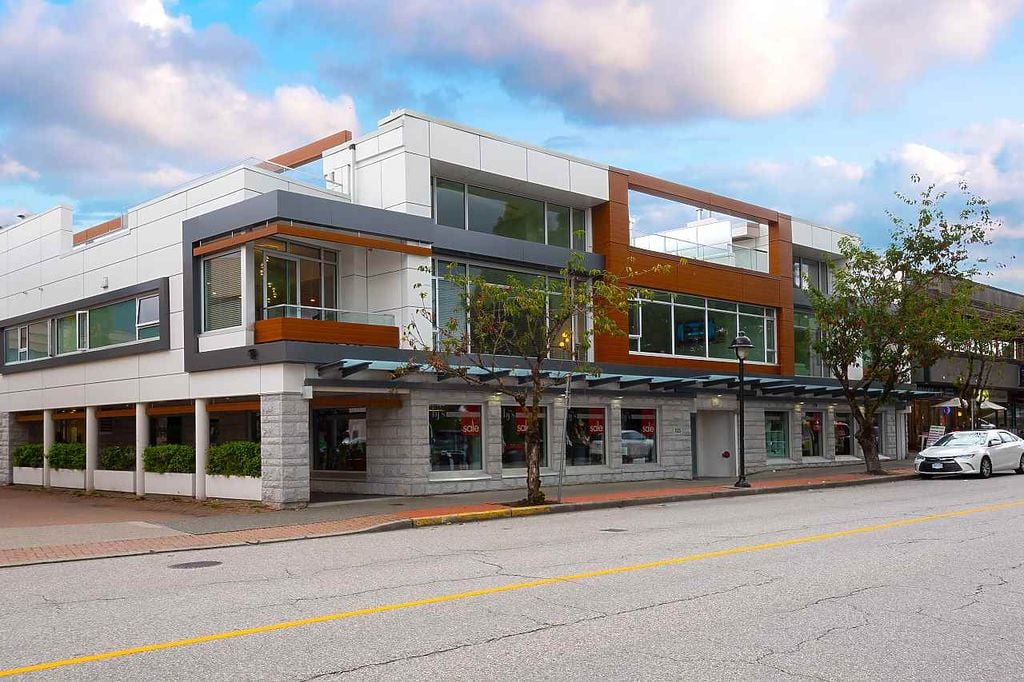
341 West 3rd Street, Unit 203, North Vancouver, BC V7M 1G3, Canada
Property description
Welcome to Lisa Place near the heart of charming LoLo! This oversized 778 SF 1 bedroom, 1 full bath home enjoys North Shore living at its doorstep - ideally located near Lonsdale Quay, the Seabus, ...