Benchmark Prices - December 2022
Dec 06, 2022
Written by
Ryan BerlinSHARE THIS
Here are the latest Benchmark Price Infographics for the areas of the Vancouver Region.Greater Vancouver Board Area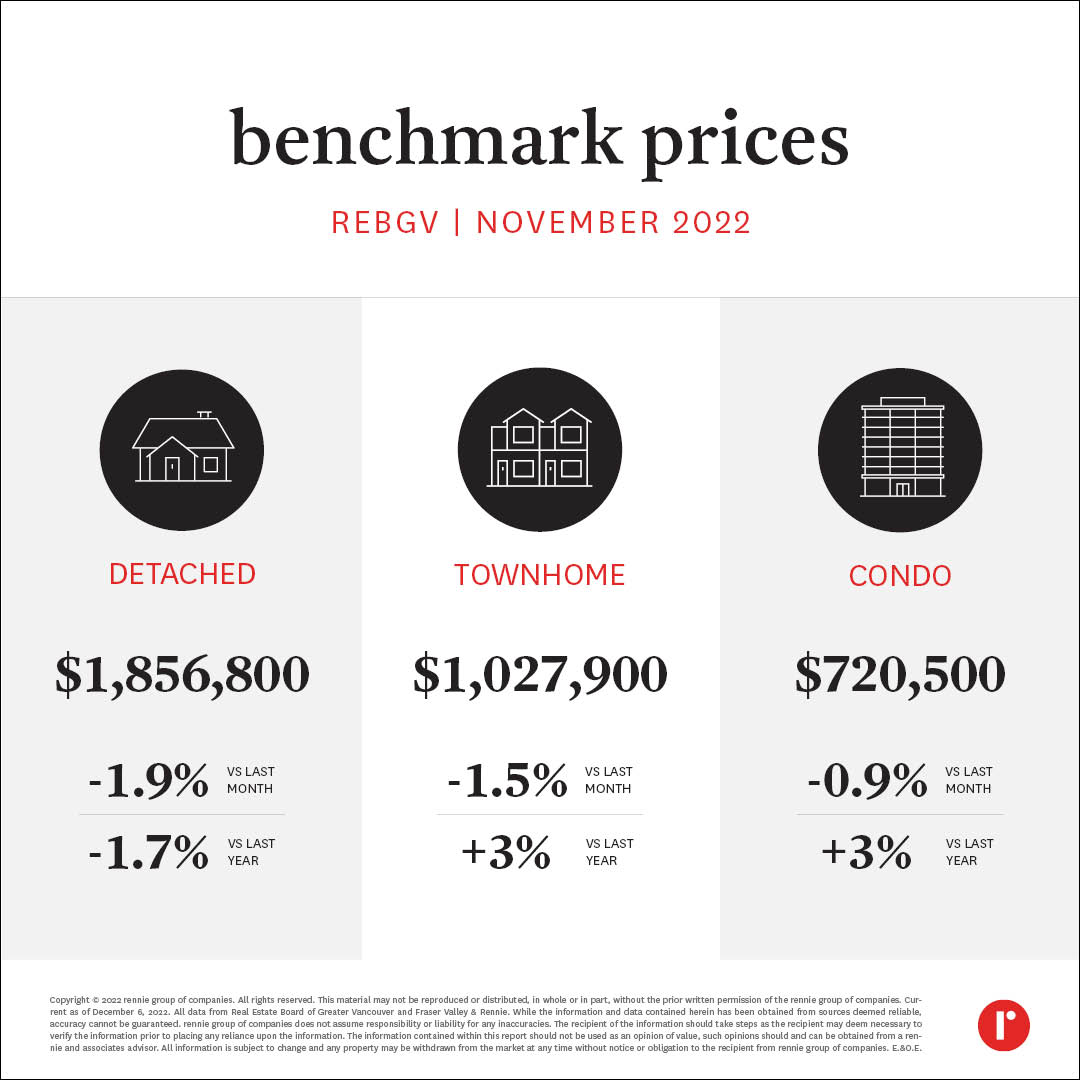 Burnaby East
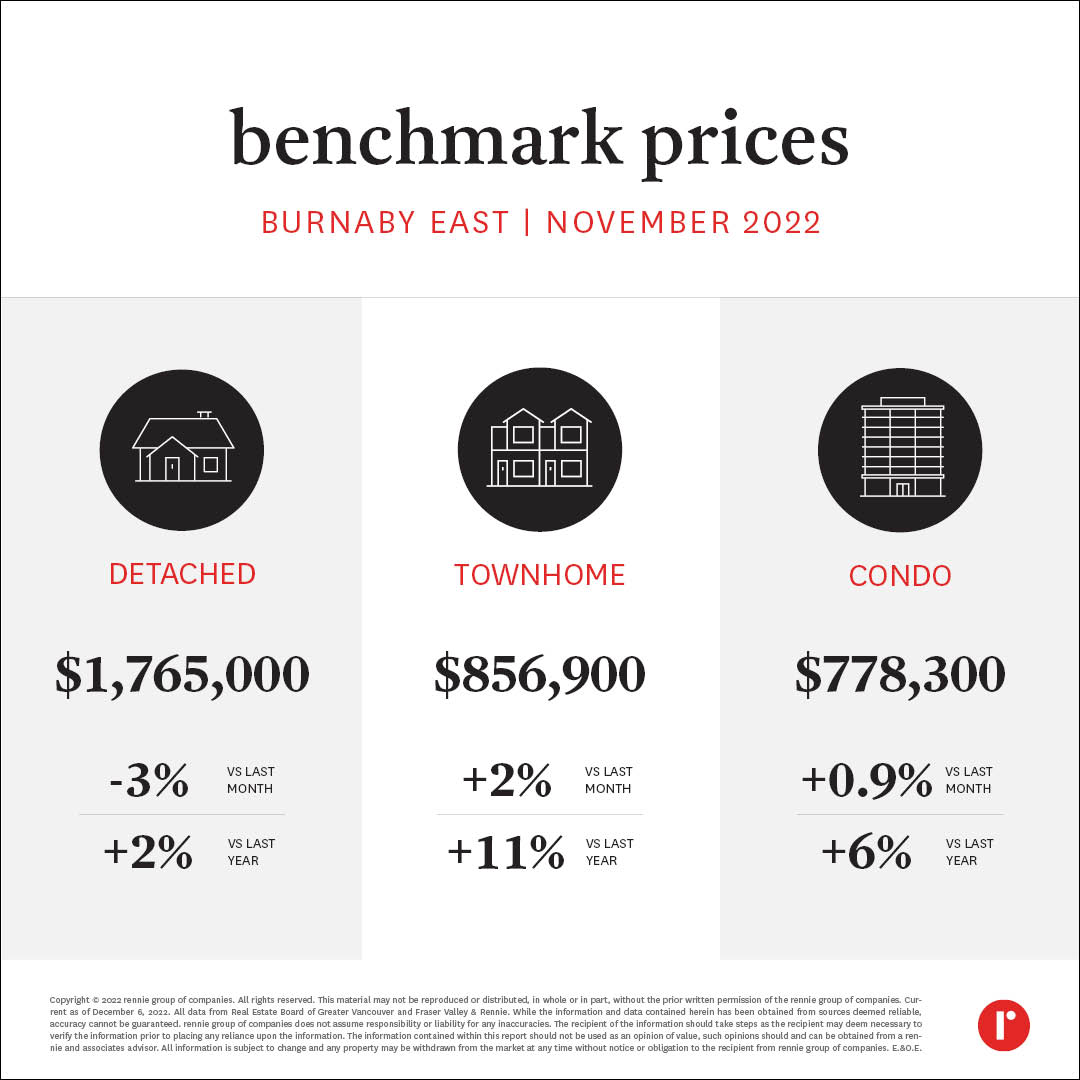 Burnaby North
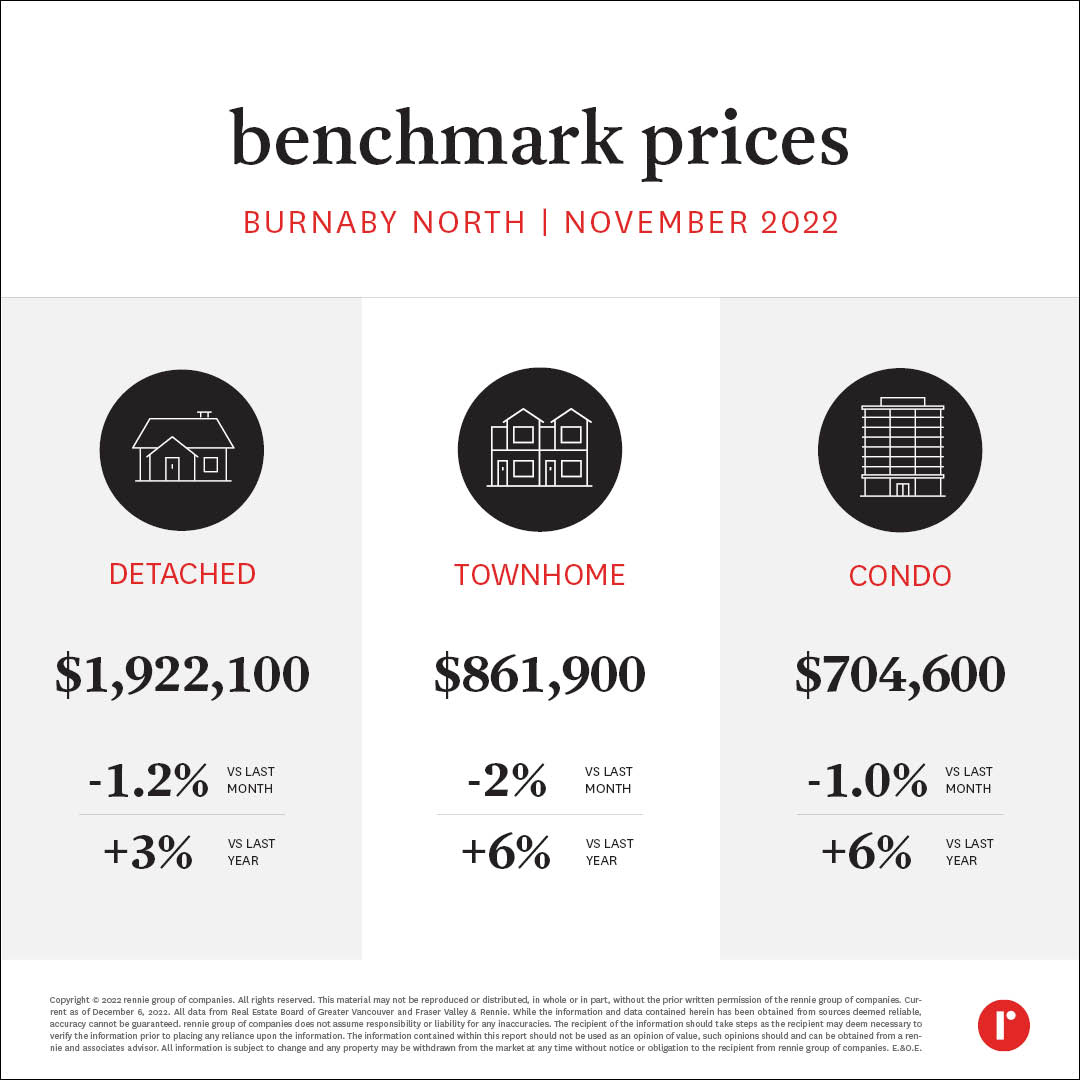 Burnaby South
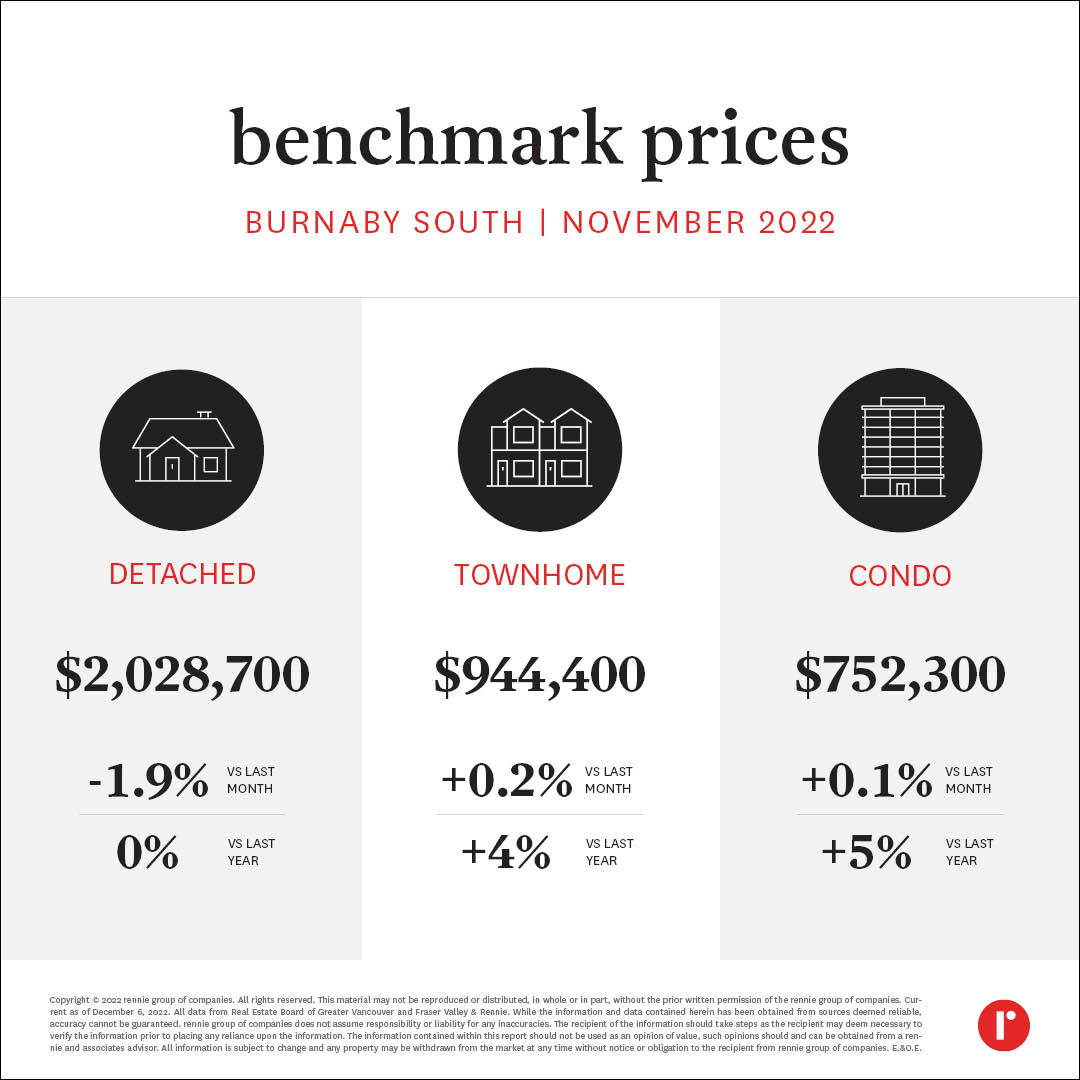 Coquitlam
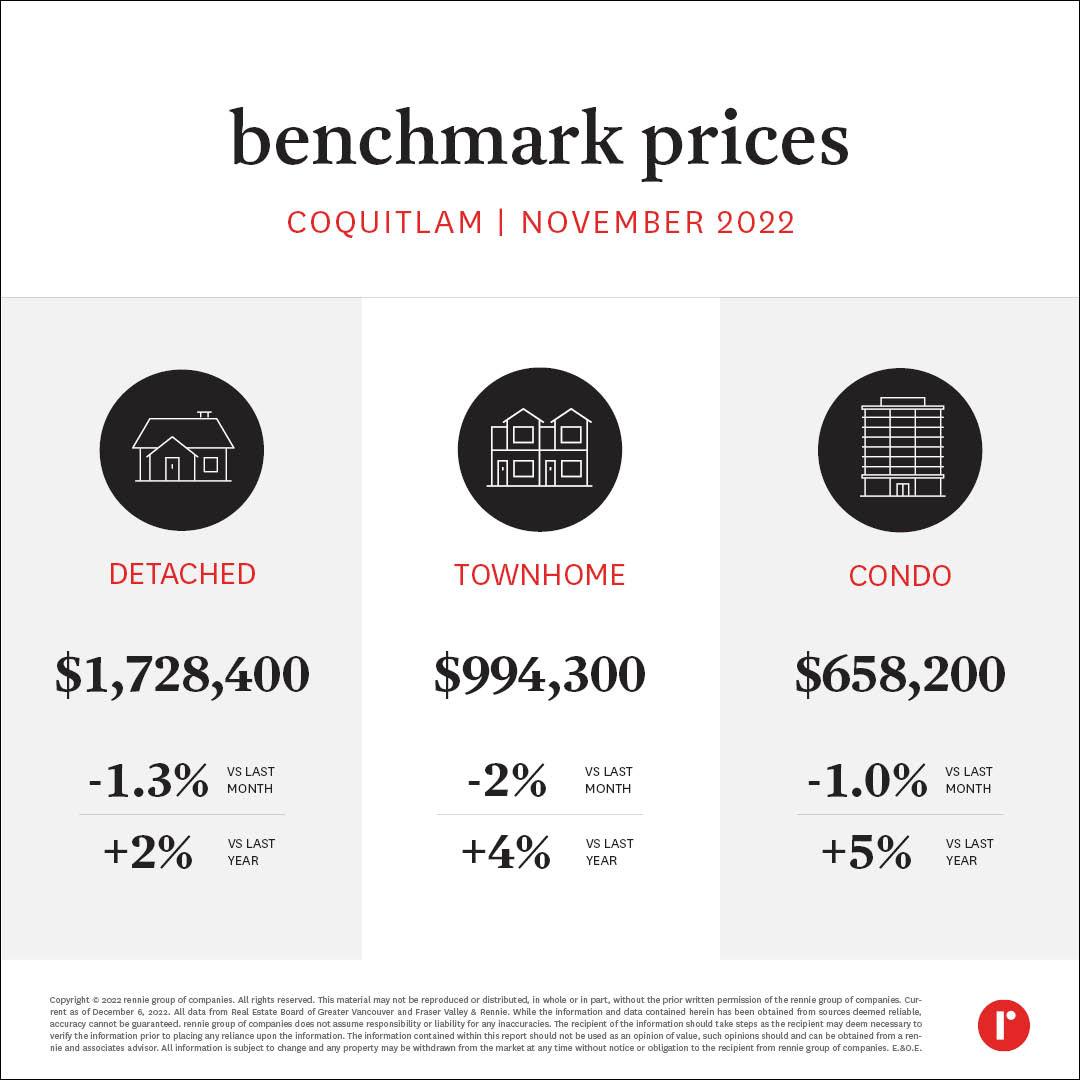 North Vancouver
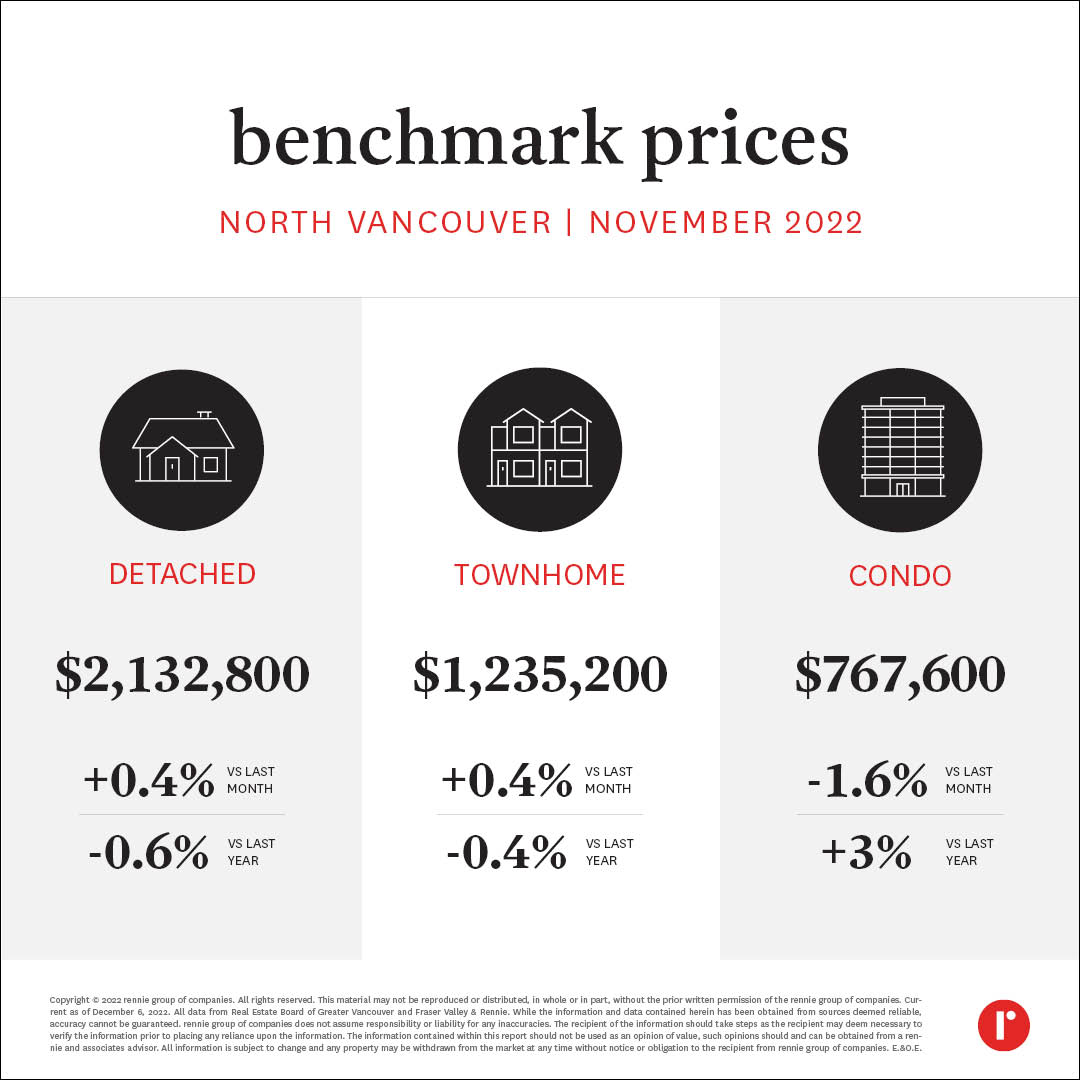 Richmond
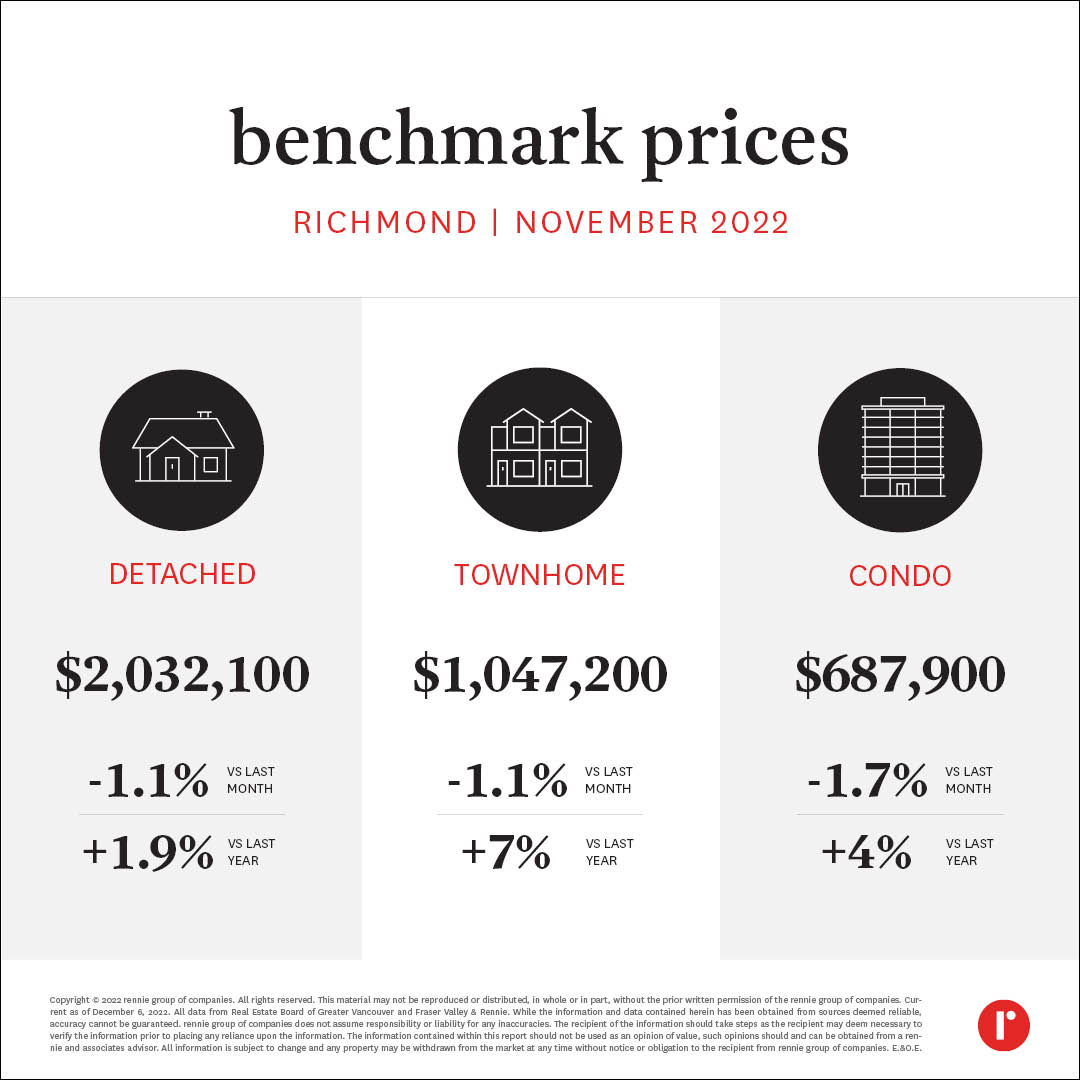 Vancouver East
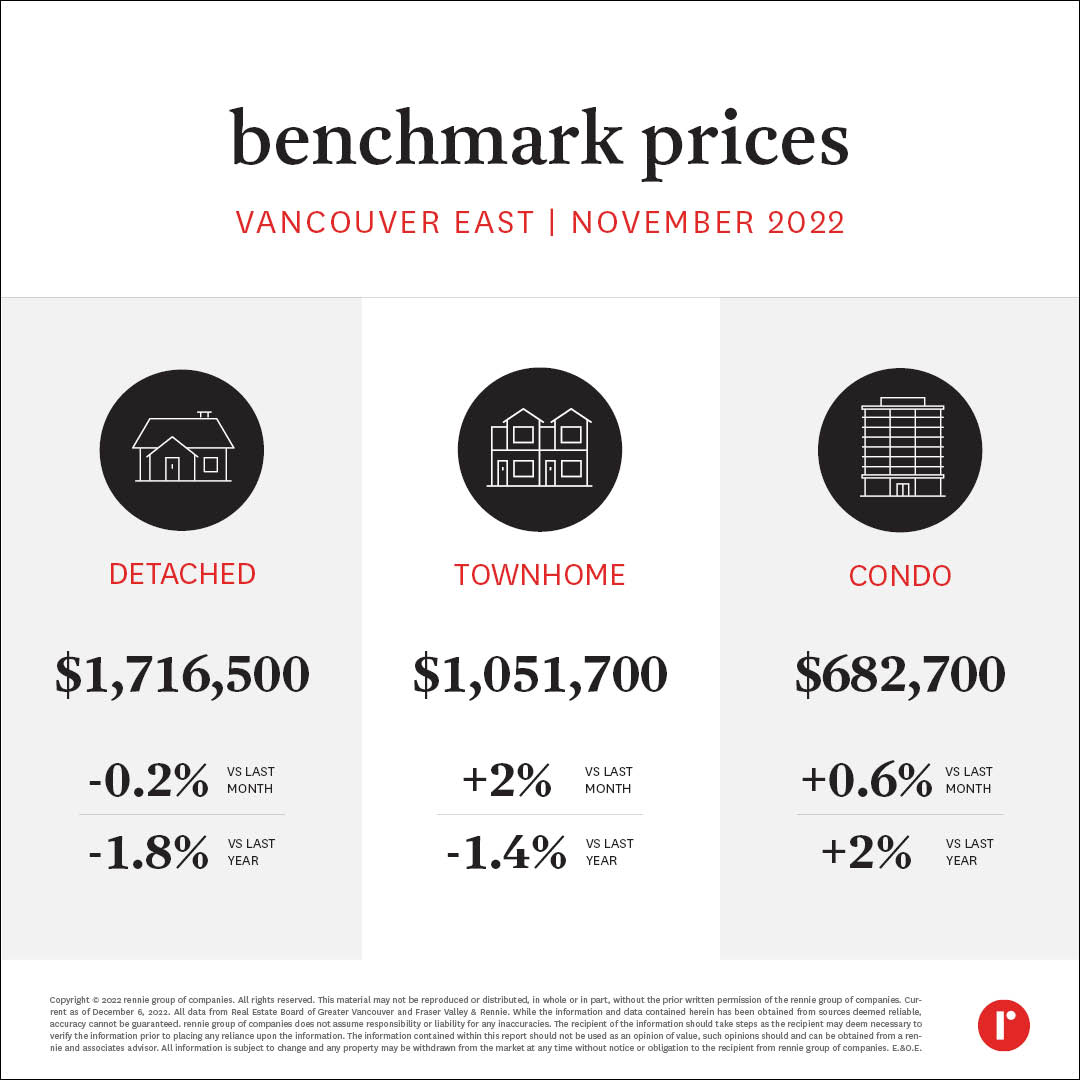 Vancouver West
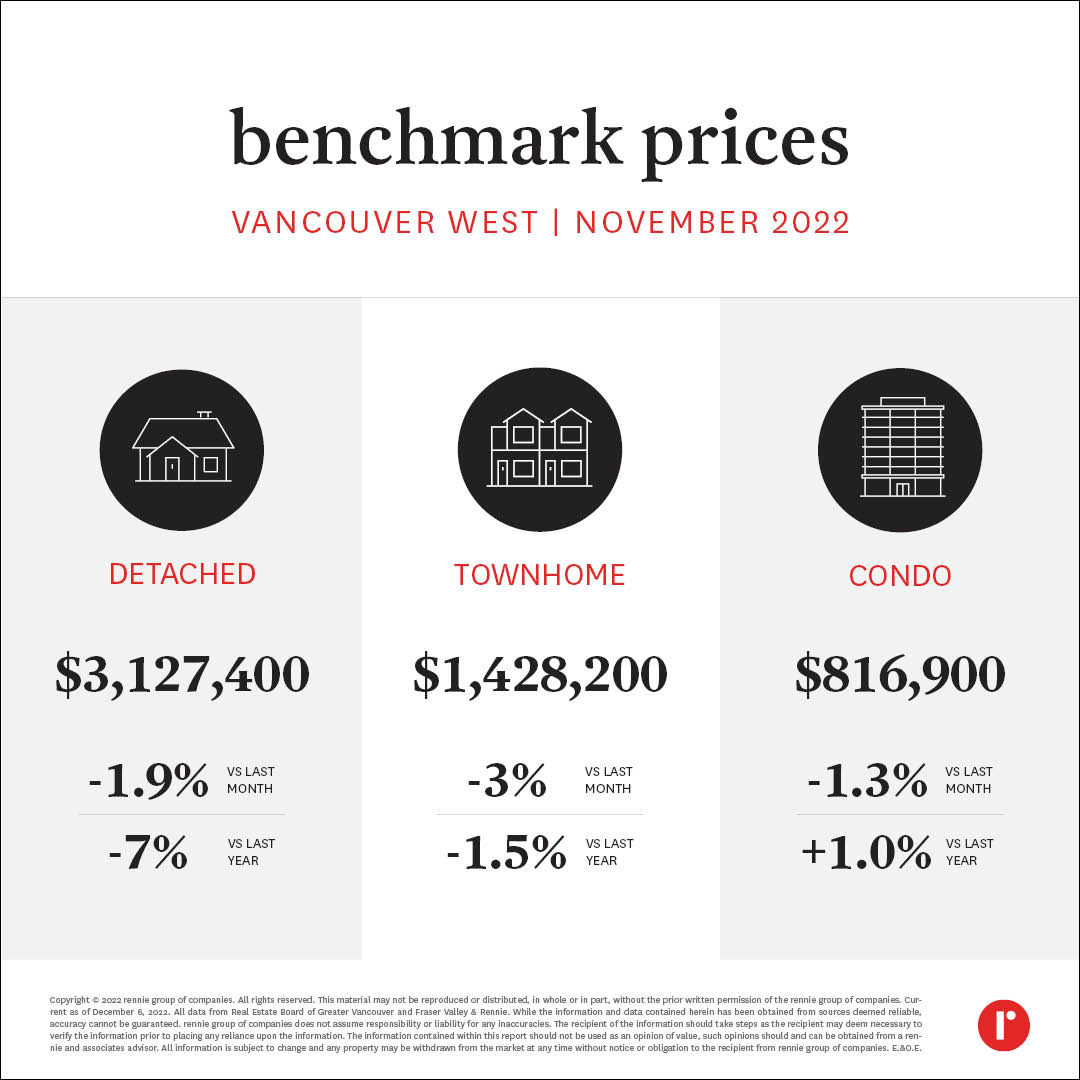 West Vancouver
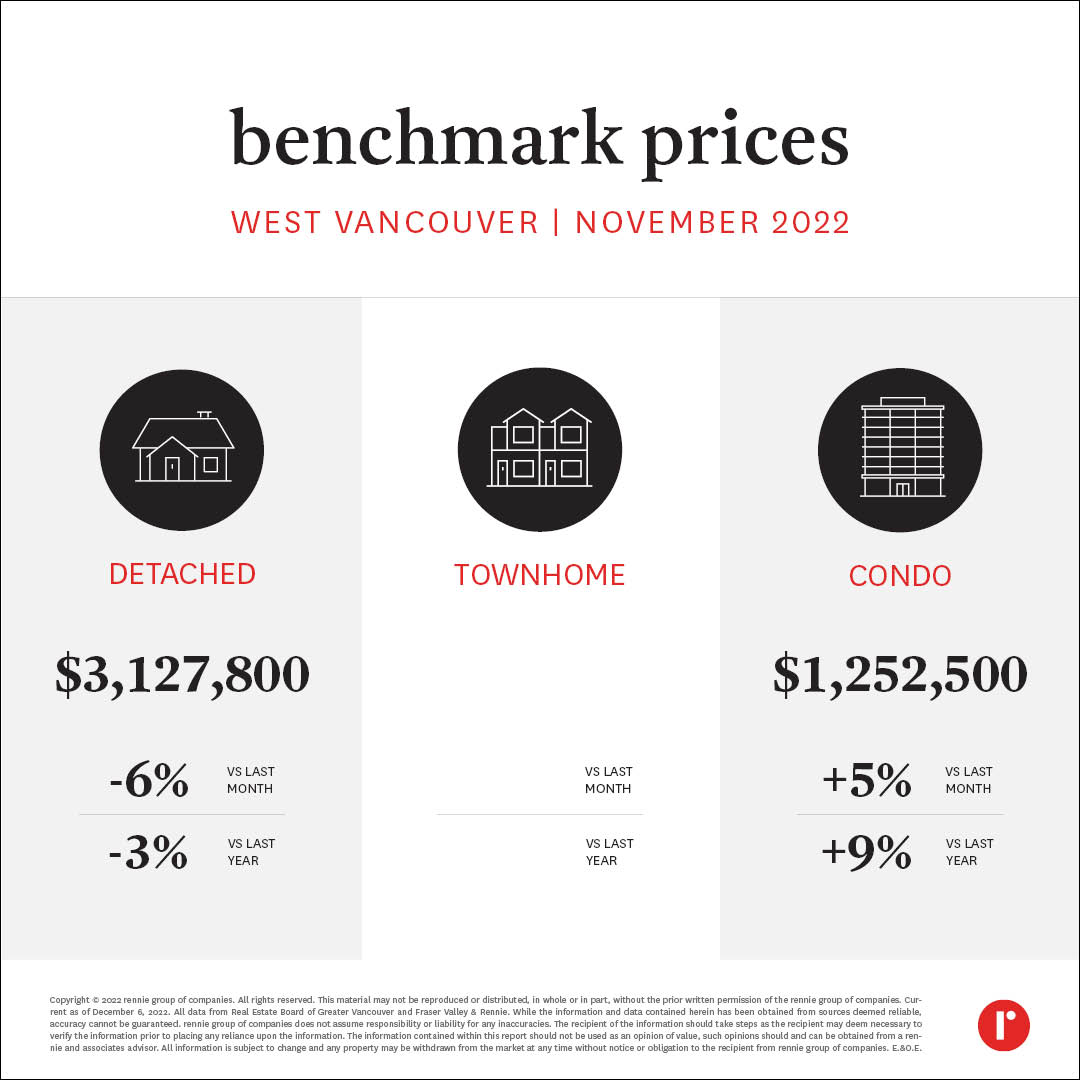 New Westminster
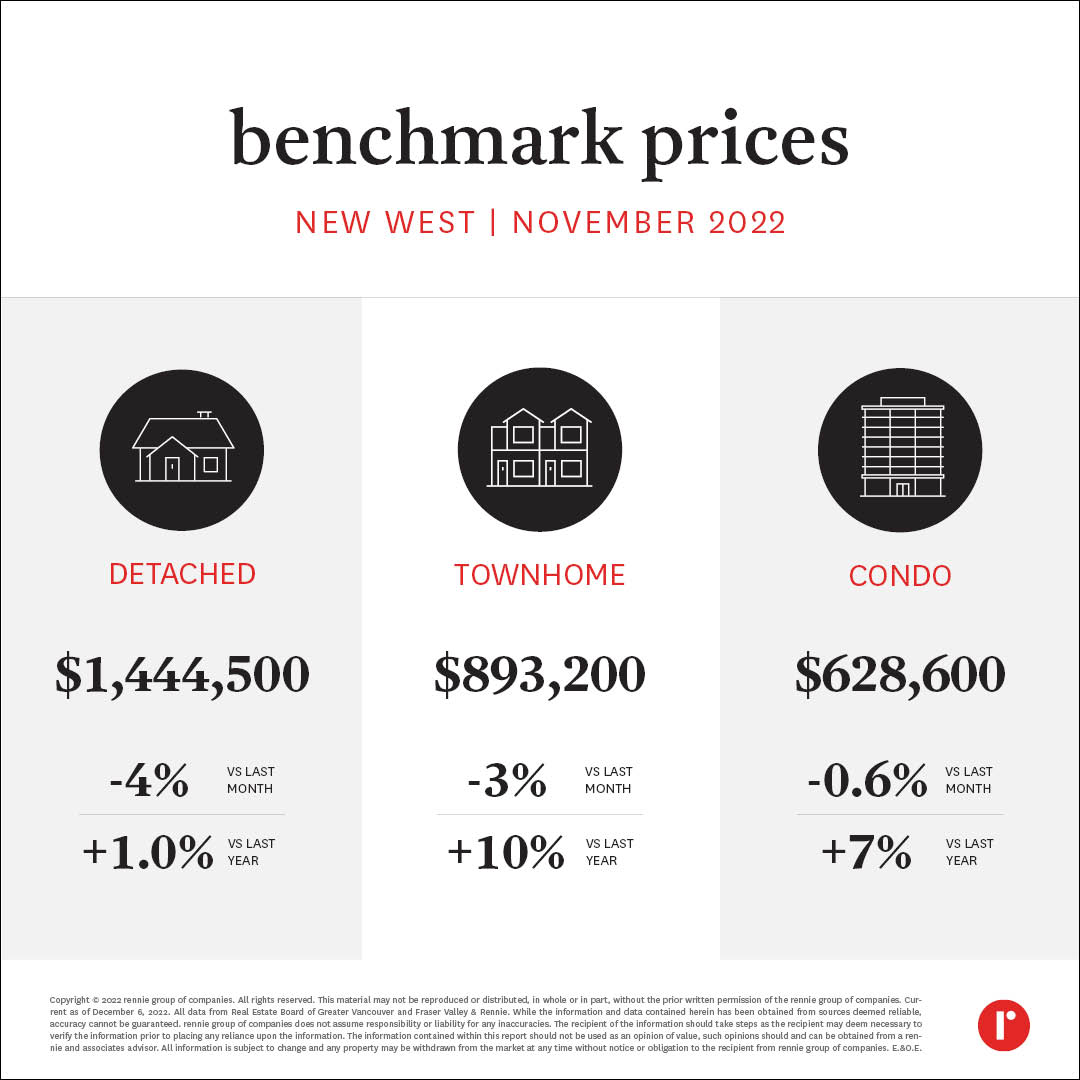 Squamish
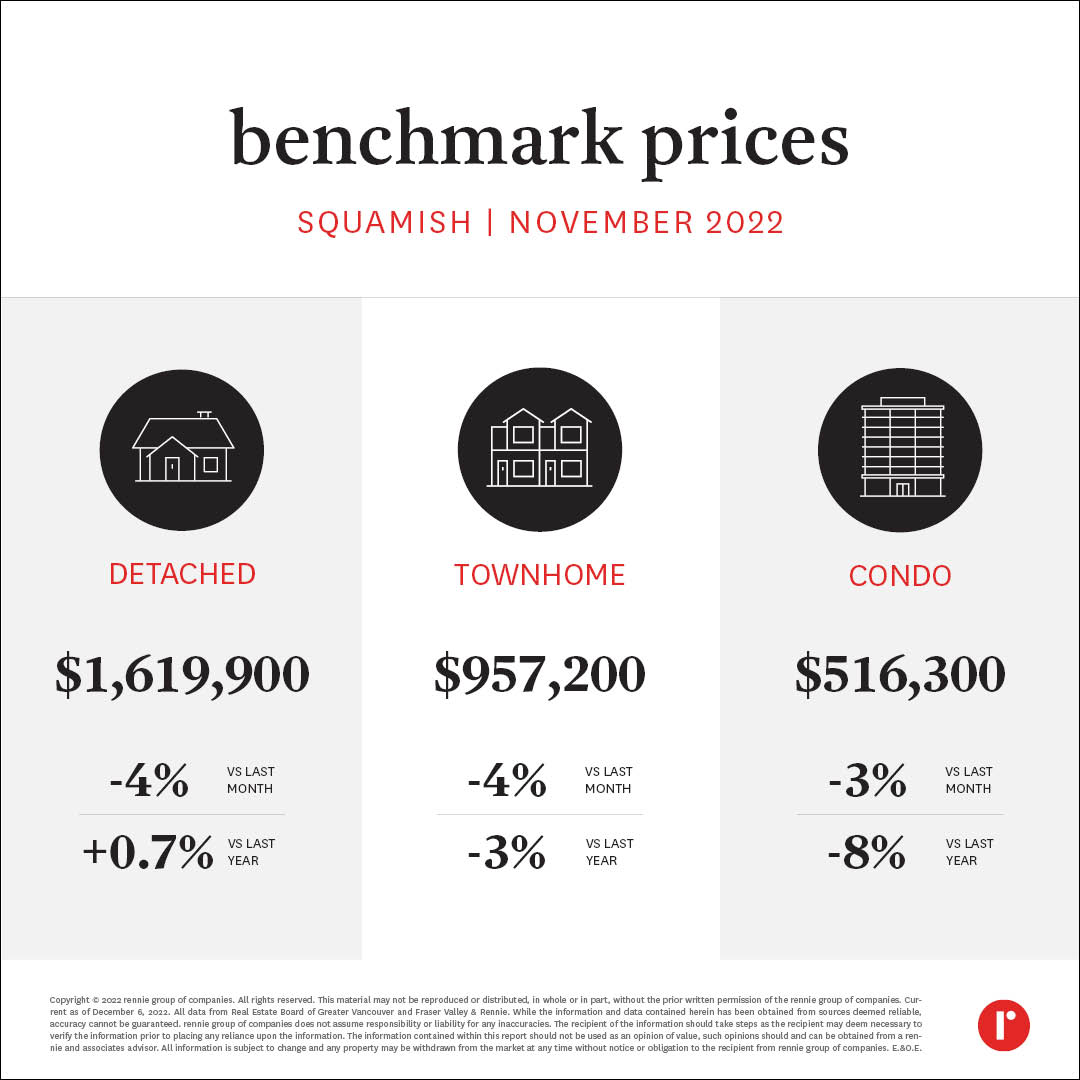 Tsawwassen
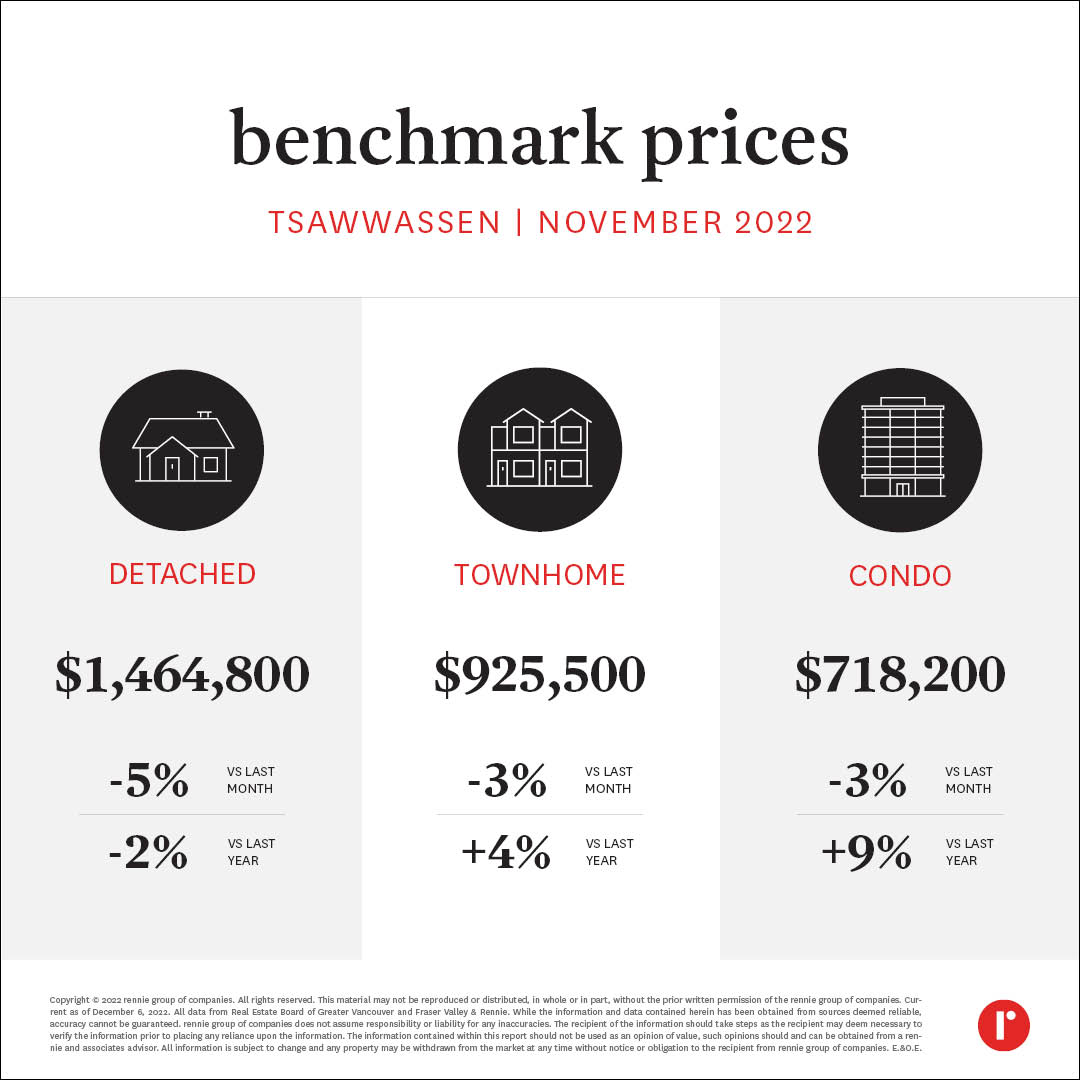 Port Coquitlam
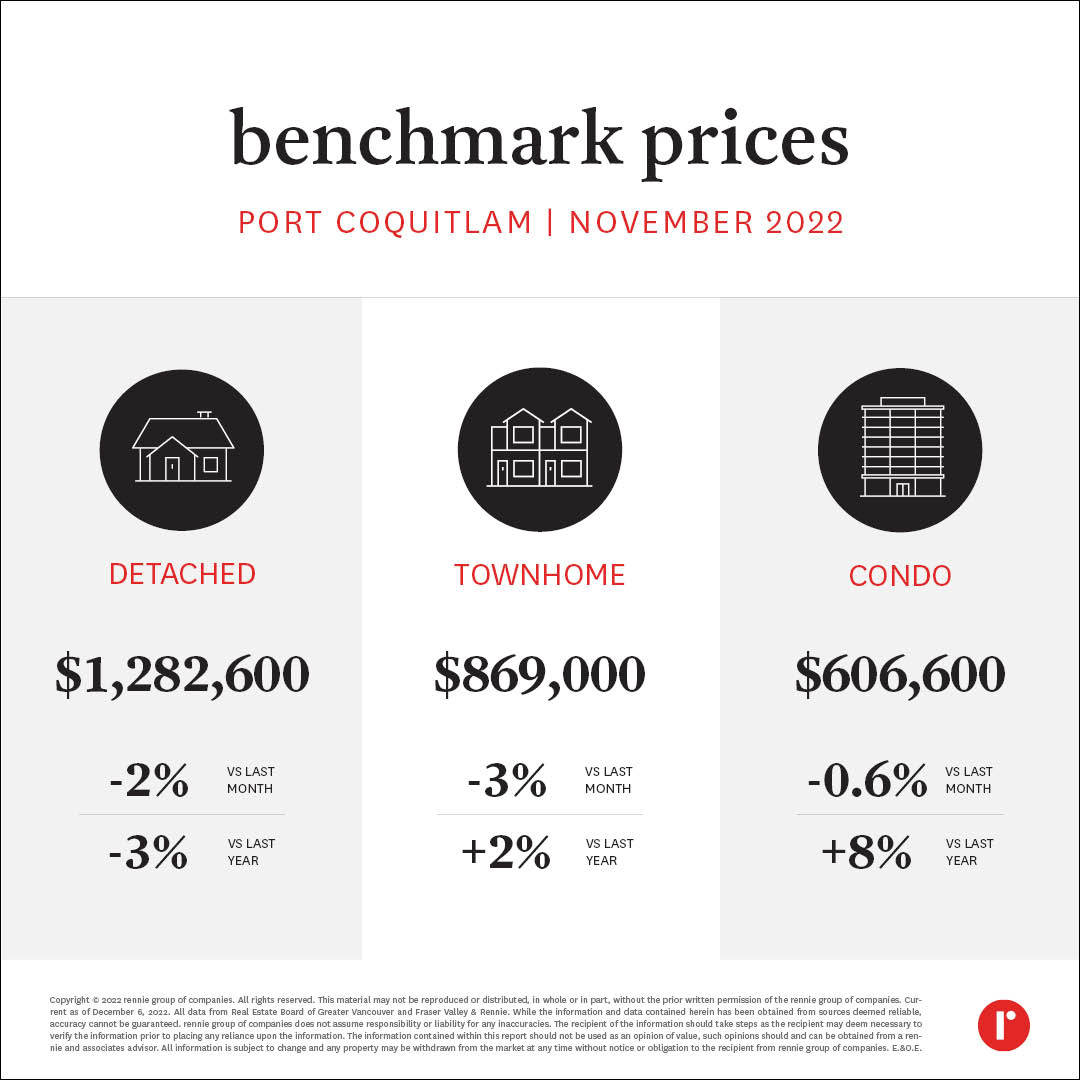 Port Moody
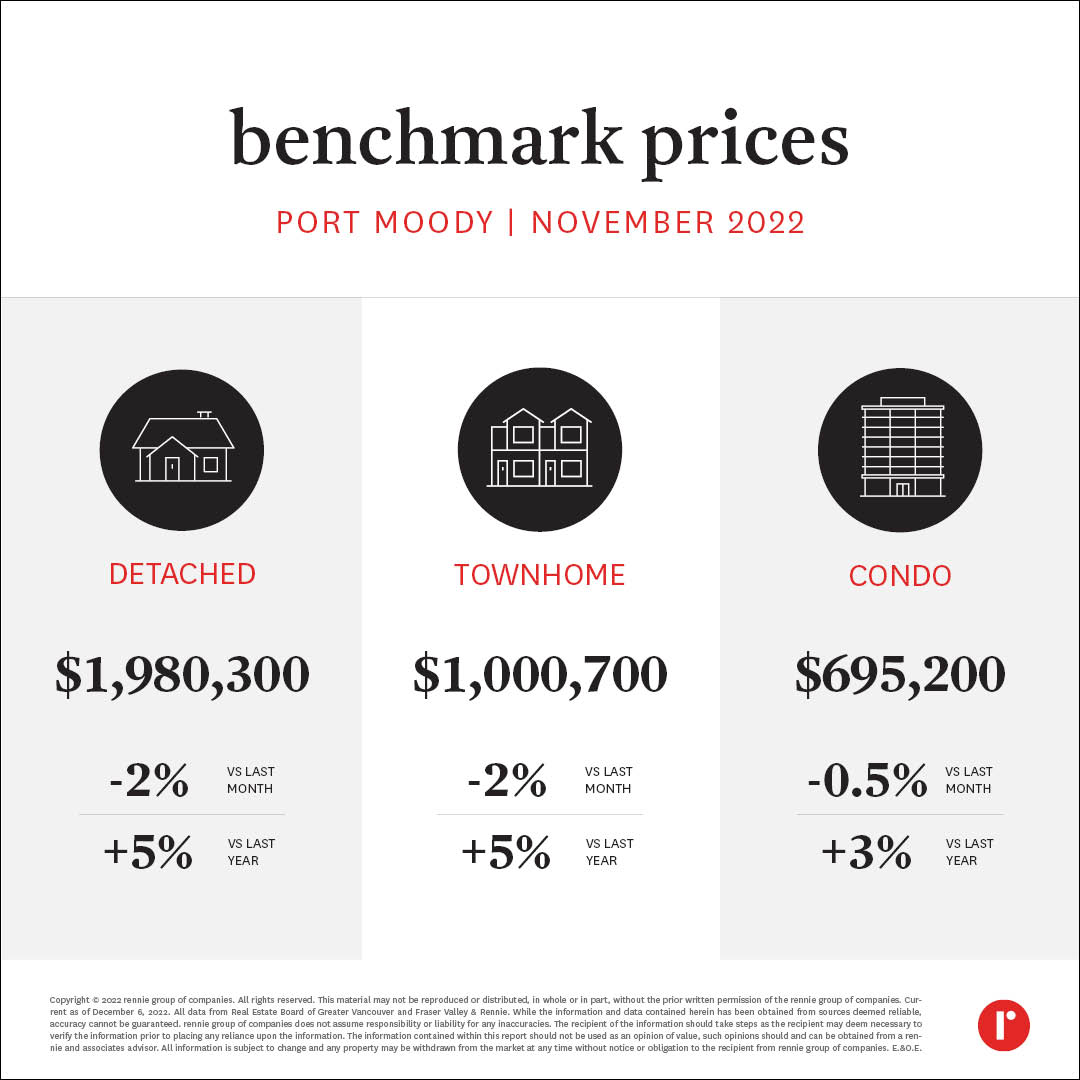 Fraser Valley Board Area
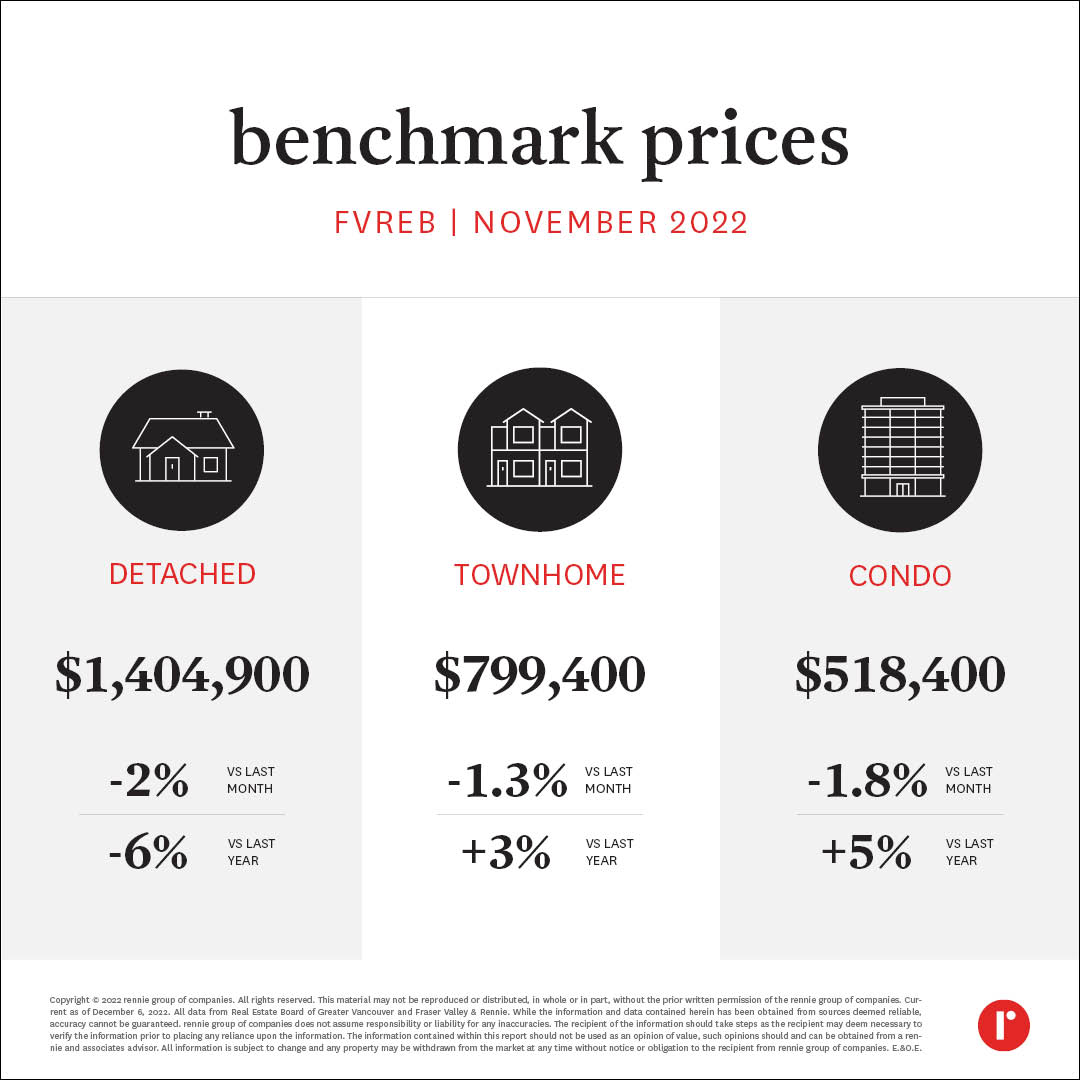 Surrey
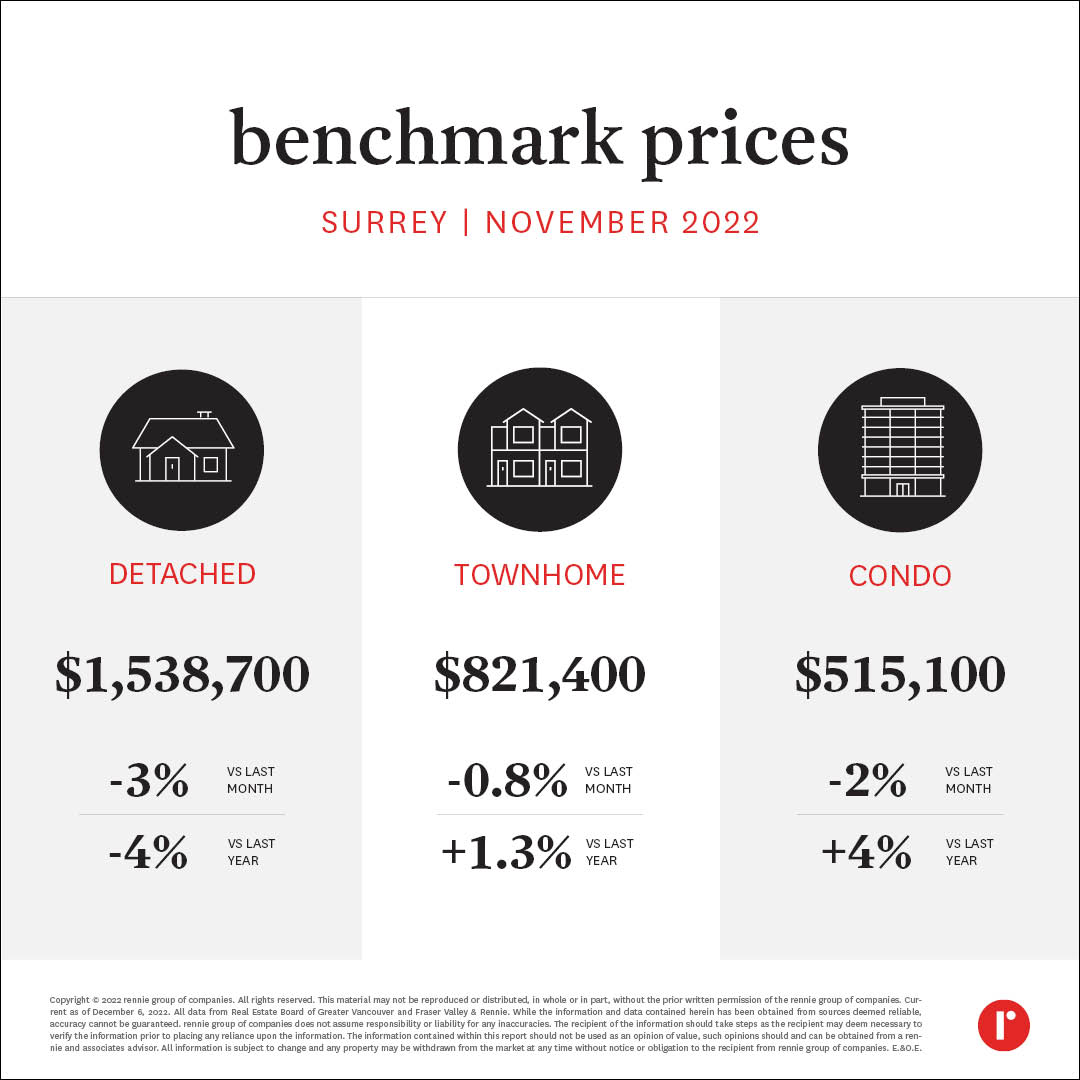 Langley
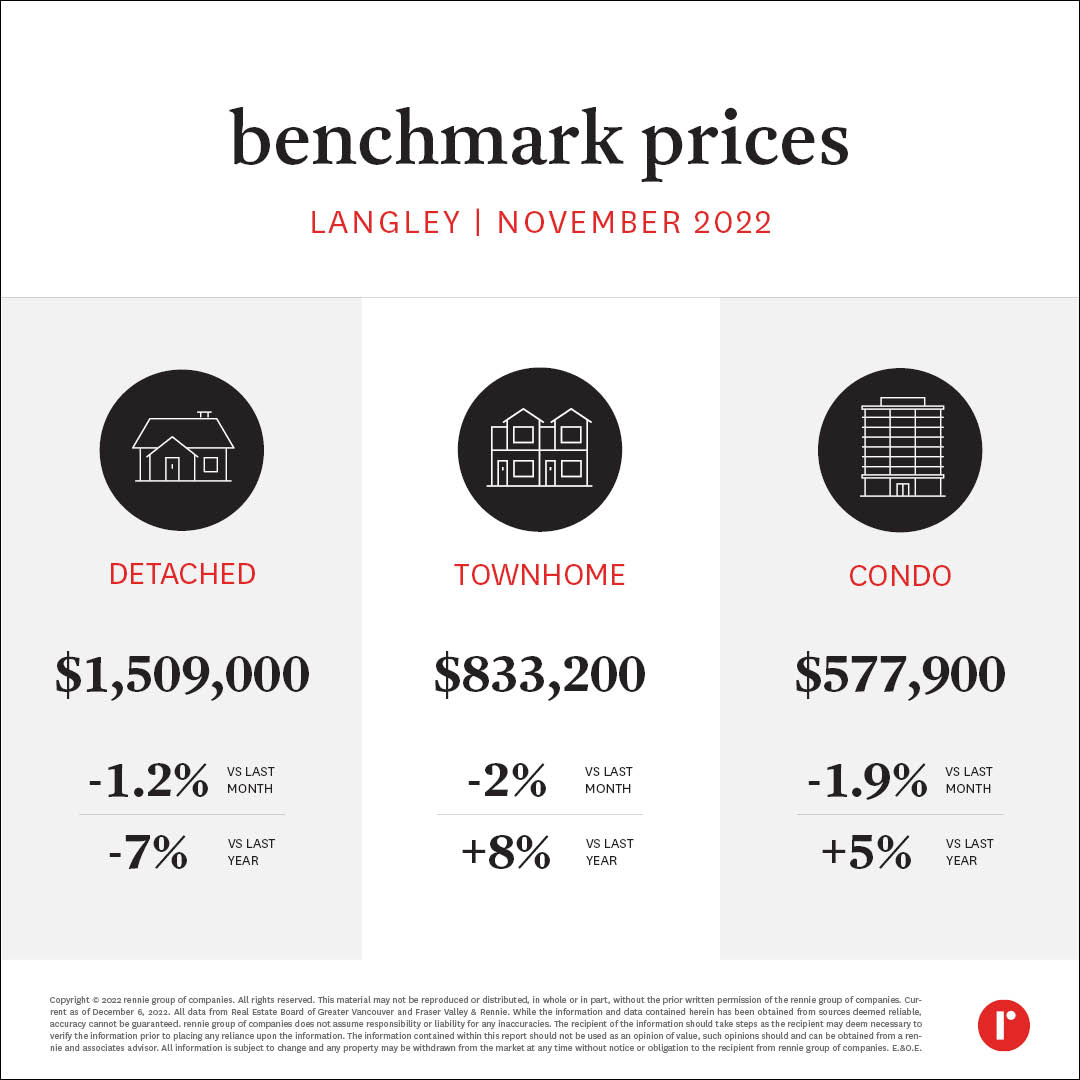 Pitt Meadows
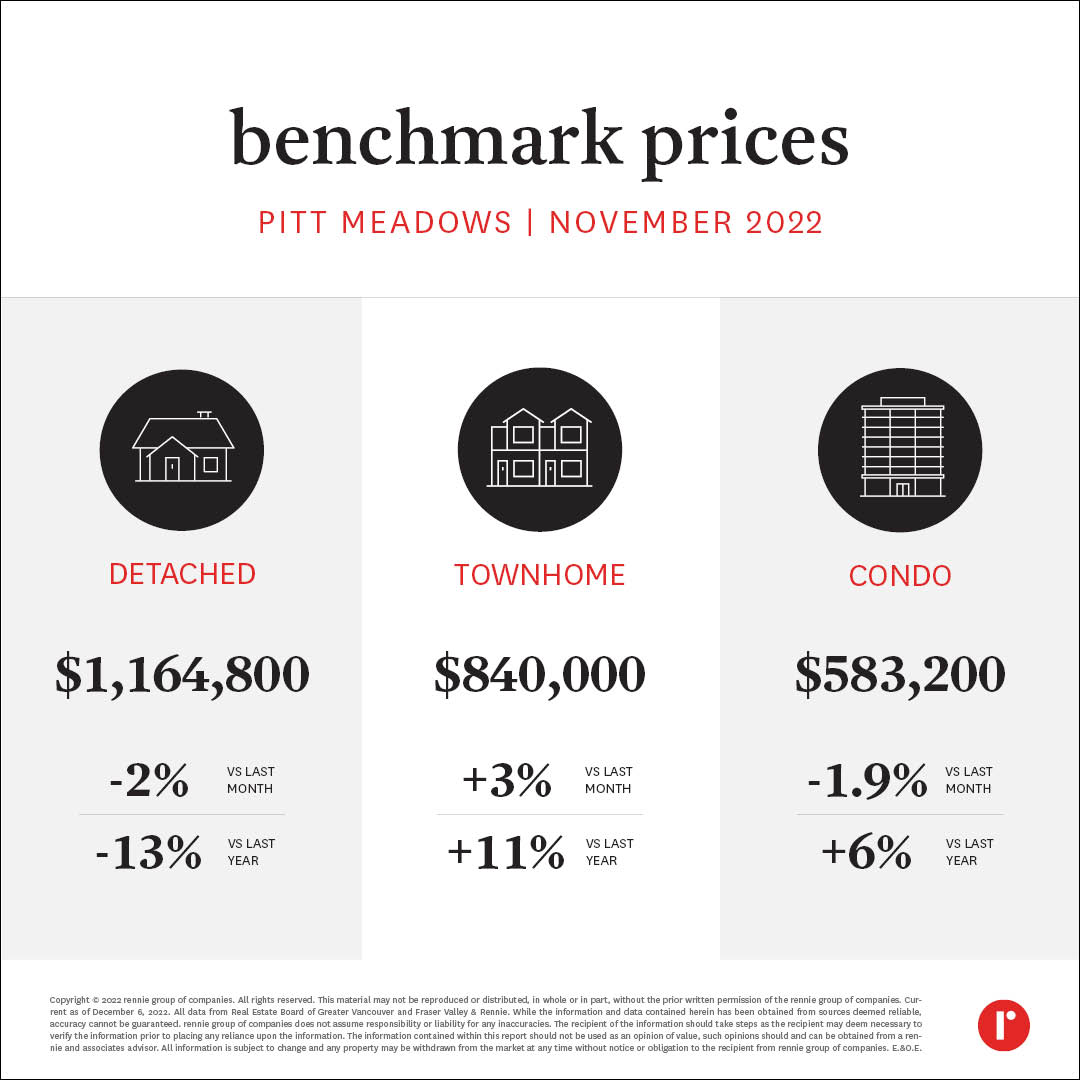 Maple Ridge
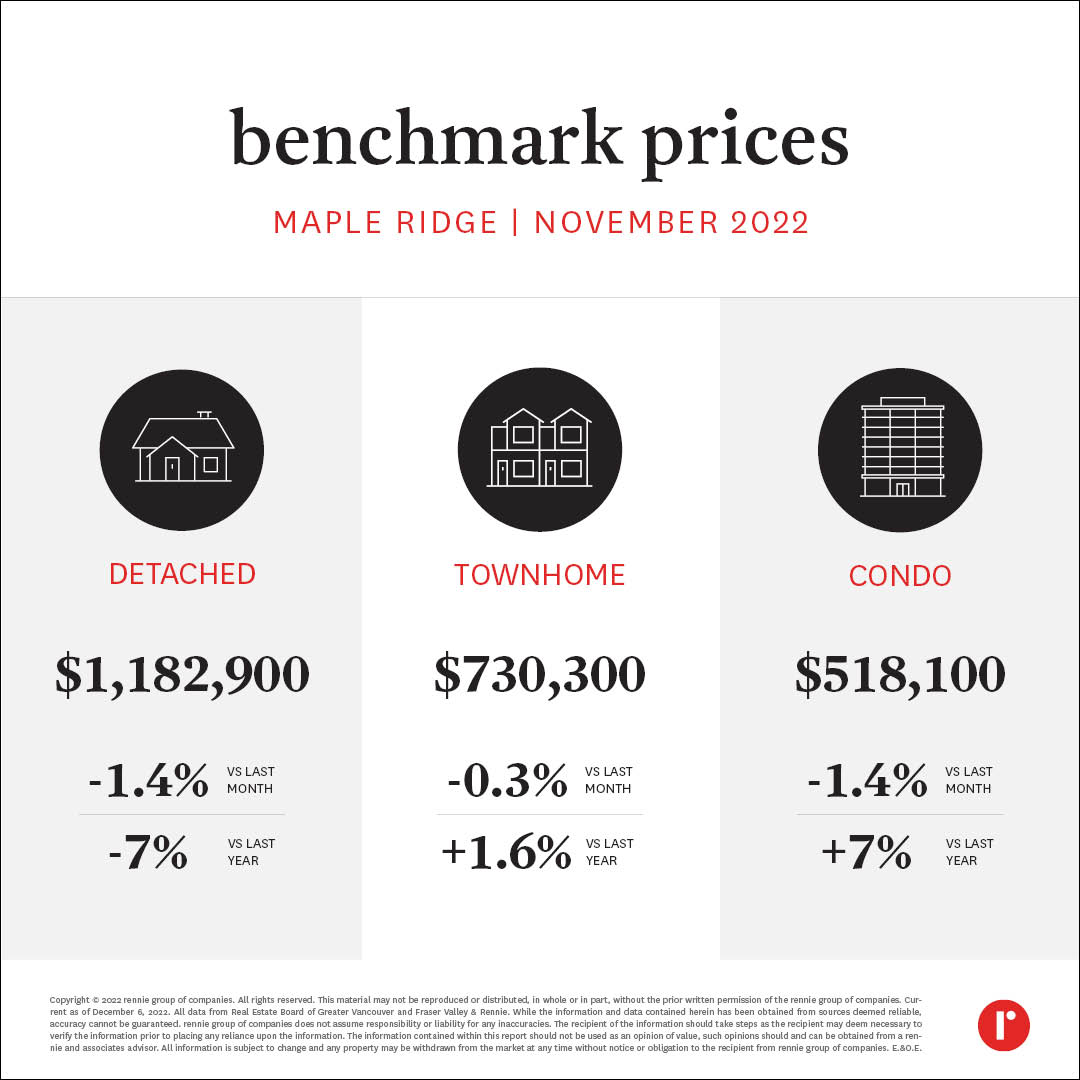 White Rock
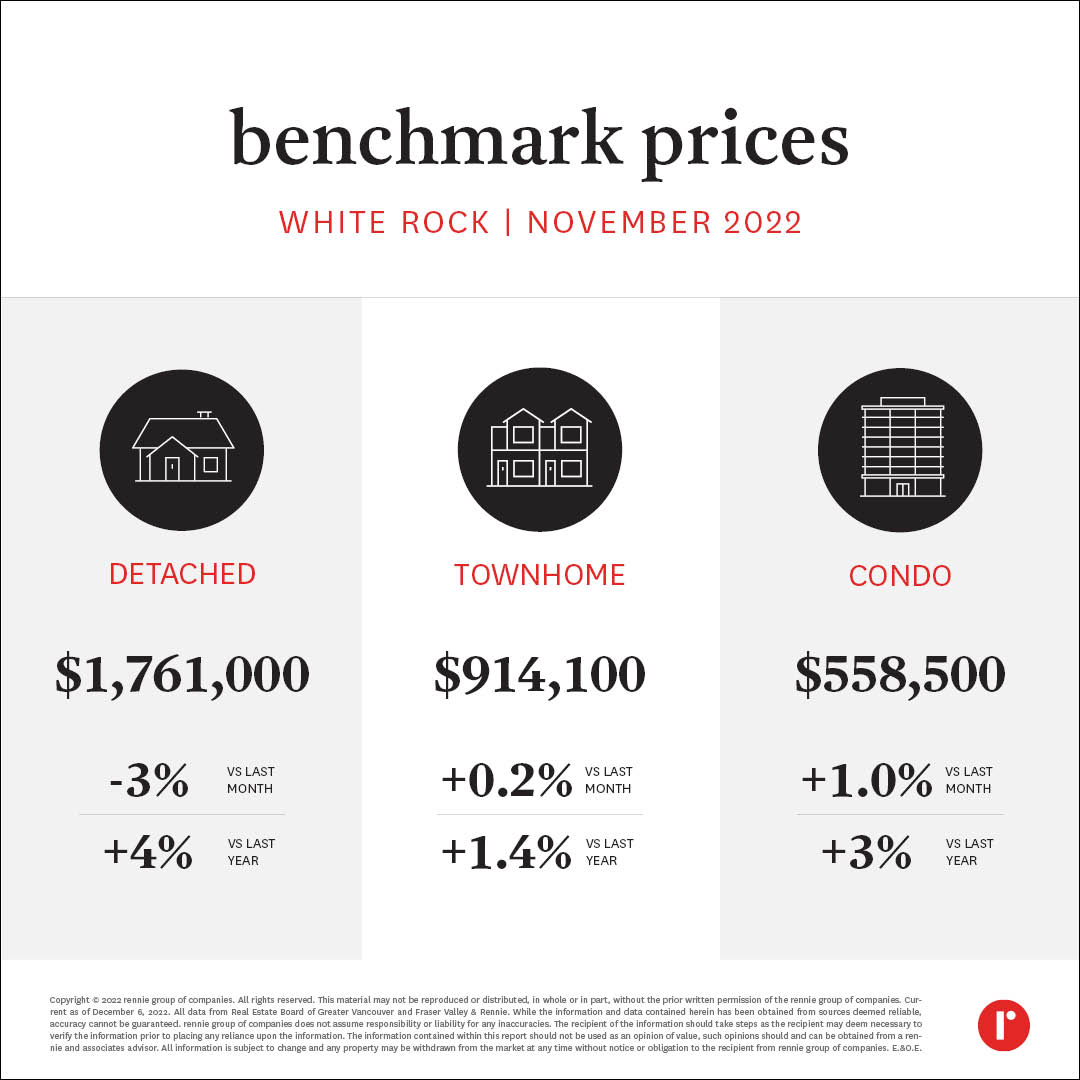 Abbotsford
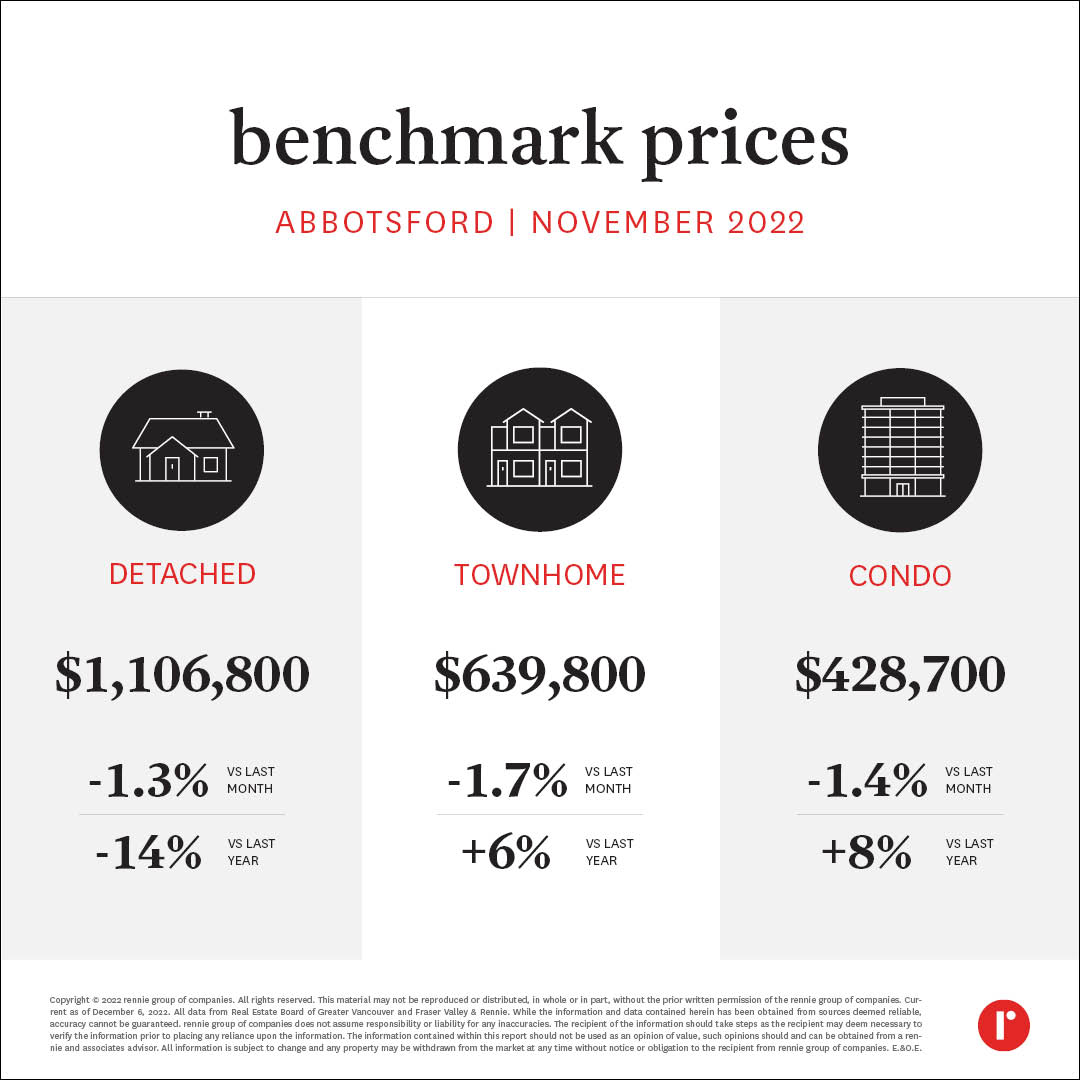 Chilliwack and District Board Area
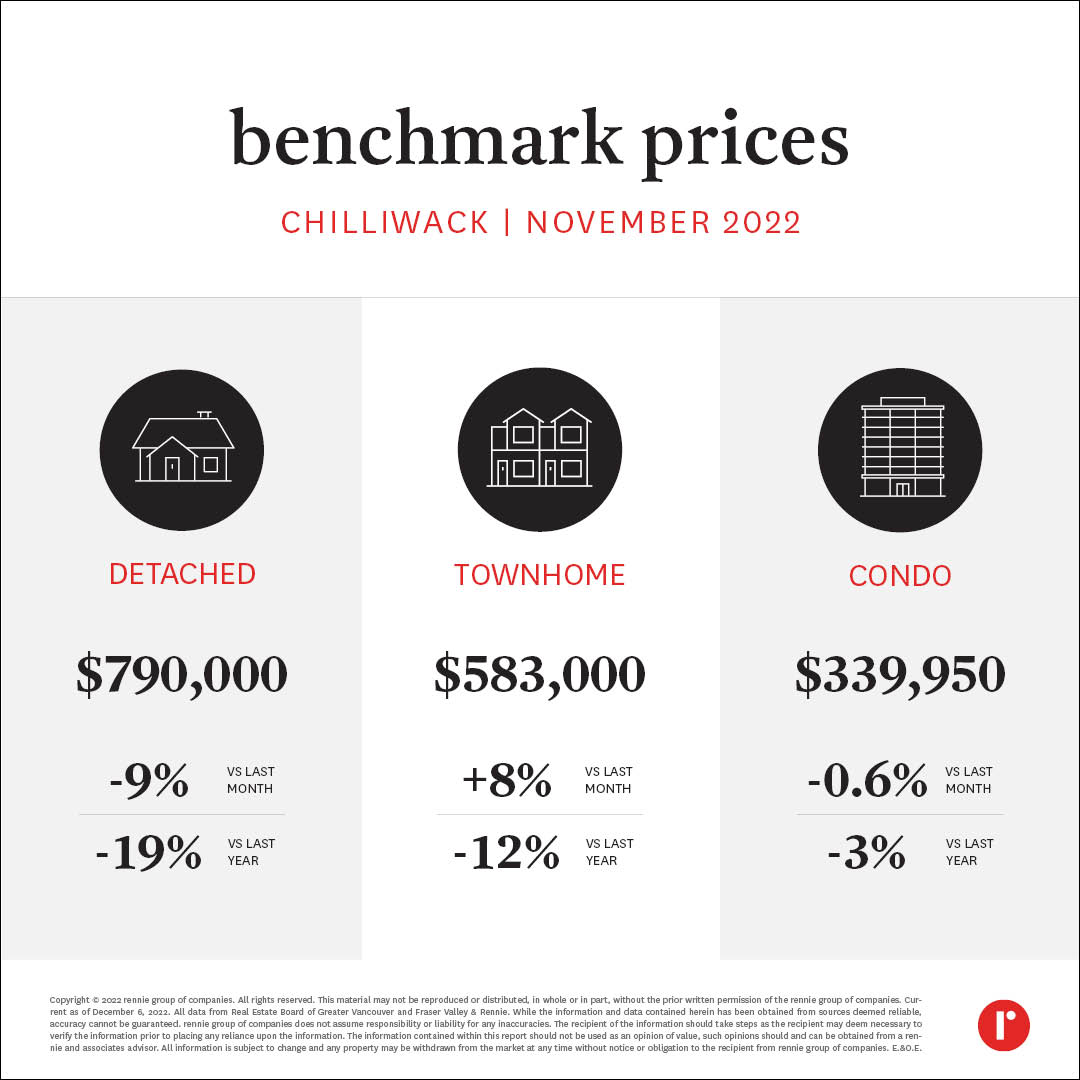 North Delta
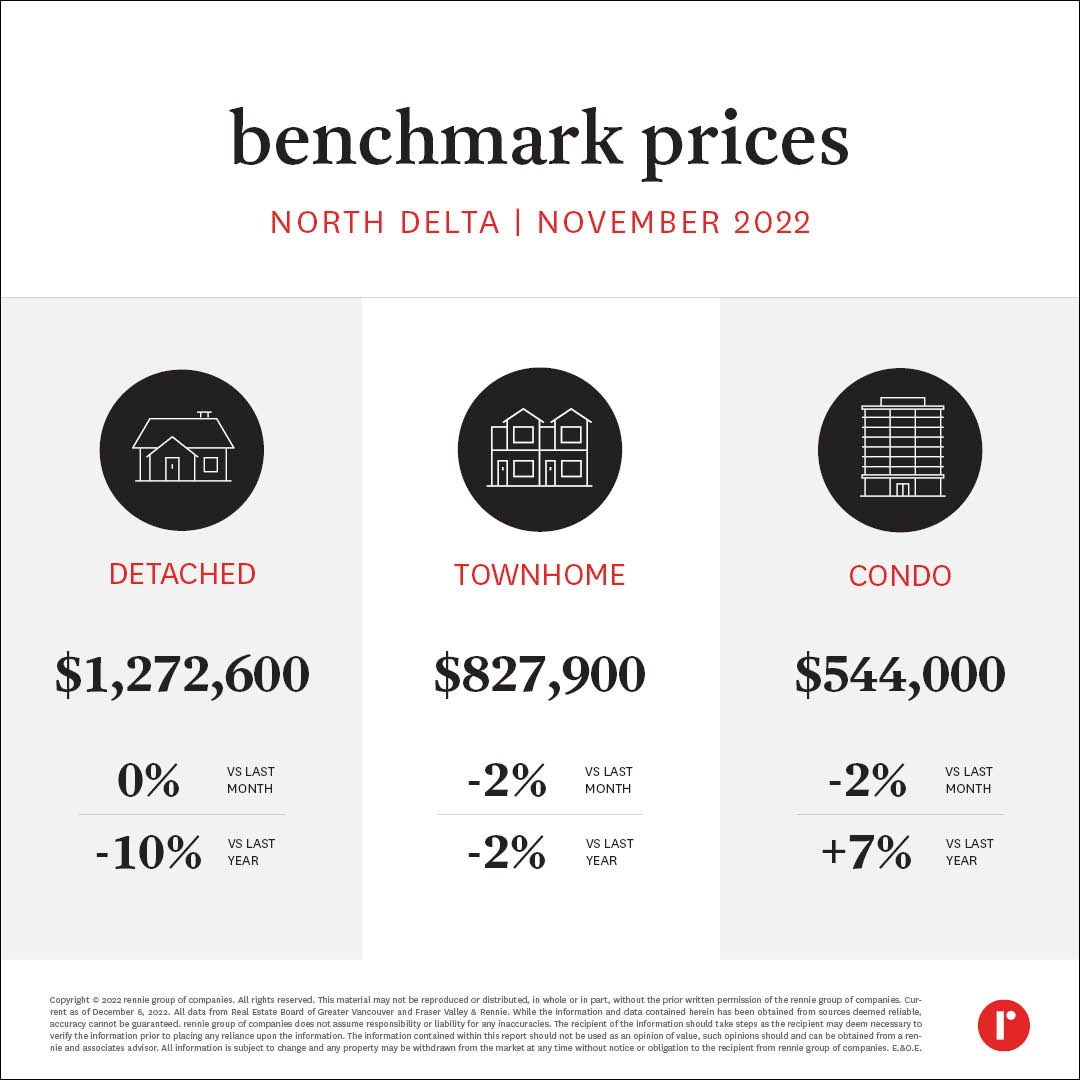 Note, the Chilliwack and District Board Area (CADREB) denotes the Median Sales Price rather than the Benchmark Price. The CADREB does not have a benchmark price available for record.
See Benchmark Prices Infographics for November 2022. Our rennie intelligence team comprises our in-house demographer, senior economist, and market analysts. Together, they empower individuals, organizations, and institutions with data-driven market insight and analysis. Experts in urban land economics, community planning, shifting demographics, and real estate trends, their strategic research supports a comprehensive advisory service offering and forms the basis of frequent reports and public presentations. Their thoughtful and objective approach truly embodies the core values of rennie.
Written by
Related
Sales in Greater Victoria remained below last year’s level in March, driven entirely by slumping condo deals, resulting in the fewest total transactions for the month since 2014. New listings continued to come to market ahead of last year’s elevated pace, pushing active listings to their highest tally in March since 2015.
Apr 2026
Report
While all eyes were on the Indian Wells Open in March, sales in the Coachella Valley also had something to showcase, reaching their highest level for the month since 2022. In contrast, new listings were at their lowest level for the month in available data back to 2014.
Apr 2026
Report