Benchmark Prices - July 2019
Jul 08, 2019
Written by
Ryan BerlinSHARE THIS
Here are the latest Benchmark Price Infographics for the areas of the Lower Mainland covered in the monthly rennie review. Greater Vancouver Board Area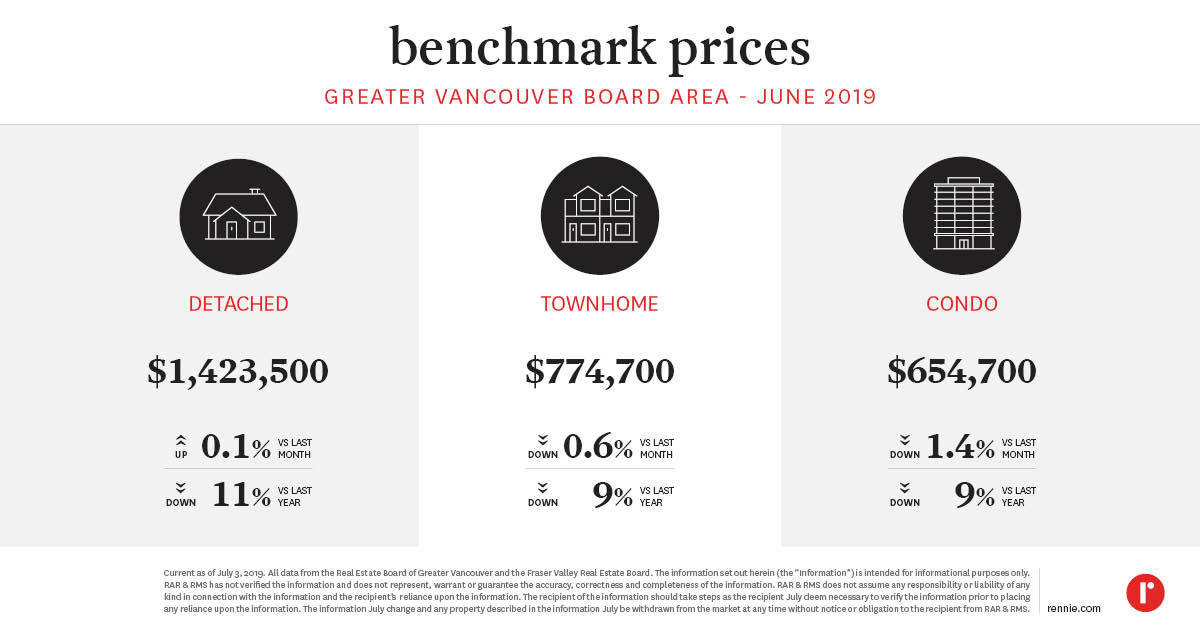 Burnaby East
 Burnaby North
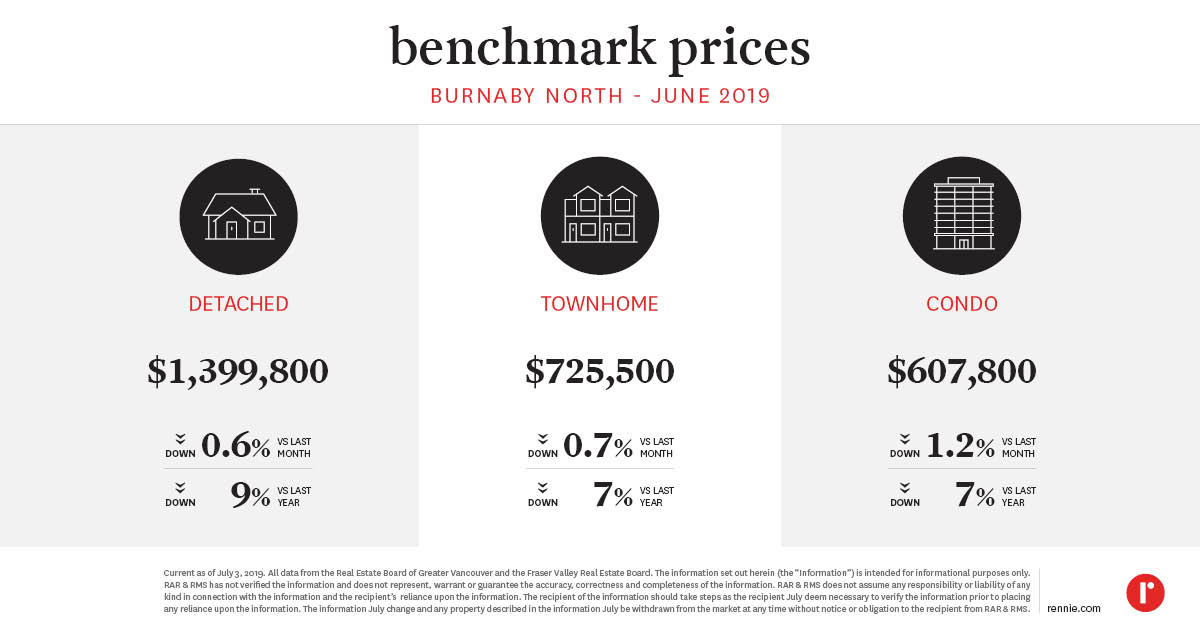 Burnaby South
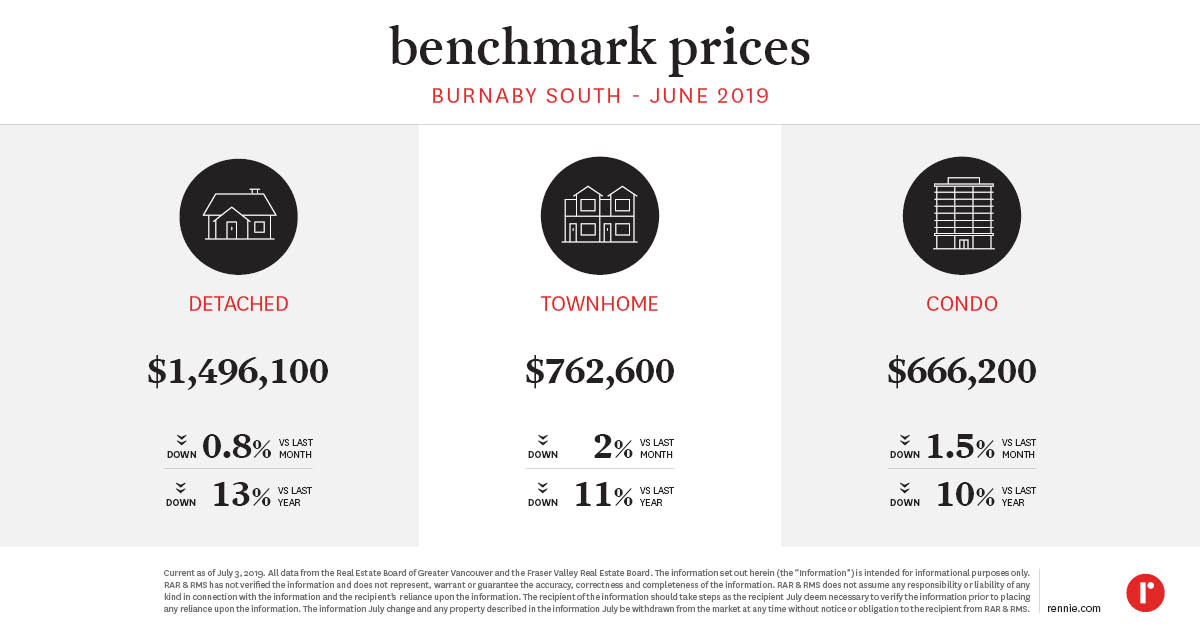 Coquitlam
 North Vancouver
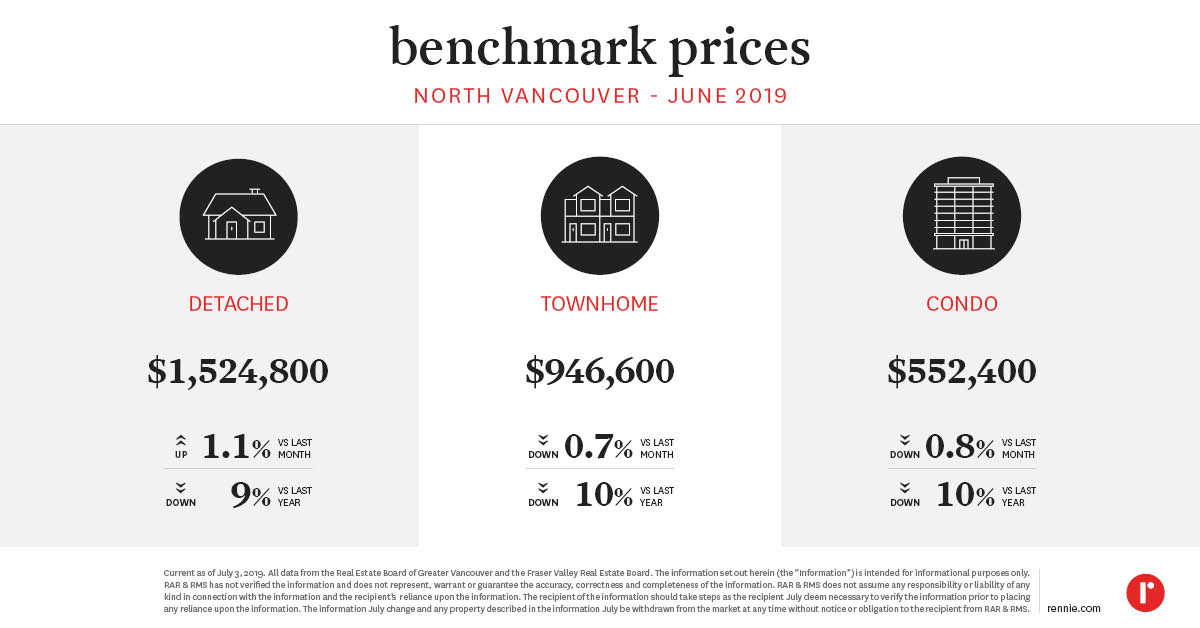 Richmond
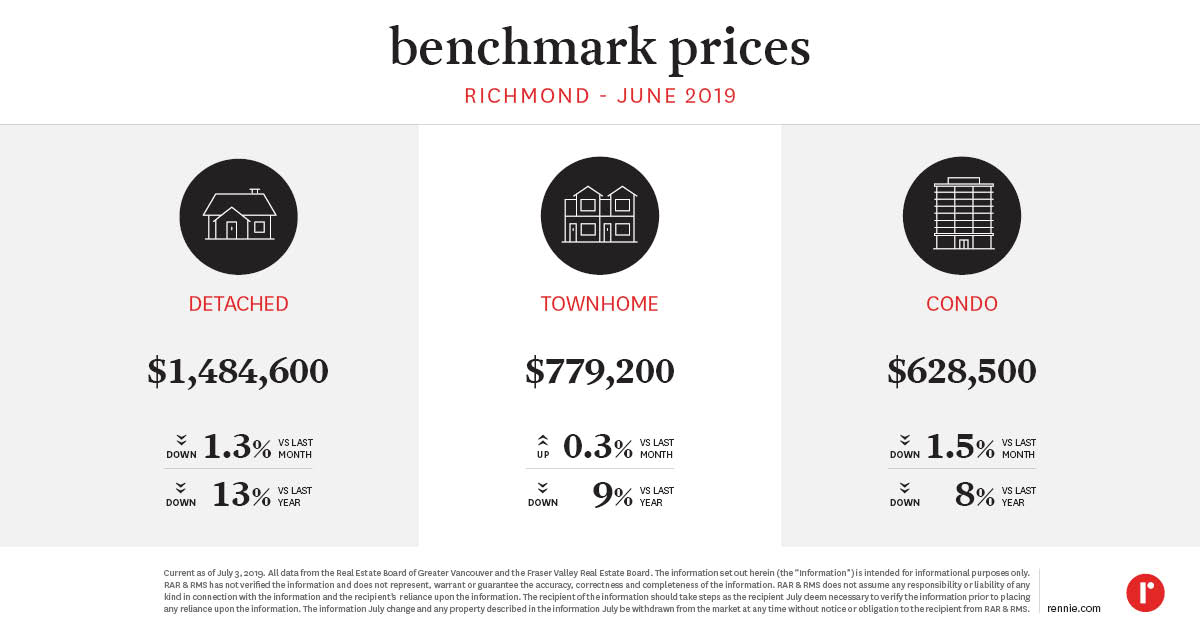 Vancouver East
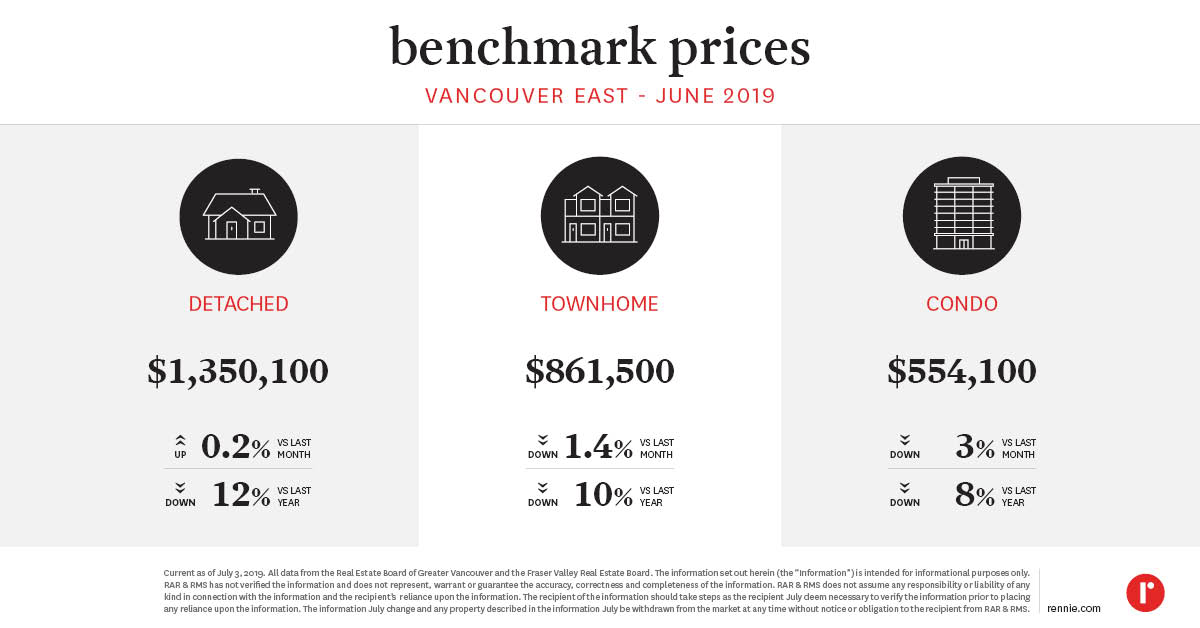 Vancouver West
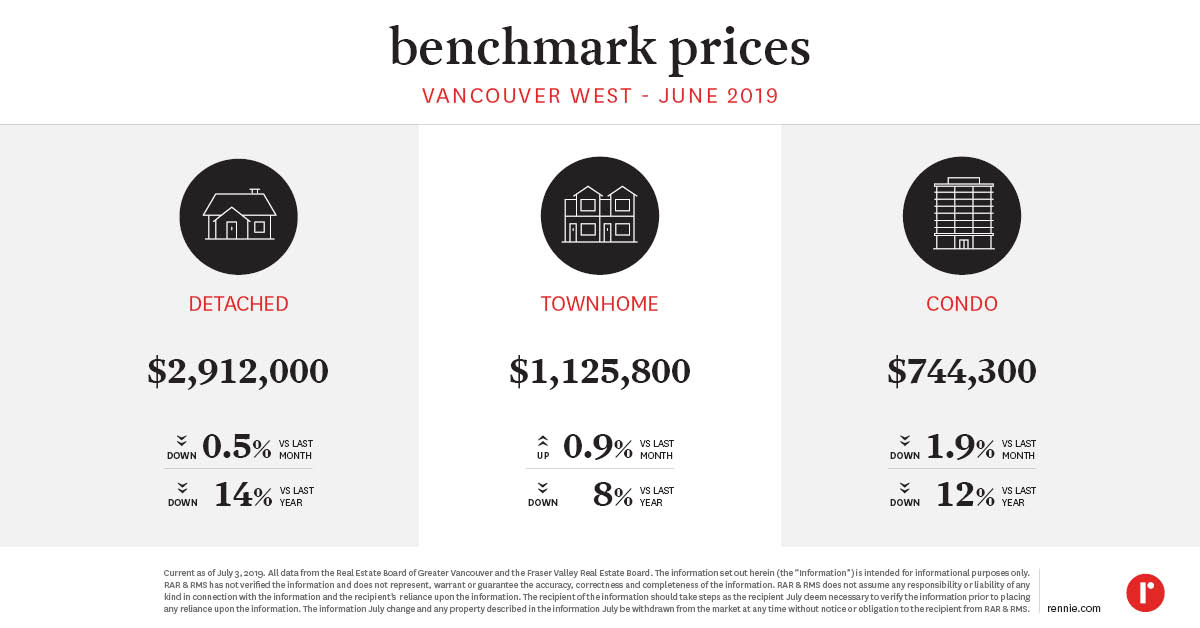 West Vancouver
 New Westminster
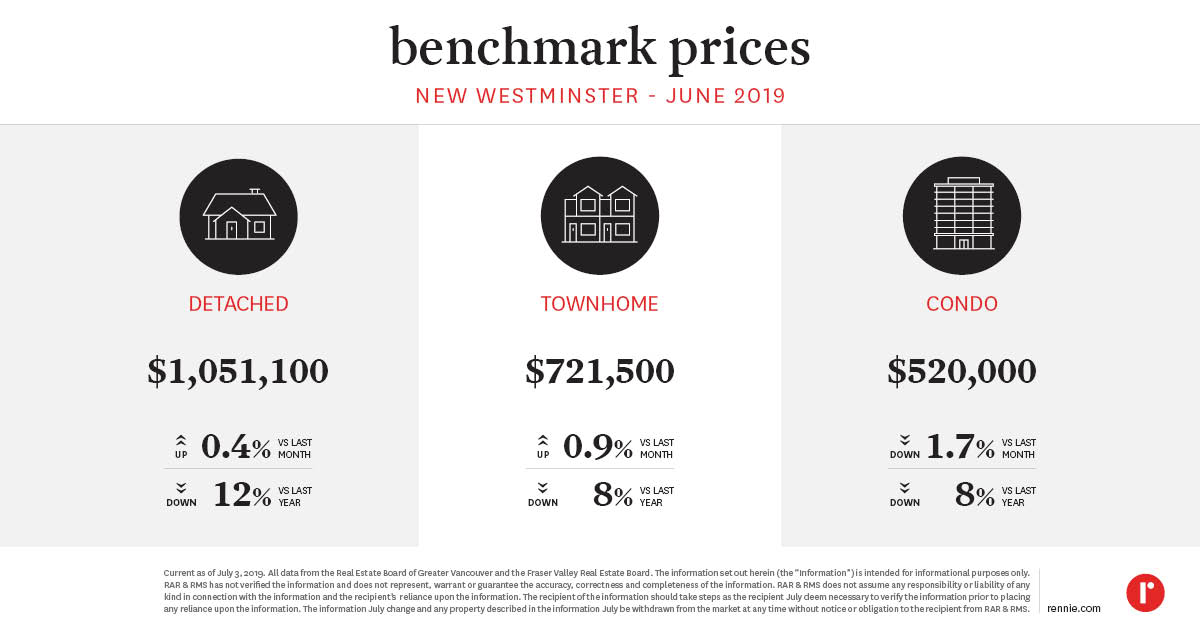 Squamish
 Tsawwassen
 Port Coquitlam
 Port Moody
 Fraser Valley Board Area
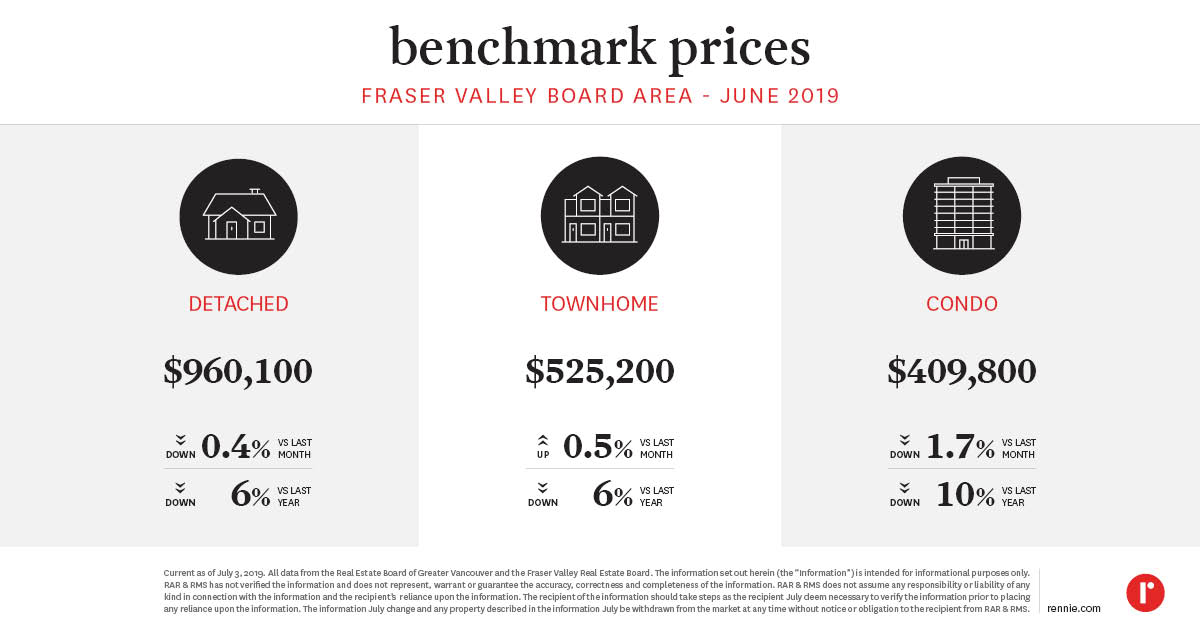 Surrey
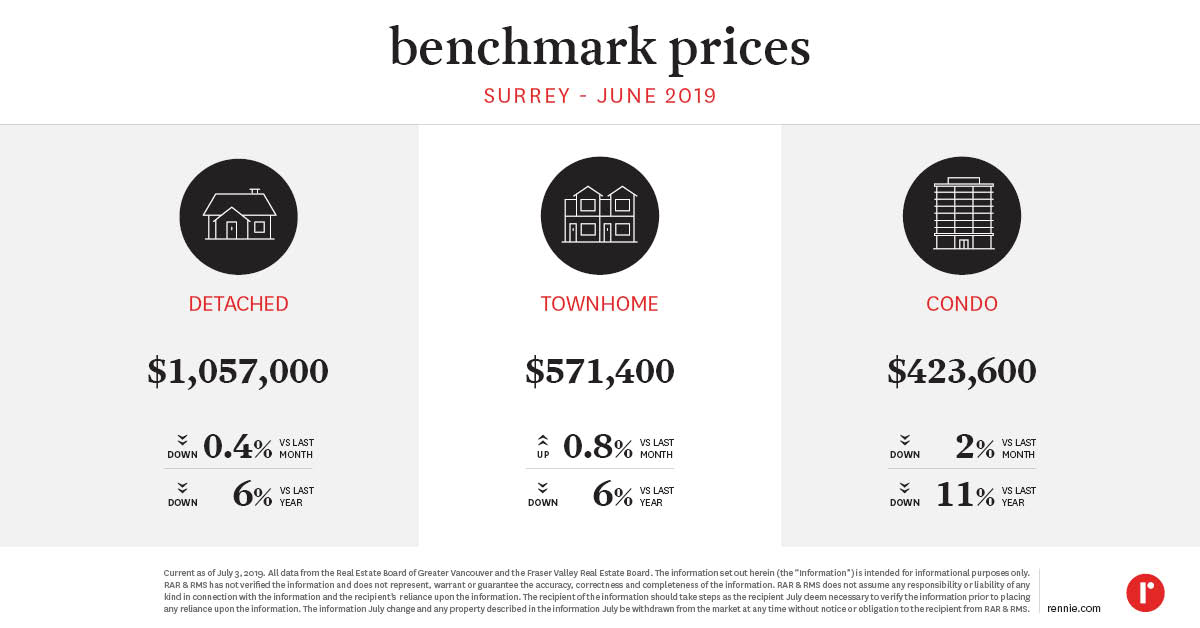 Langley
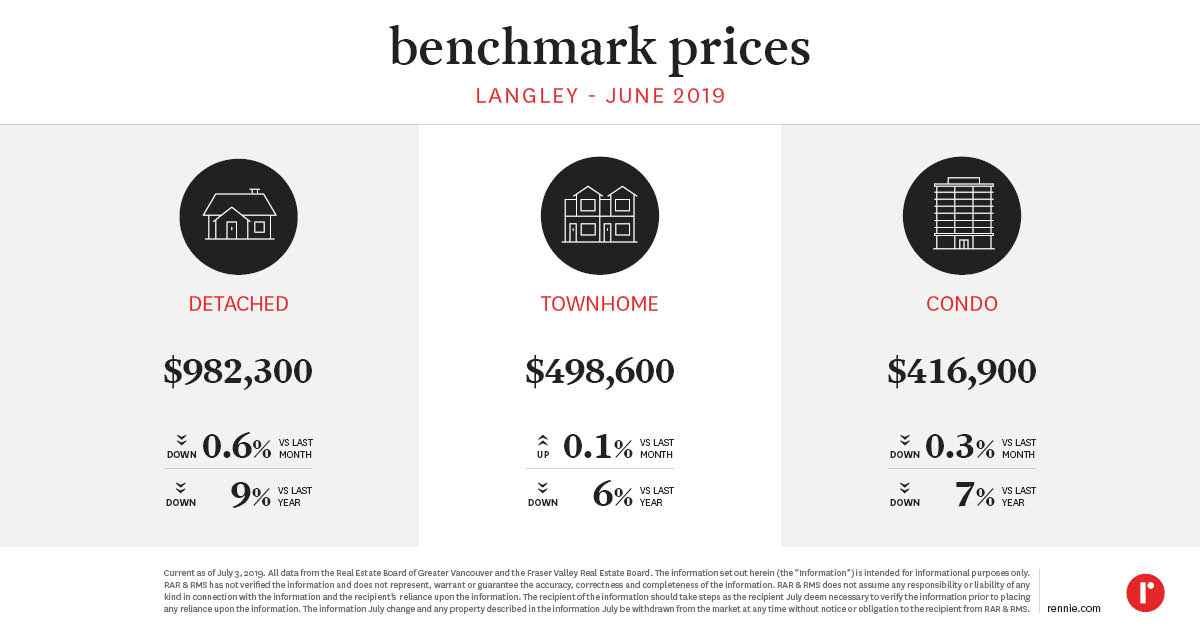 Pitt Meadows
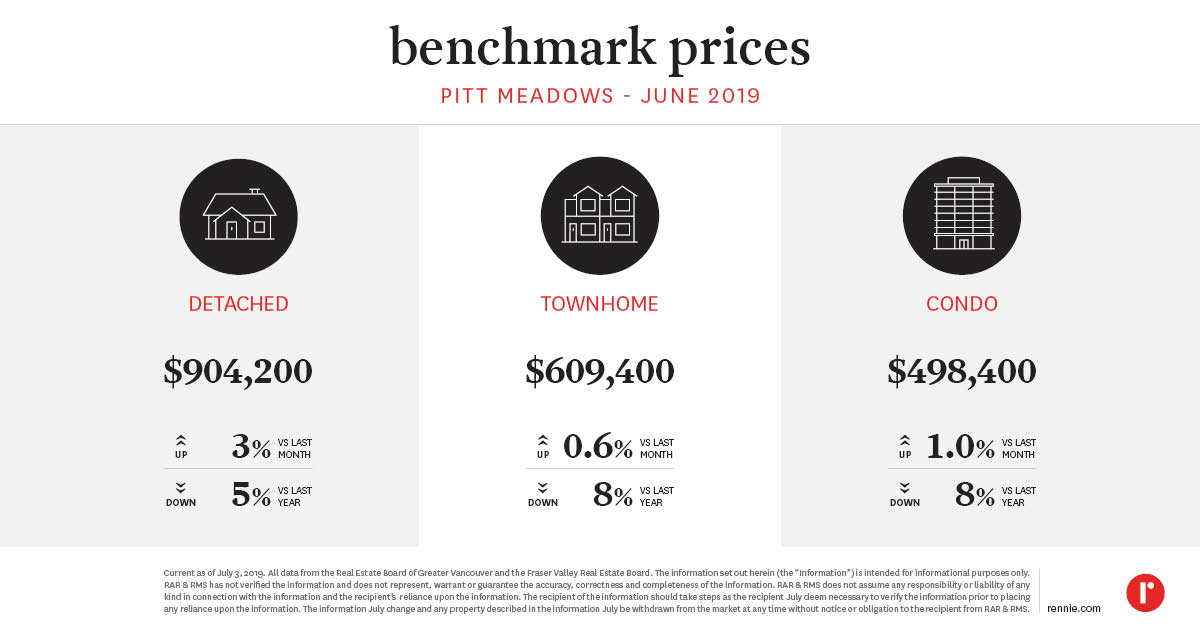 Maple Ridge
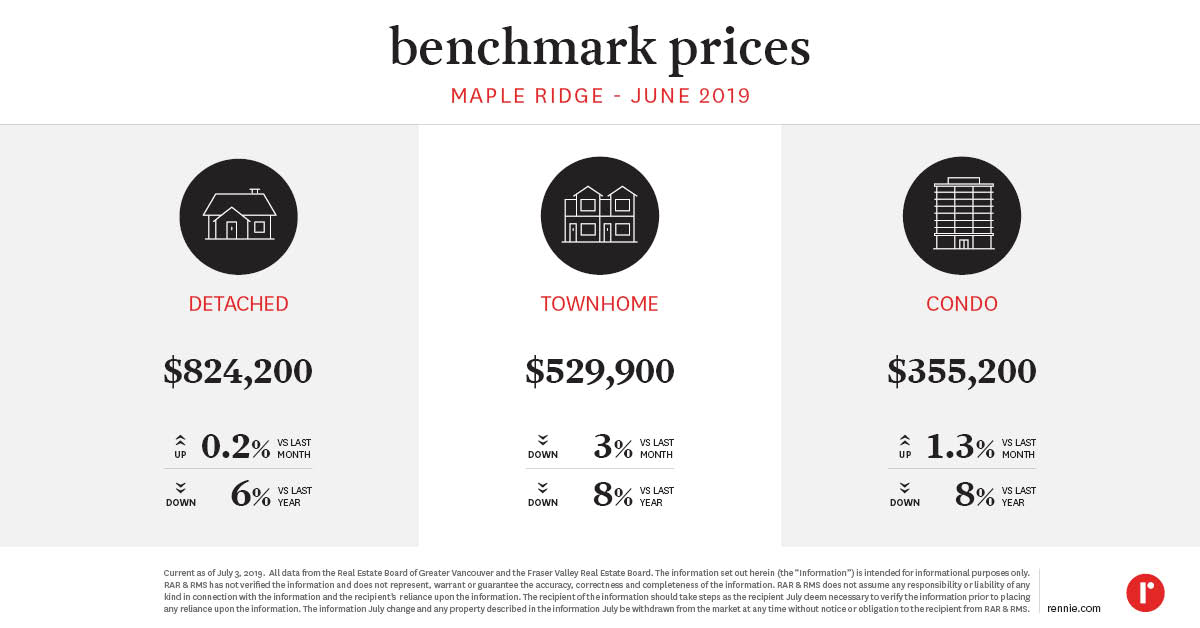 White Rock
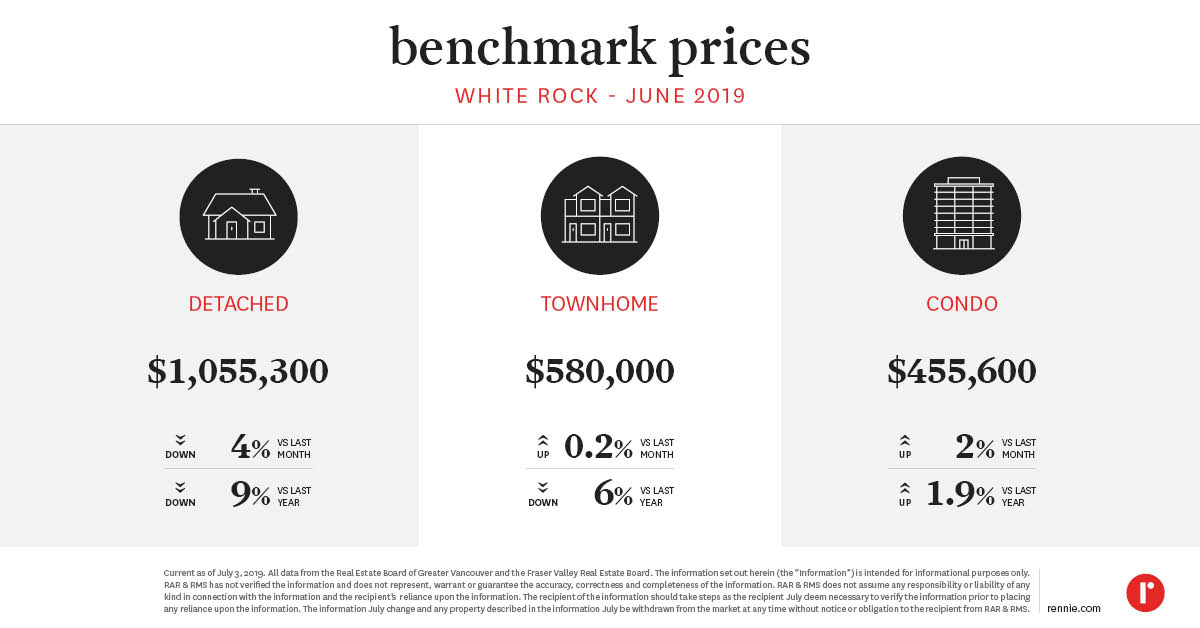 Abbotsford
 Chilliwack and District Board Area
Burnaby EastBurnaby NorthBurnaby SouthCoquitlamNorth VancouverRichmondVancouver EastVancouver WestWest VancouverNew WestminsterSquamishTsawwassenPort CoquitlamPort MoodyFraser Valley Board AreaSurreyLangleyPitt MeadowsMaple RidgeWhite RockAbbotsfordChilliwack and District Board Area Note, the Chilliwack and District Board Area (CADREB) denotes the Median Sales Price rather than the Benchmark Price. The CADREB does not have a benchmark price available for record.
Written by
Ryan Berlin
Related
the victoria rennie advance | April 2026
Sales in Greater Victoria remained below last year’s level in March, driven entirely by slumping condo deals, resulting in the fewest total transactions for the month since 2014. New listings continued to come to market ahead of last year’s elevated pace, pushing active listings to their highest tally in March since 2015.
Apr 2026
Report
the coachella valley rennie advance | April 2026
While all eyes were on the Indian Wells Open in March, sales in the Coachella Valley also had something to showcase, reaching their highest level for the month since 2022. In contrast, new listings were at their lowest level for the month in available data back to 2014.
Apr 2026
Report