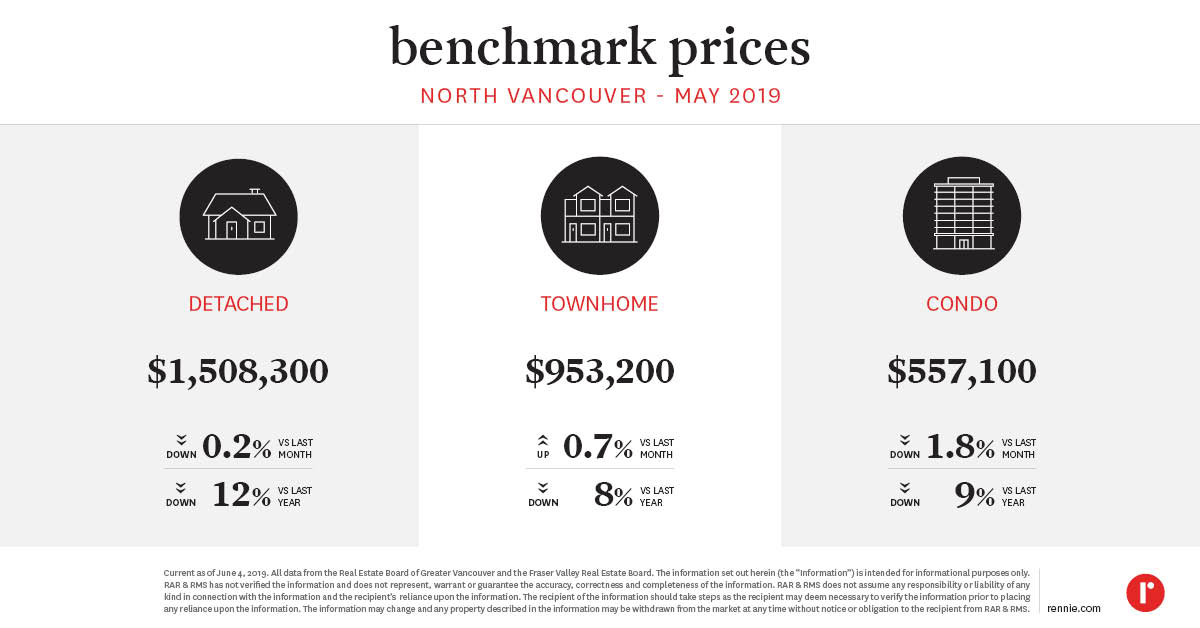
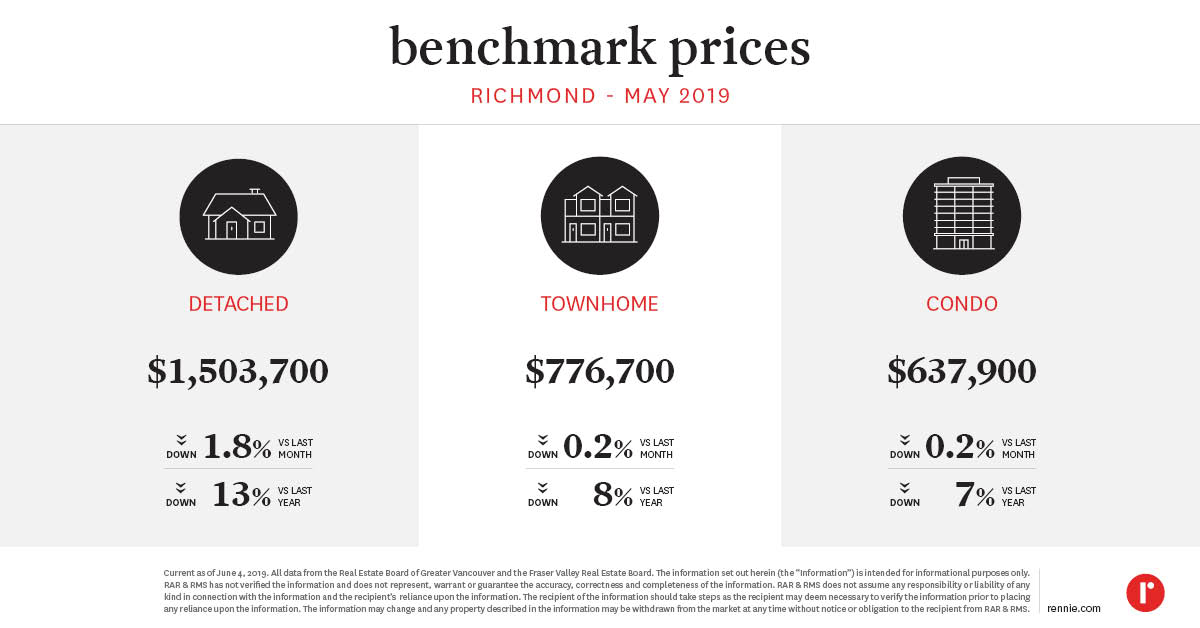
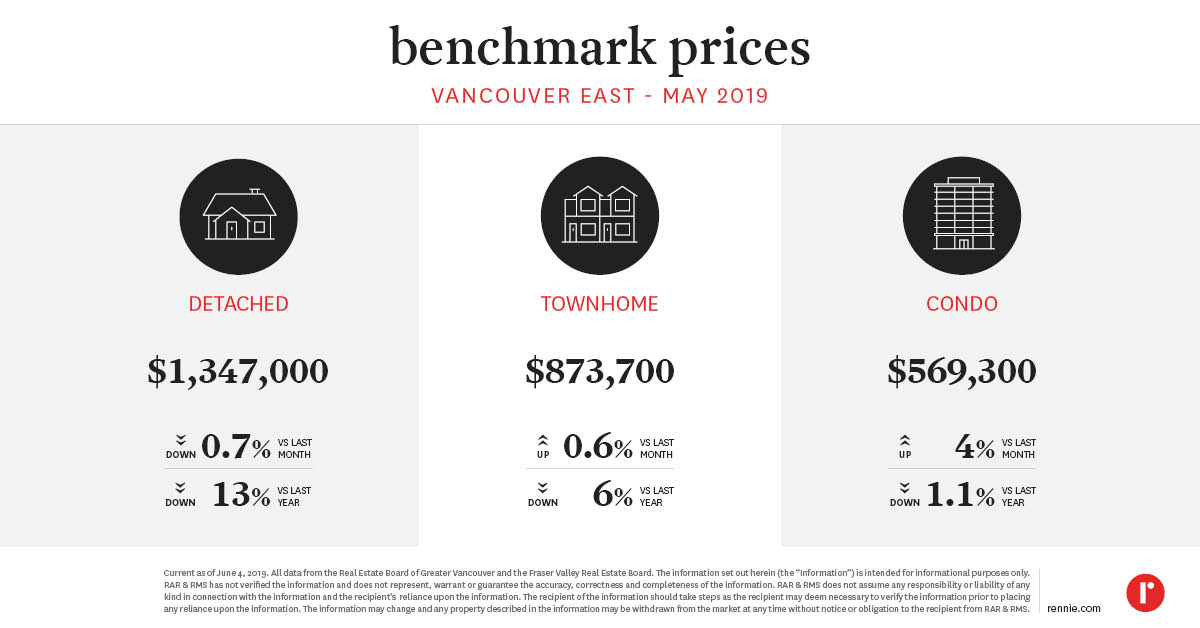
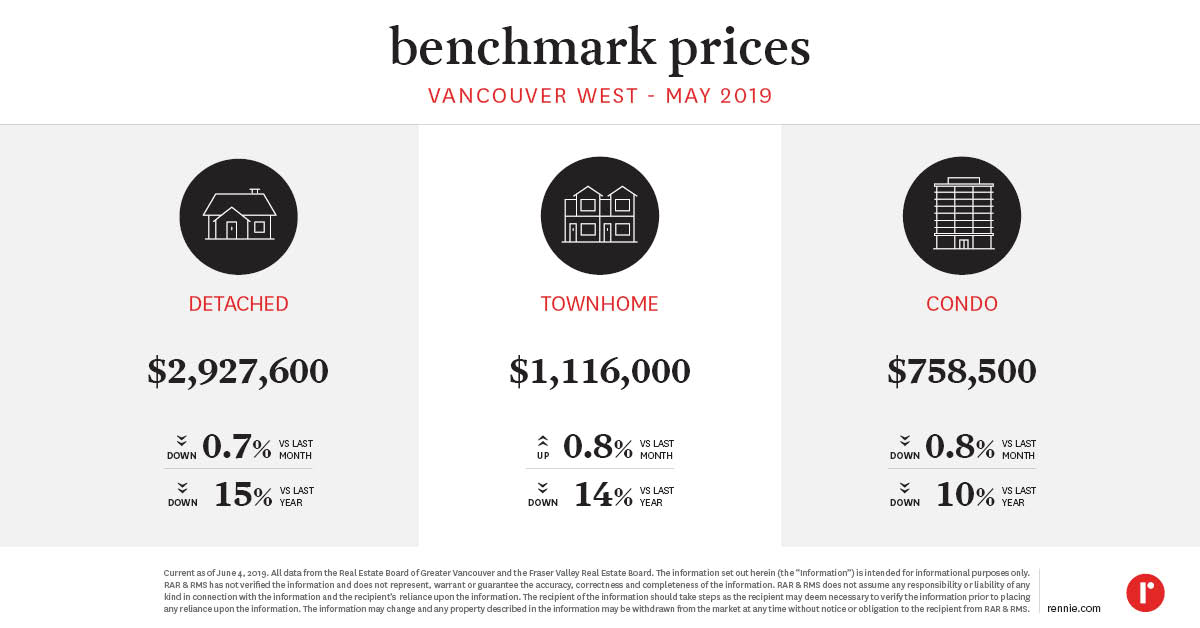
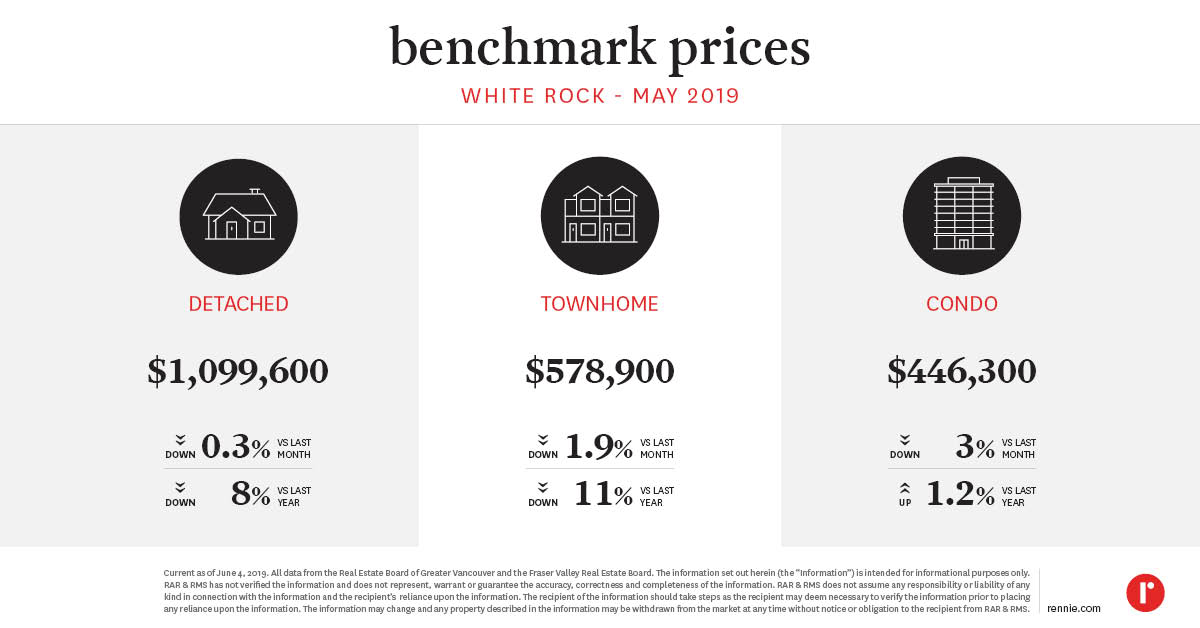
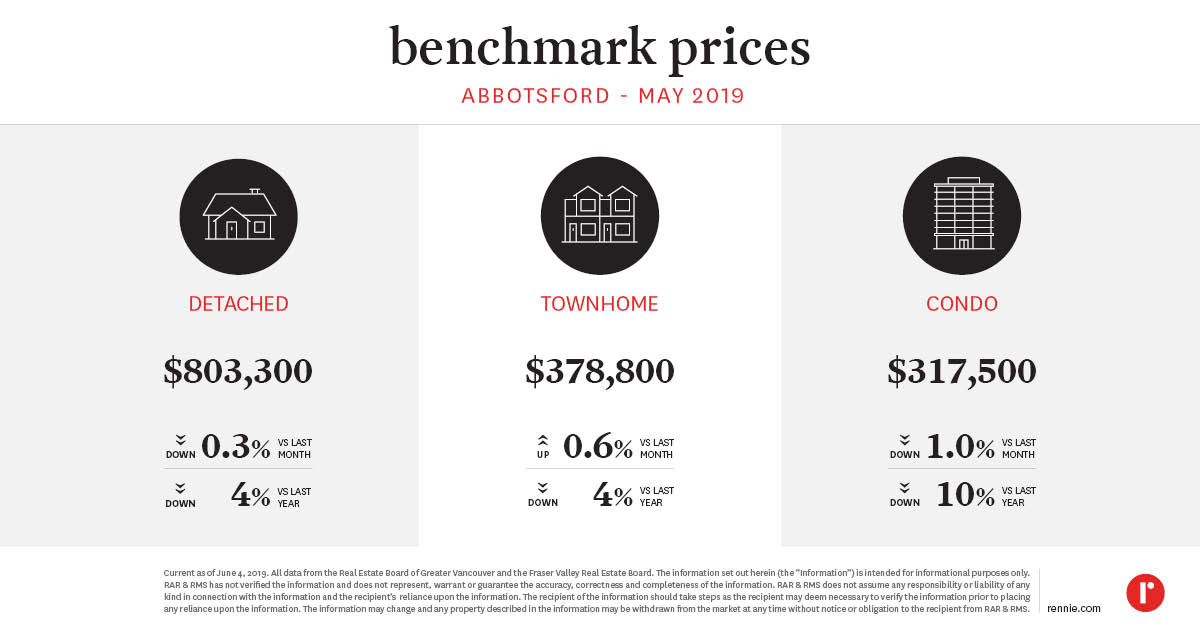
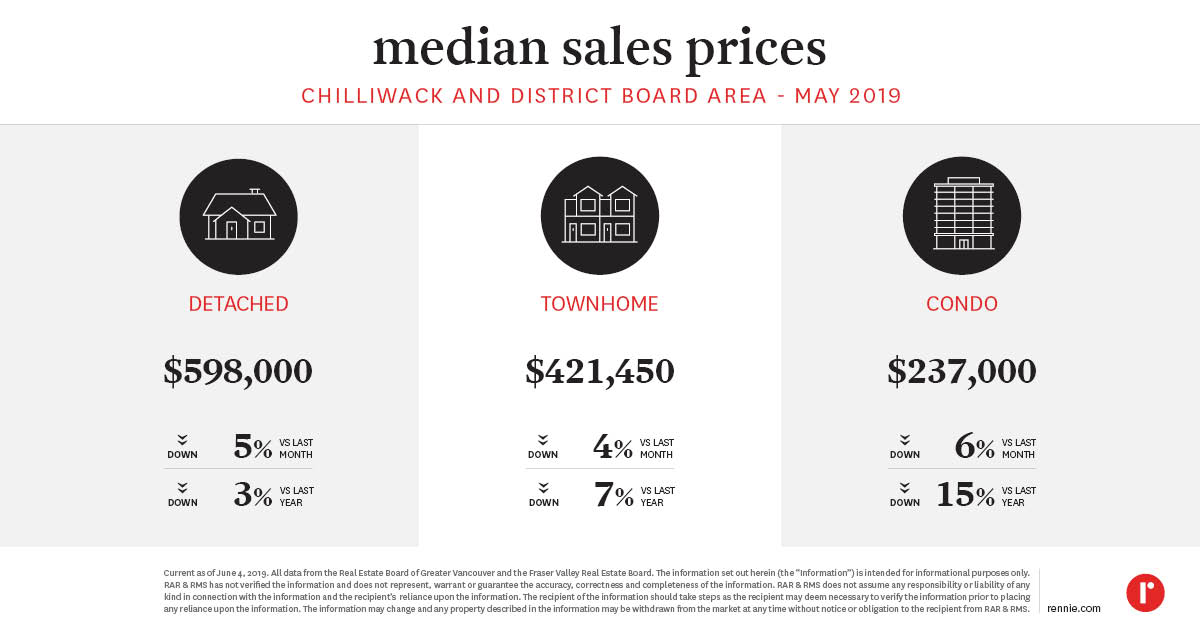
Benchmark Prices - June 2019
Jun 10, 2019
Written by
Ryan BerlinSHARE THIS
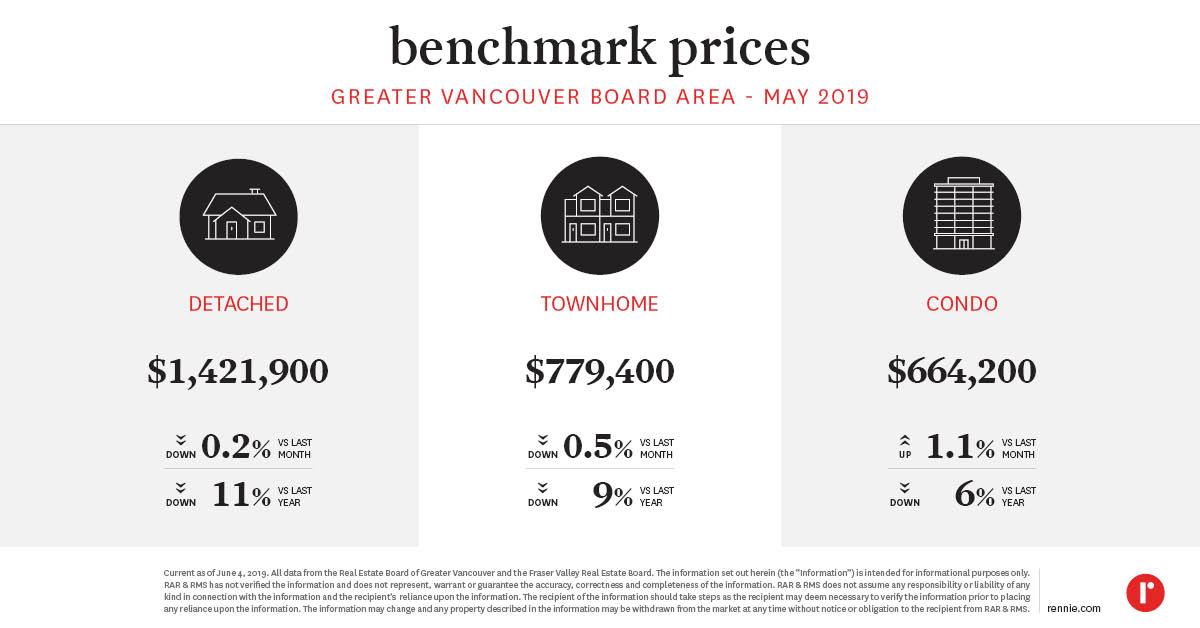
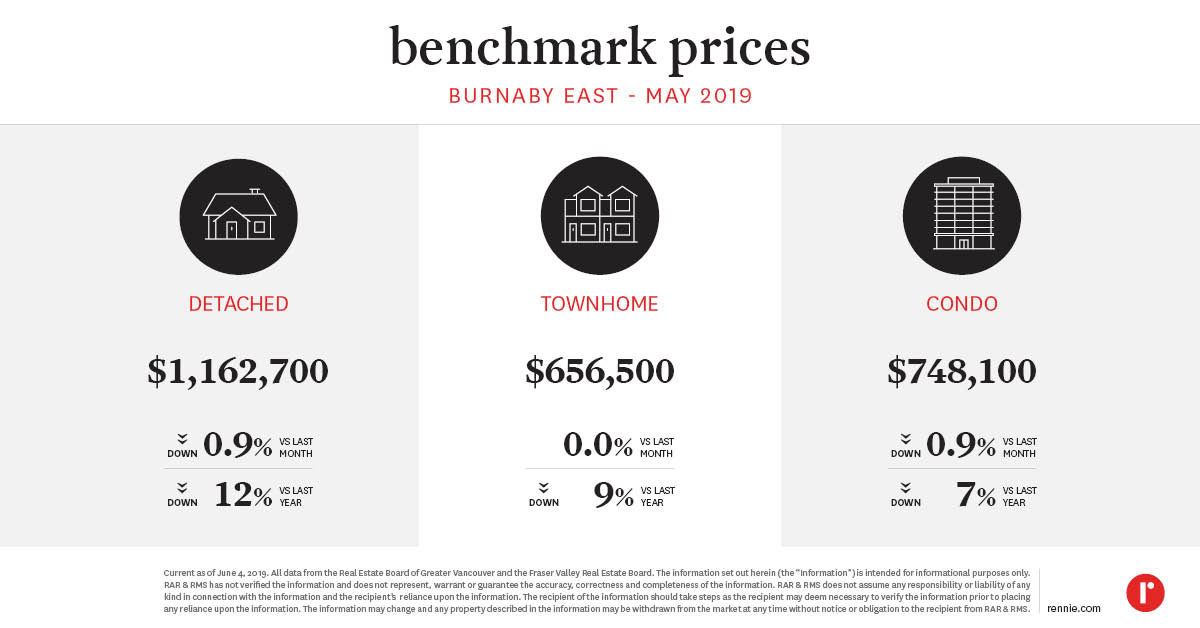
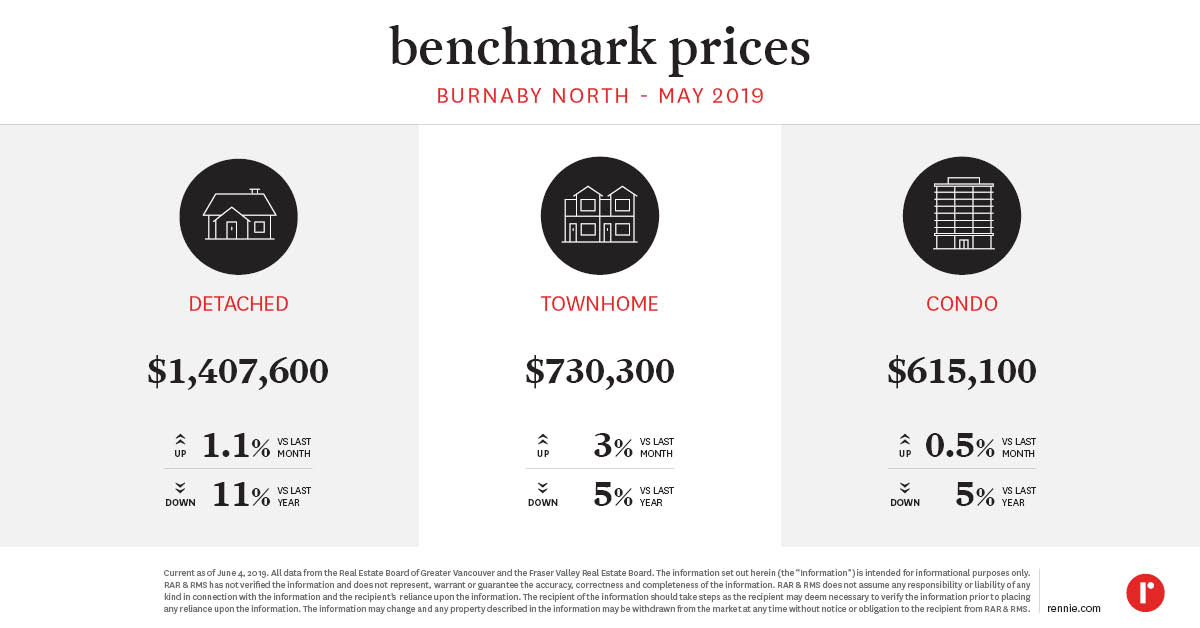
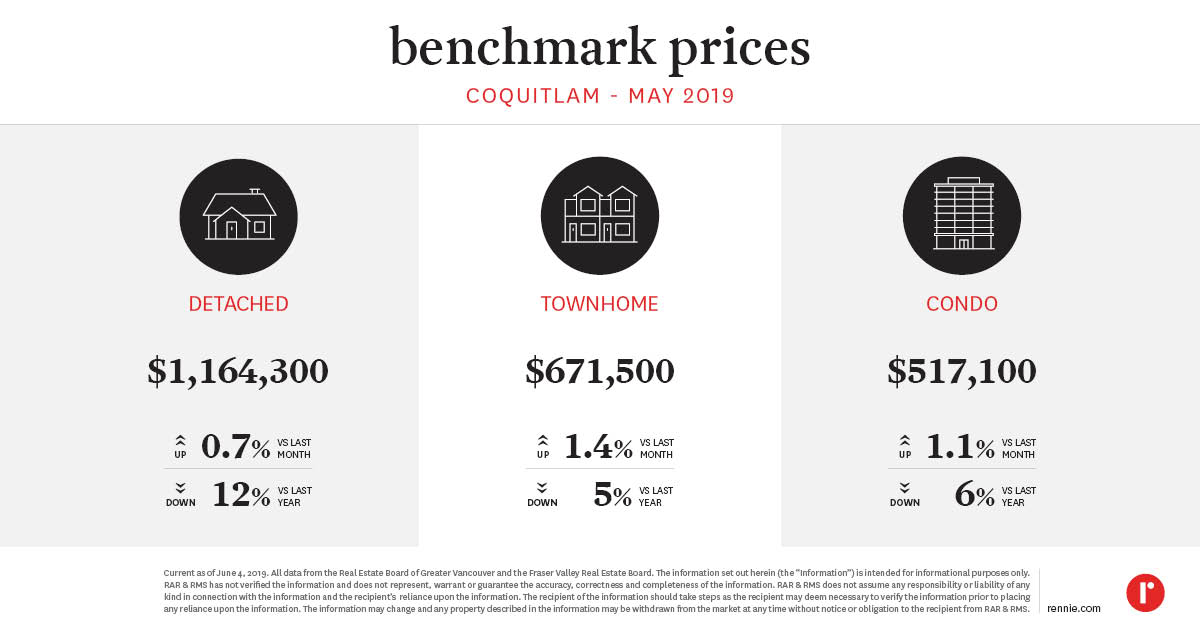
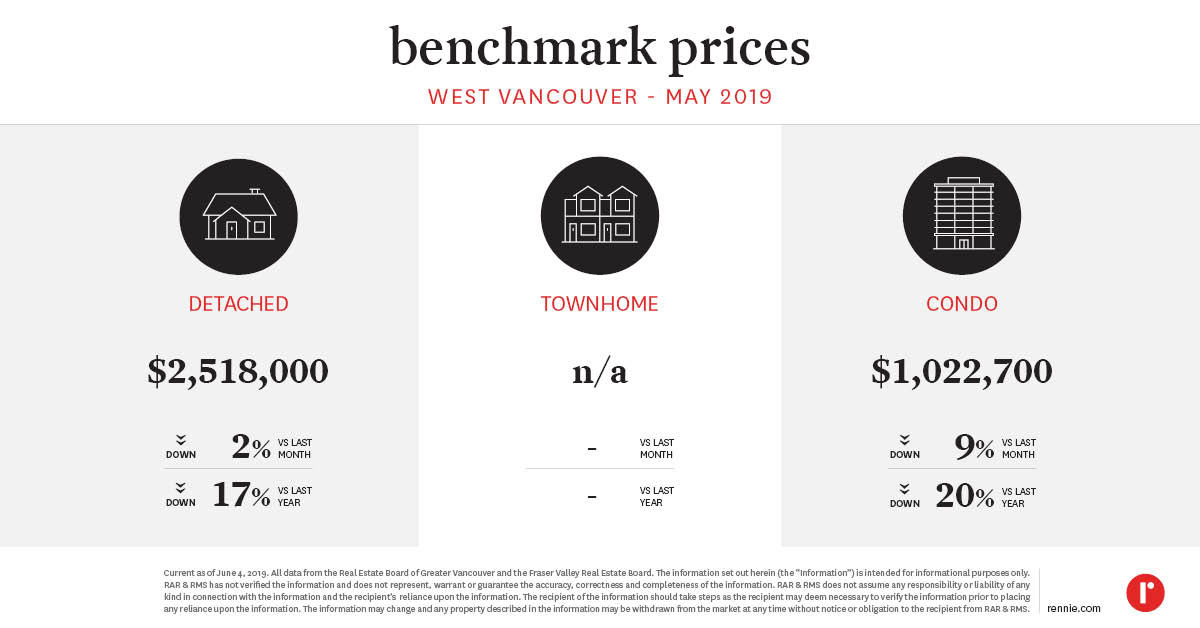
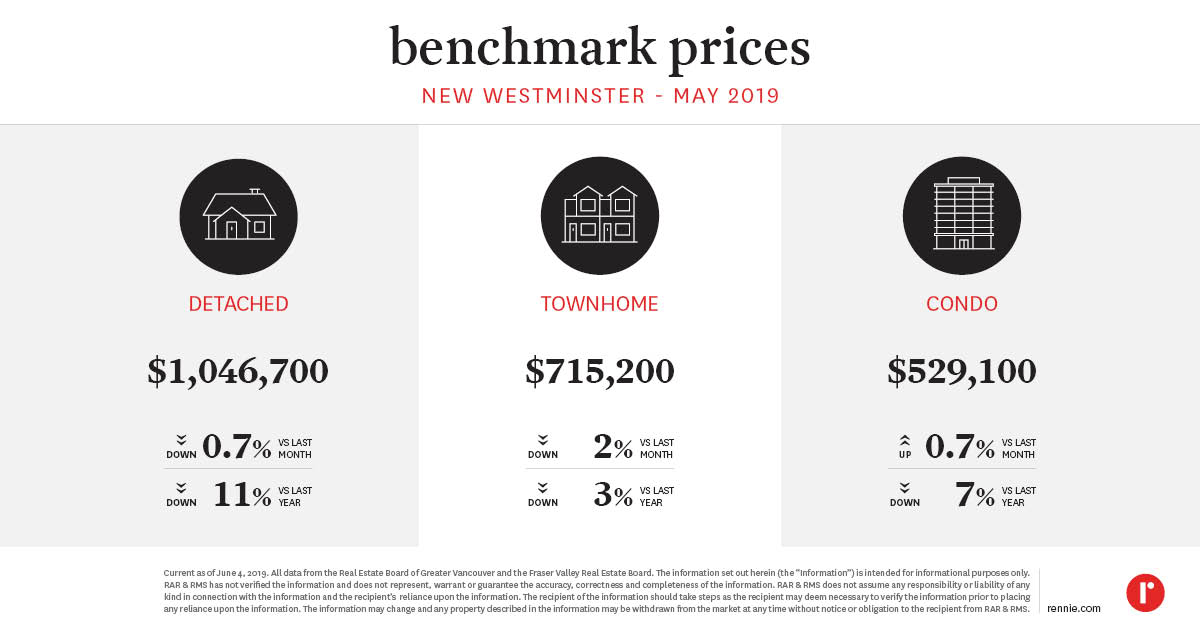
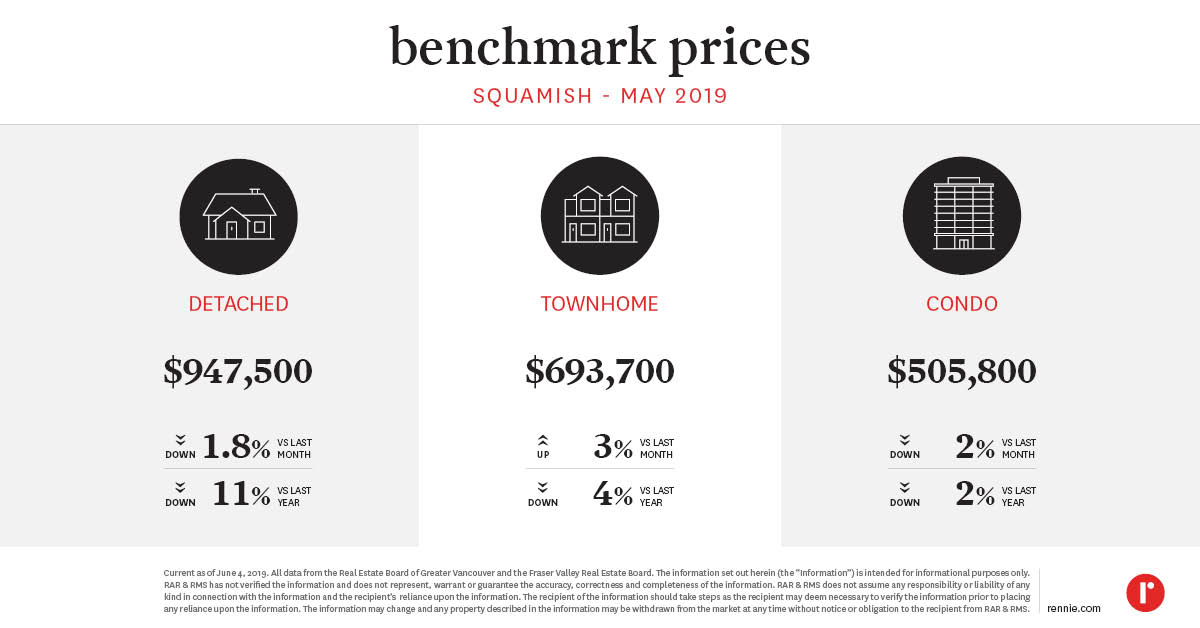
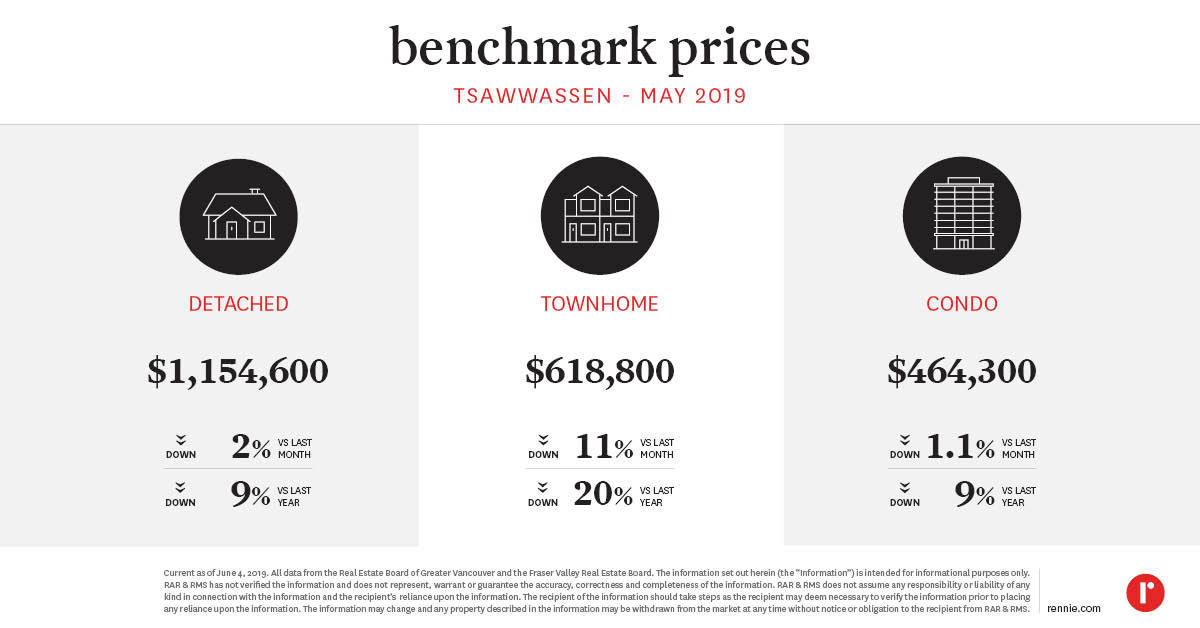
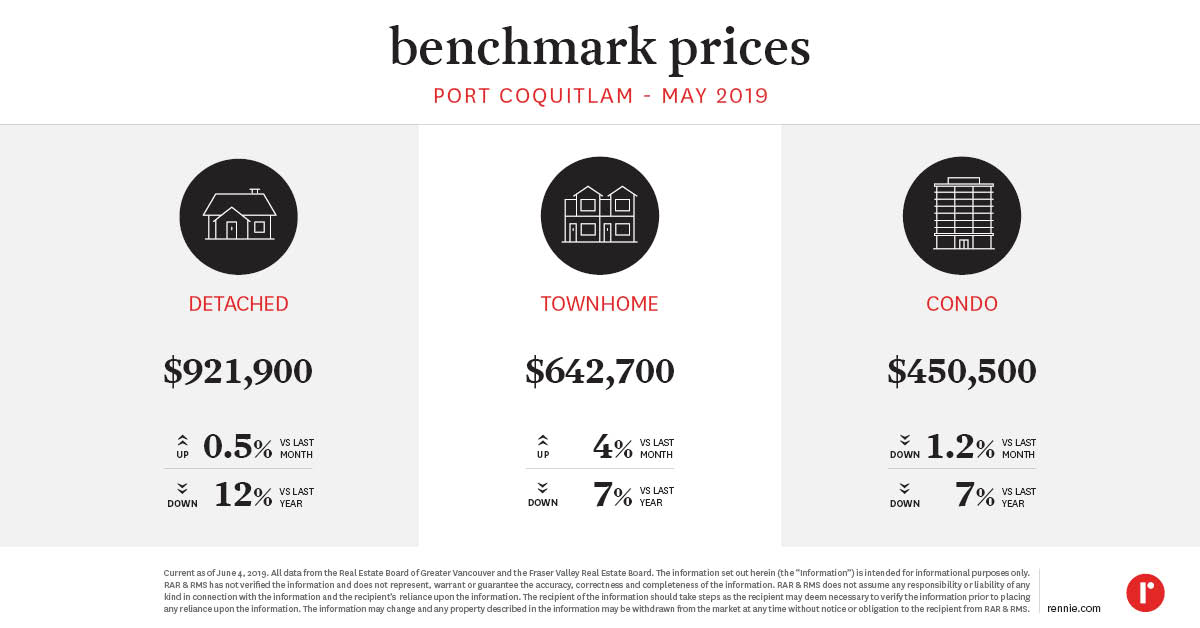
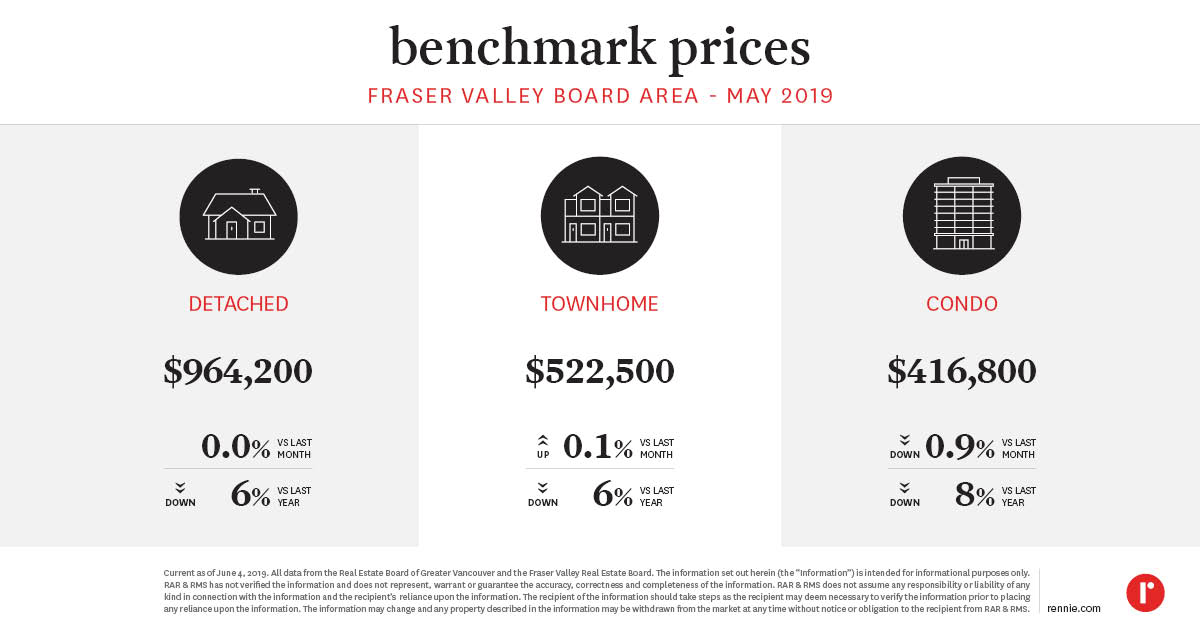
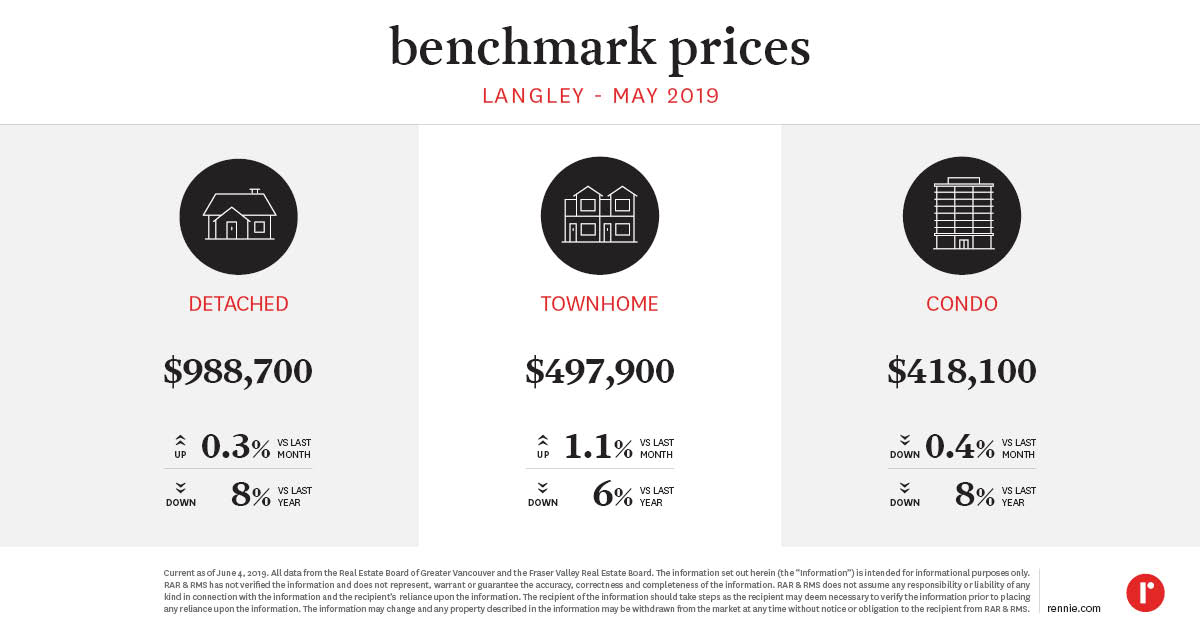
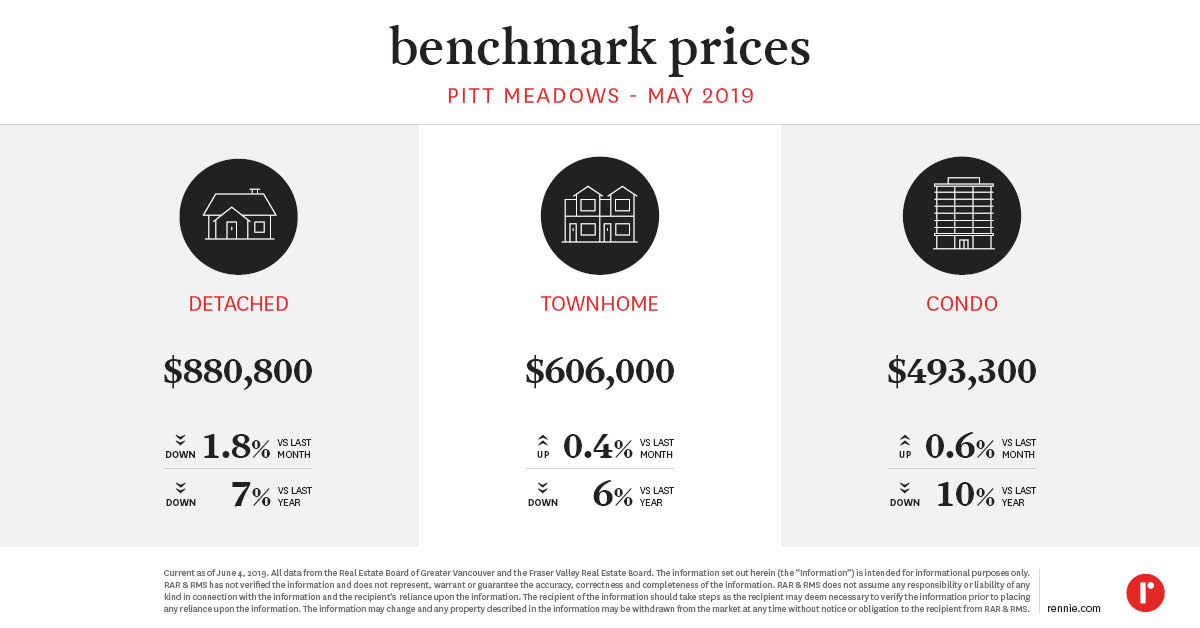
Here are the latest Benchmark Price Infographics for the areas of the Lower Mainland covered in the monthly rennie review. Greater Vancouver Board AreaBurnaby EastBurnaby NorthBurnaby SouthCoquitlamNorth VancouverRichmondVancouver EastVancouver WestWest VancouverNew WestminsterSquamishTsawwassenPort CoquitlamPort MoodyFraser Valley Board AreaSurreyLangleyPitt MeadowsMaple RidgeWhite RockAbbotsfordChilliwack and District Board AreaNote, the Chilliwack and District Board Area (CADREB) denotes the Median Sales Price rather than the Benchmark Price. The CADREB does not have a benchmark price available for record.See Benchmark Prices Infographics for May 2019 here. Our rennie intelligence team comprises our in-house demographer, senior economist, and market analysts. Together, they empower individuals, organizations, and institutions with data-driven market insight and analysis. Experts in urban land economics, community planning, shifting demographics, and real estate trends, their strategic research supports a comprehensive advisory service offering and forms the basis of frequent reports and public presentations. Their thoughtful and objective approach truly embodies the core values of rennie.
Written by
Ryan Berlin
SHARE THIS
Related
the victoria rennie review | April 2024
Greater Victoria’s housing market saw a slow start to spring with the lowest sales count for March in over a decade. Conversely, inventory has grown to its highest level for the month in almost as long.
Apr 2024
Report
the kelowna rennie review | April 2024
Recent trends of lagging sales counts across the Central Okanagan carried on in March. And while overall market conditions continue to favour buyers, pockets of the market remain notably tight - particularly for lower-priced homes.
Apr 2024
Report