Benchmark Prices - May 2022
May 09, 2022
Written by
Ryan BerlinSHARE THIS
Here are the latest Benchmark Price Infographics for the areas of Vancouver region.Greater Vancouver Board Area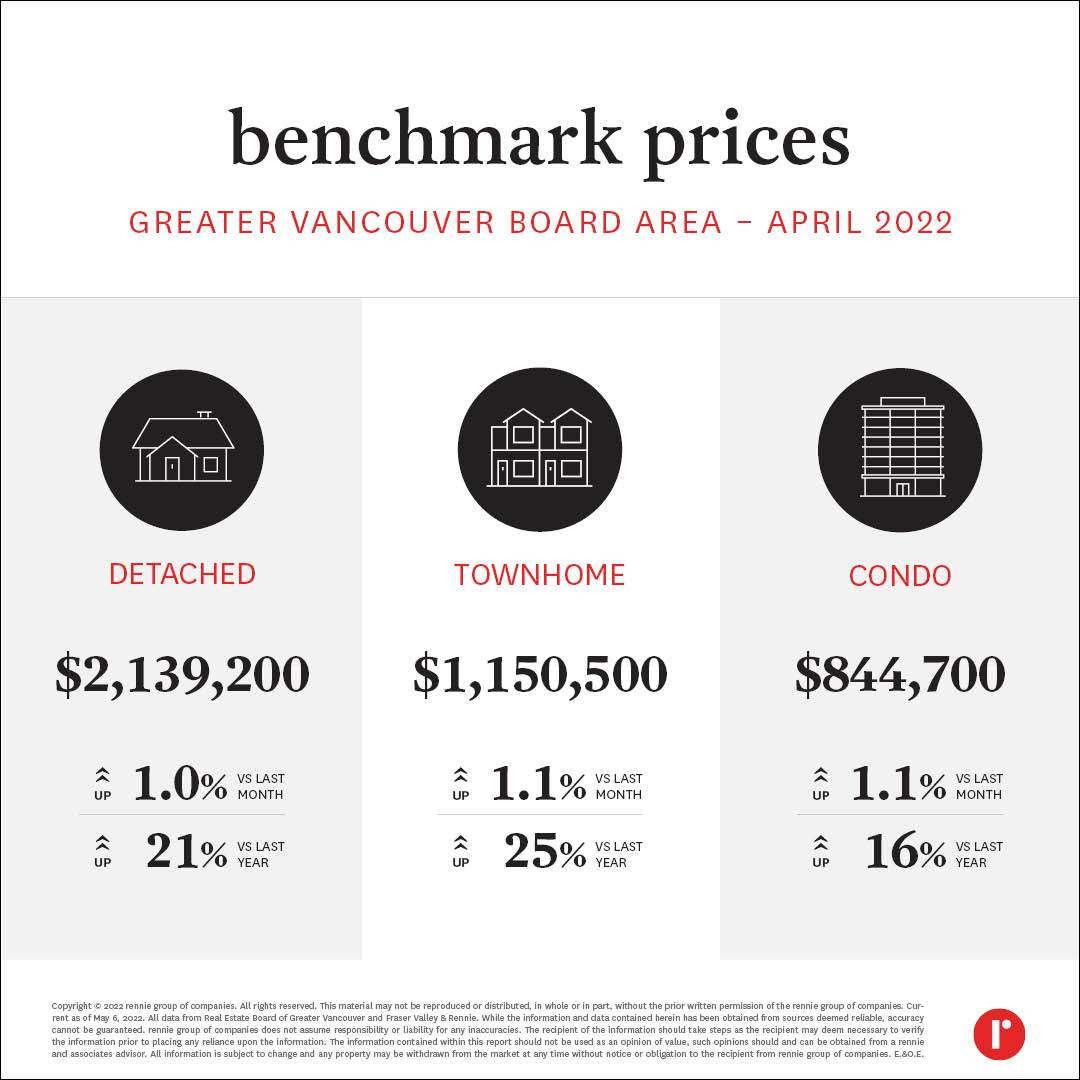 Burnaby East
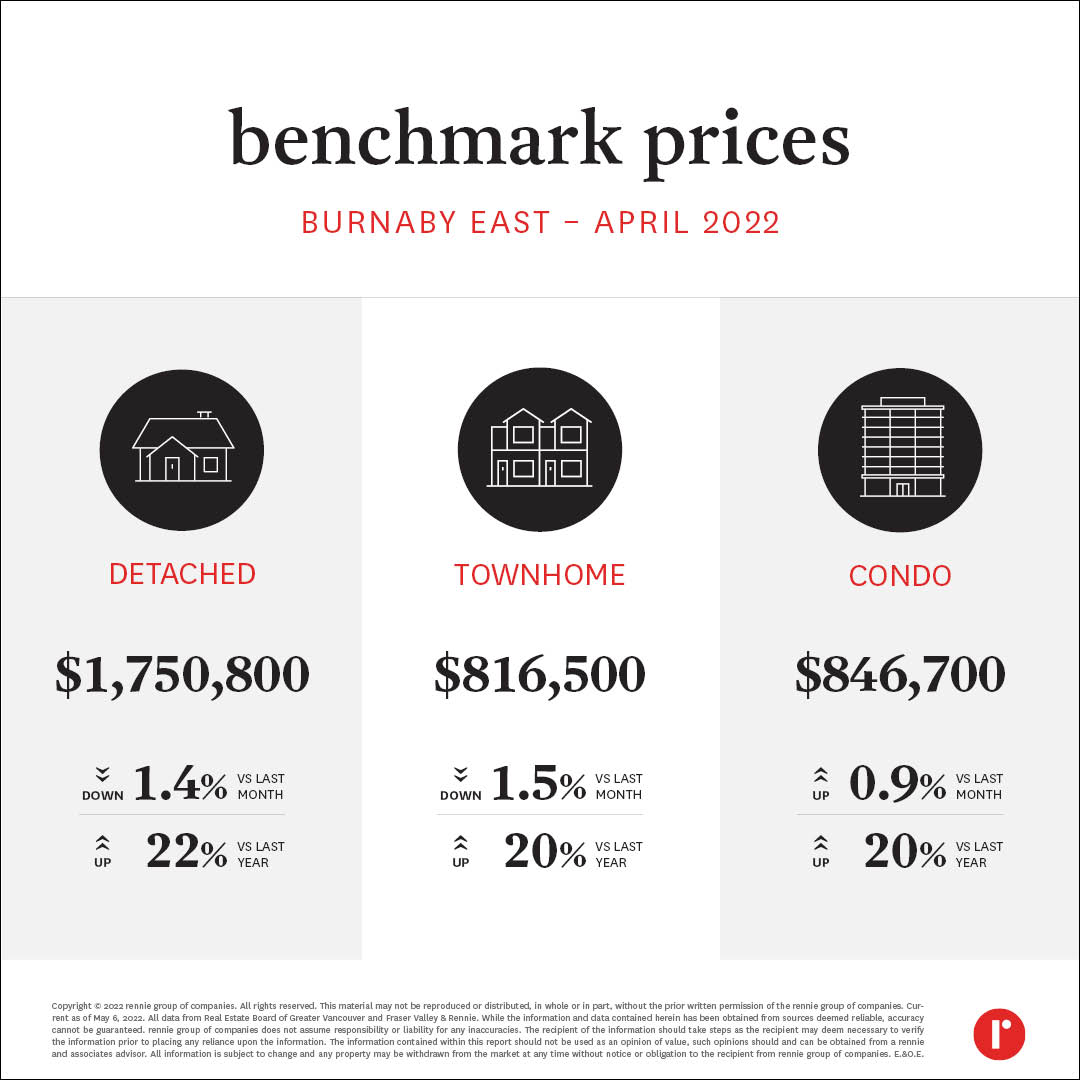 Burnaby North
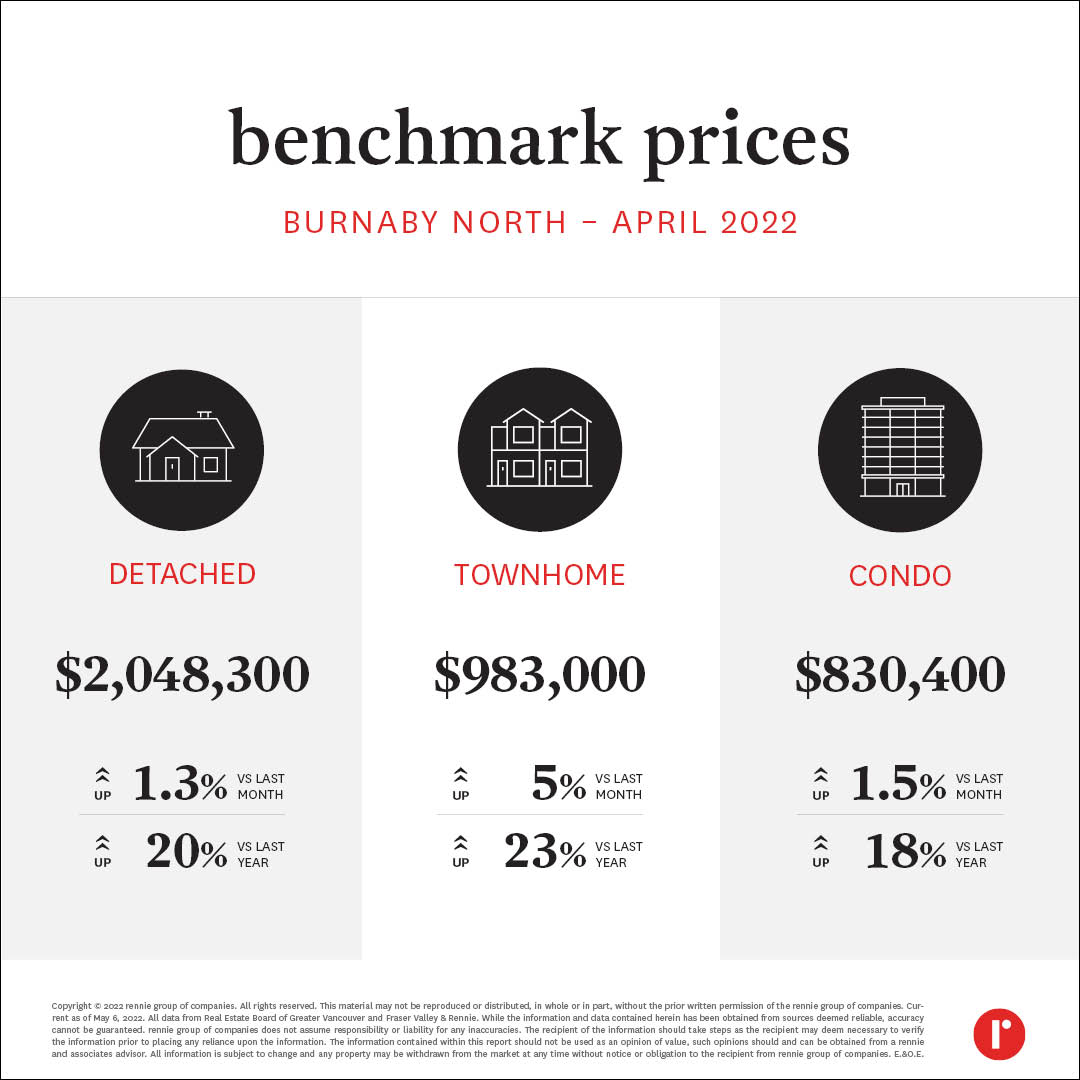 Burnaby South
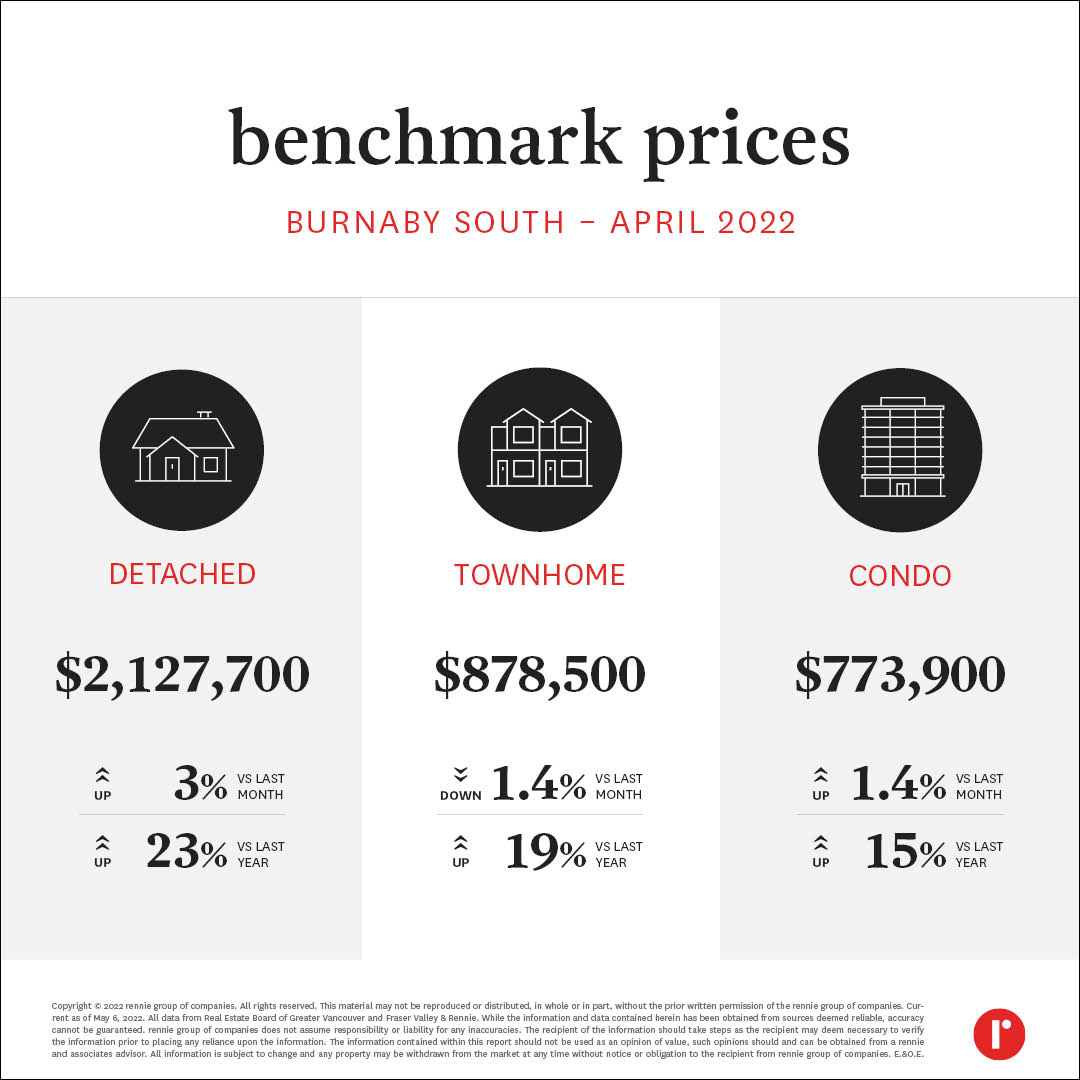 Coquitlam
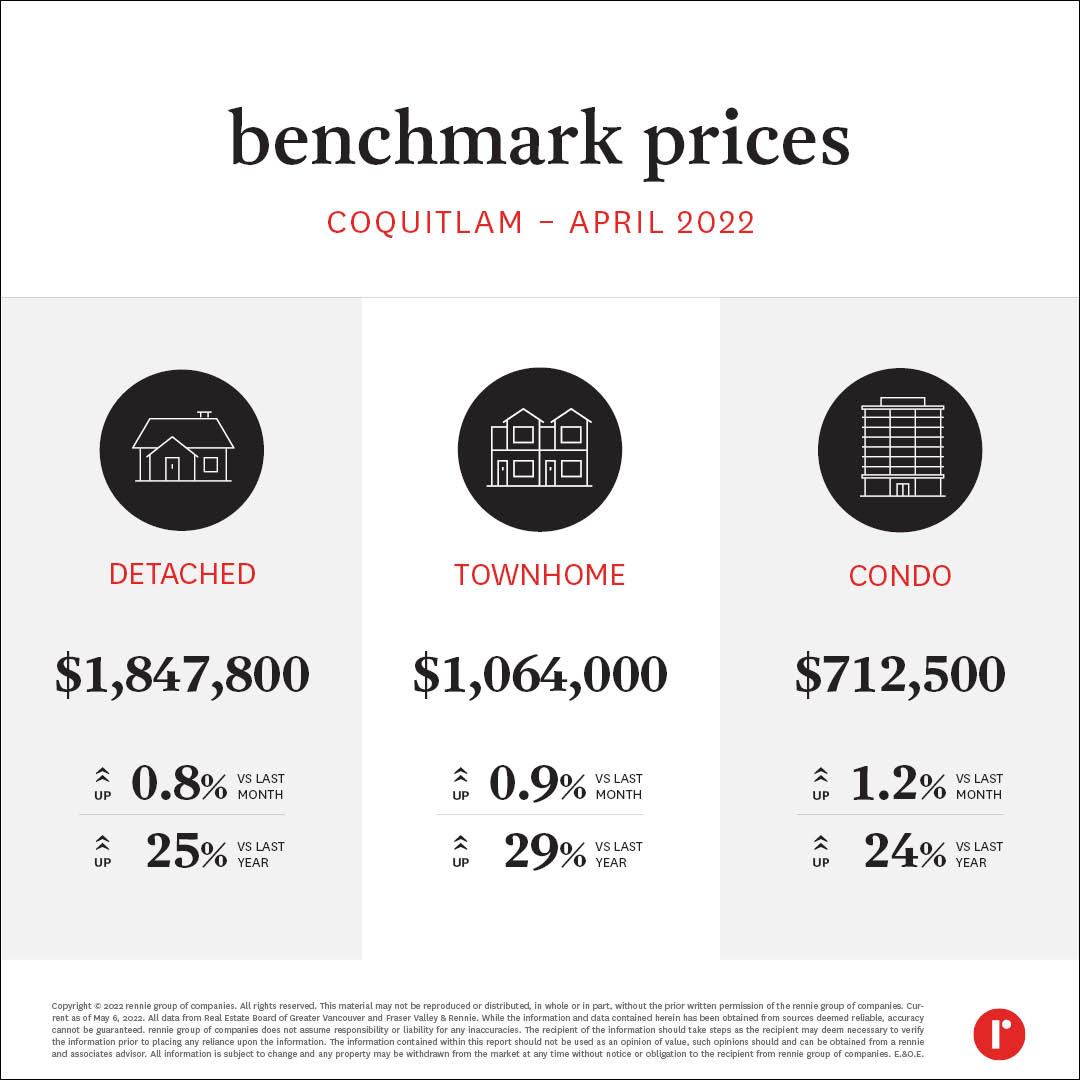 North Vancouver
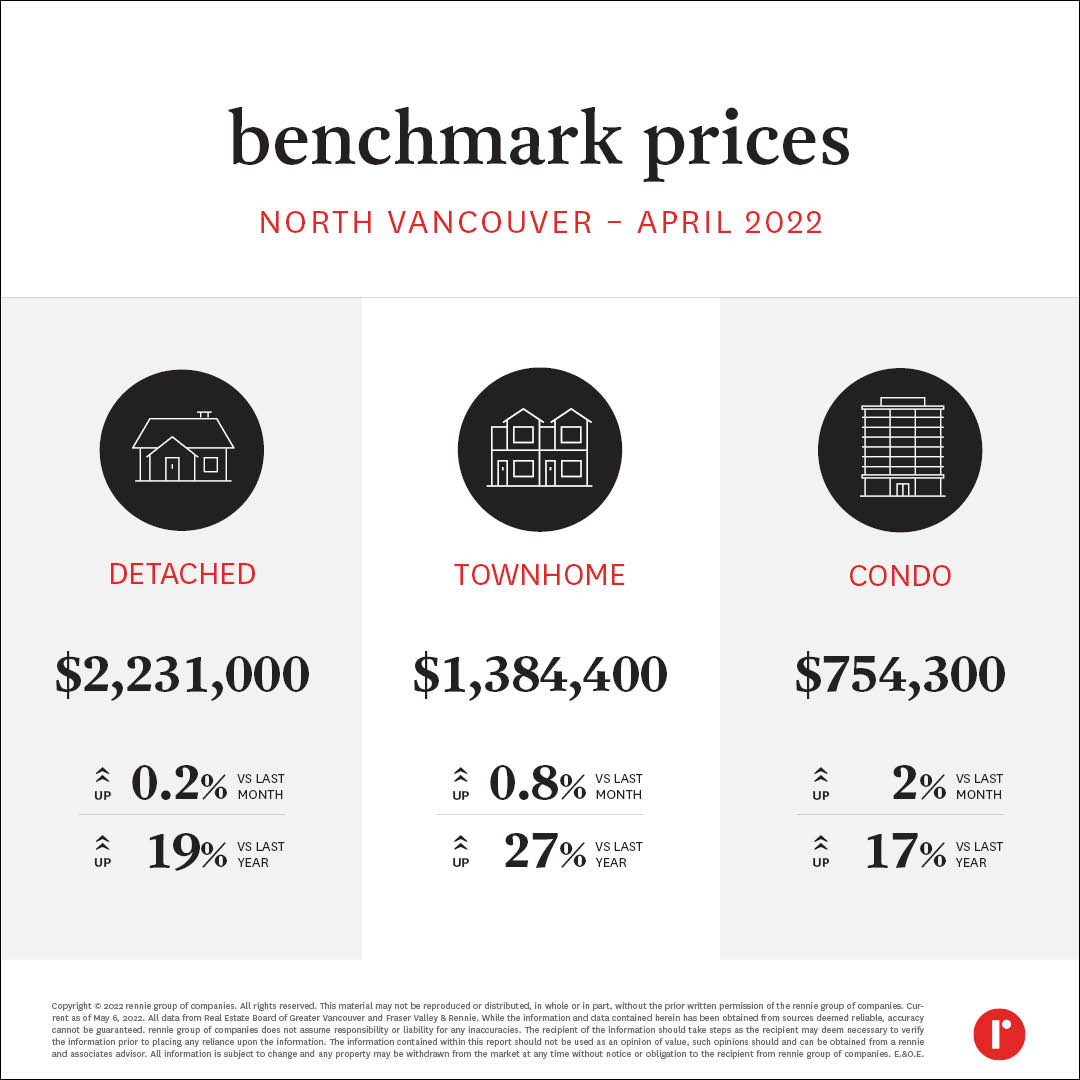 Richmond
 Vancouver East
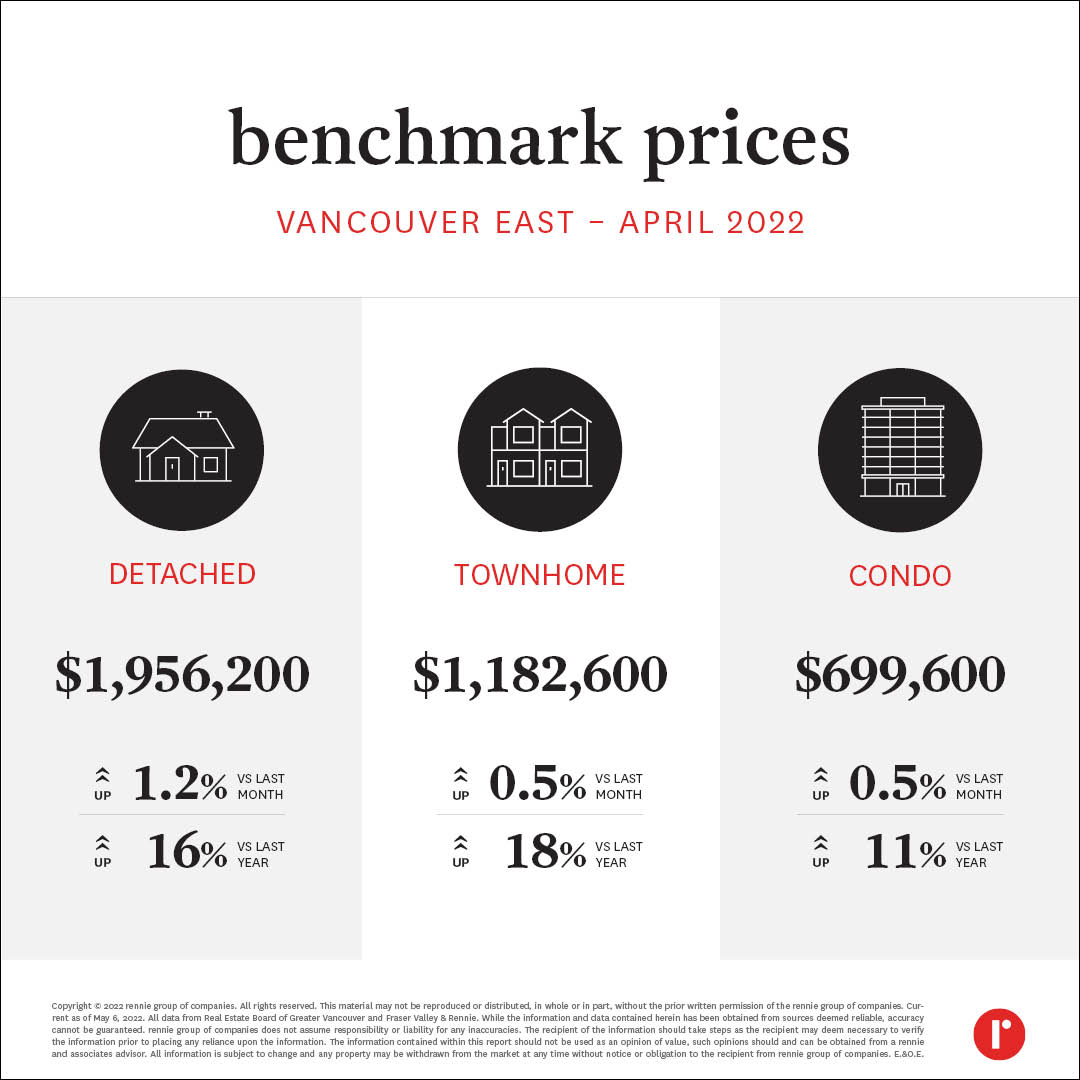 Vancouver West
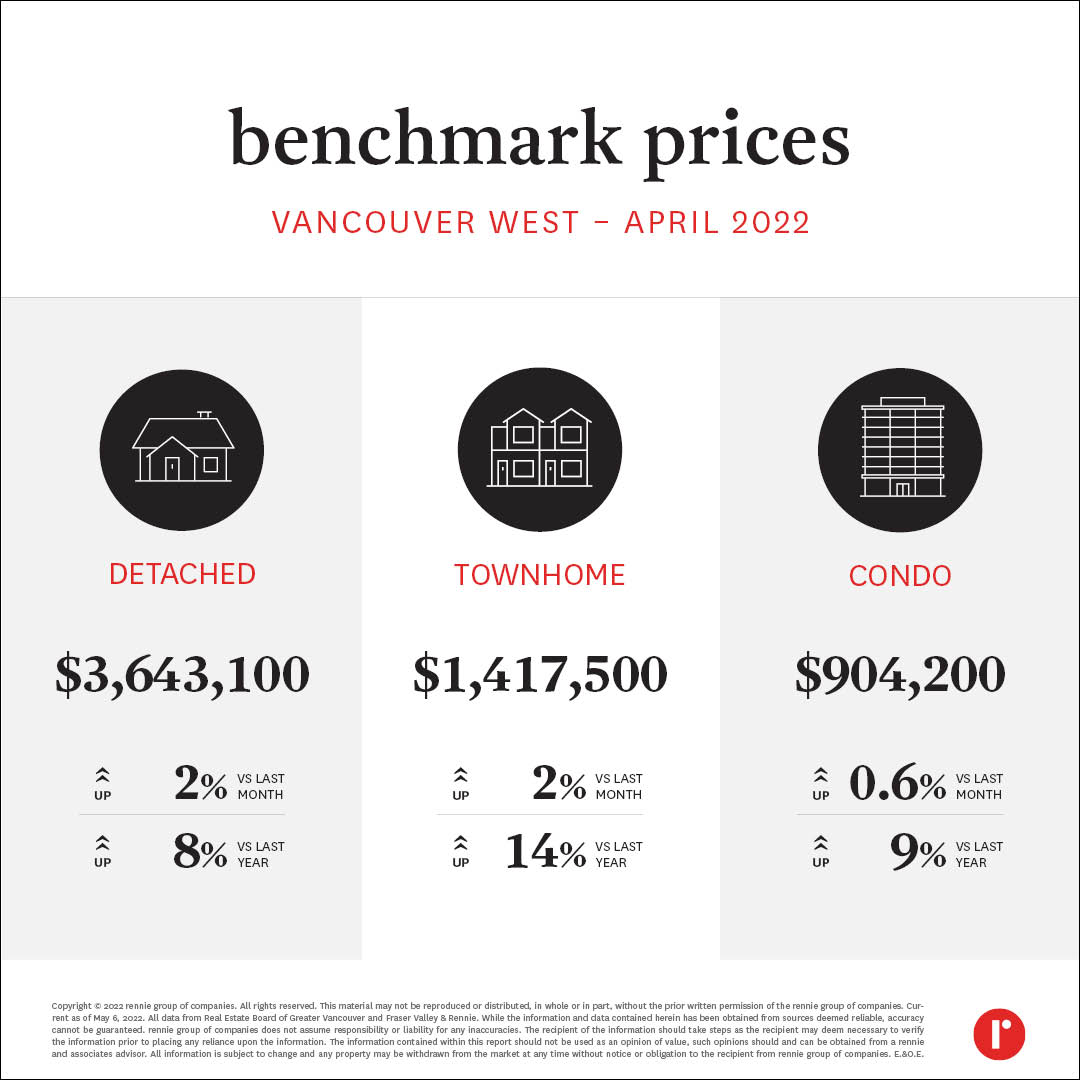 West Vancouver
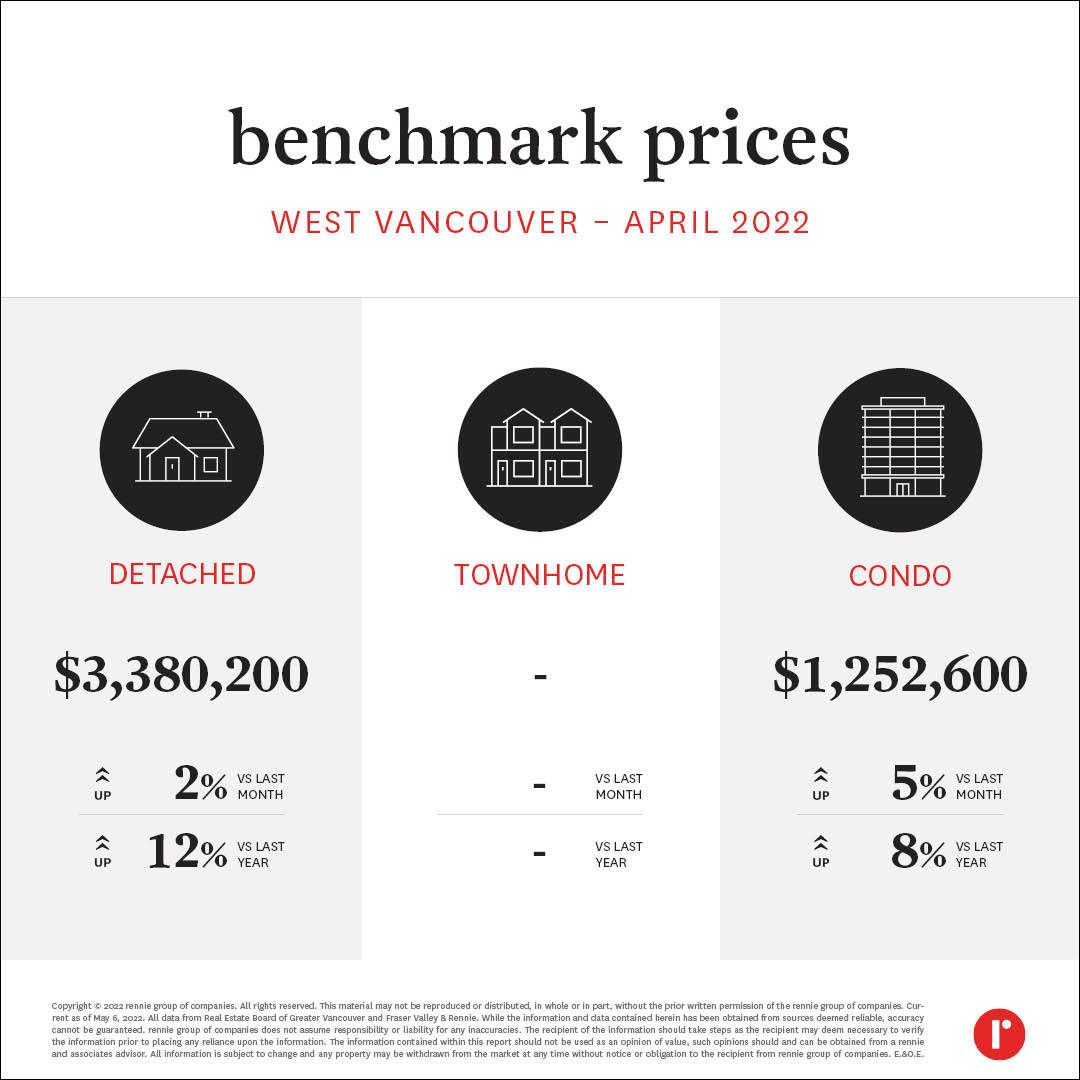 New Westminster
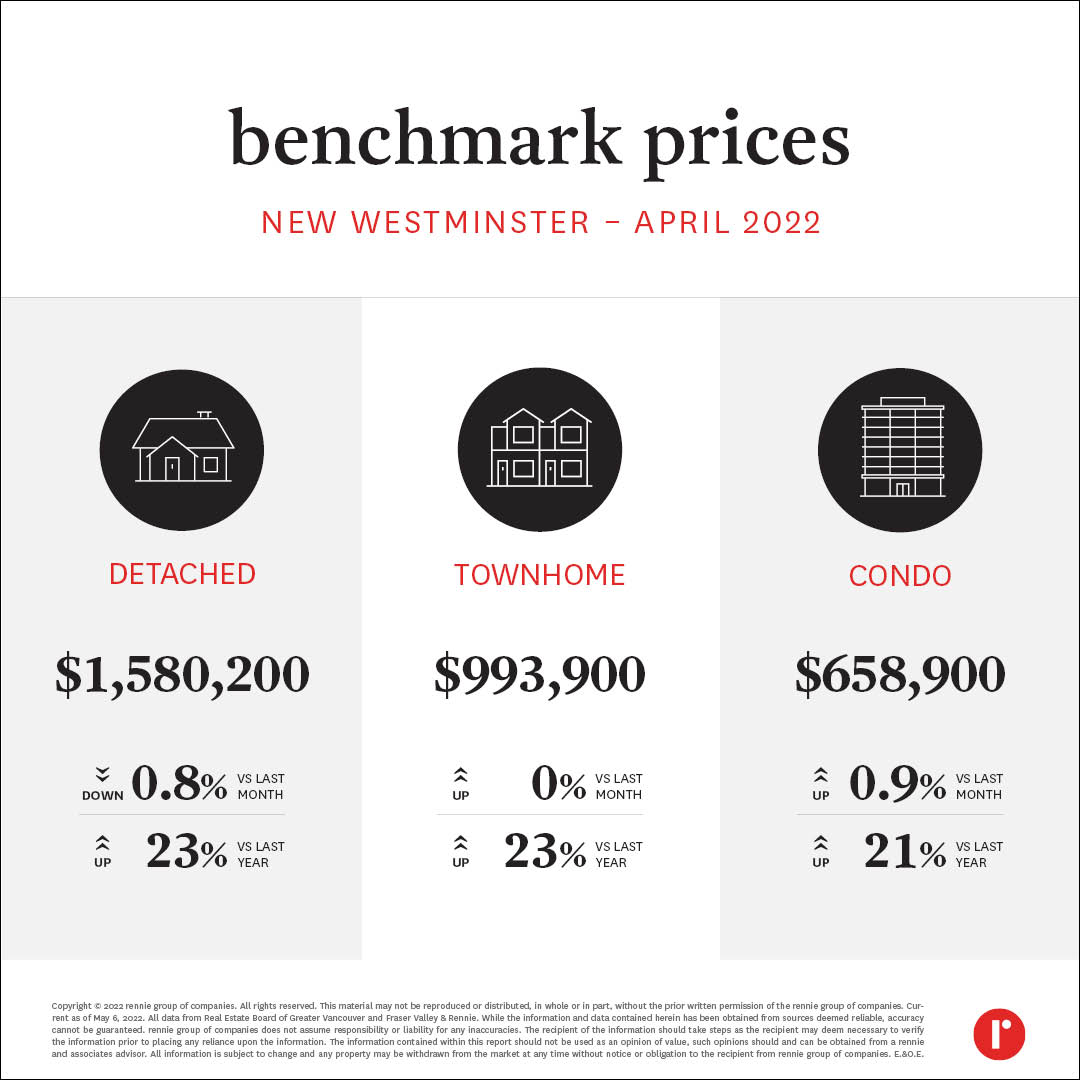 Squamish
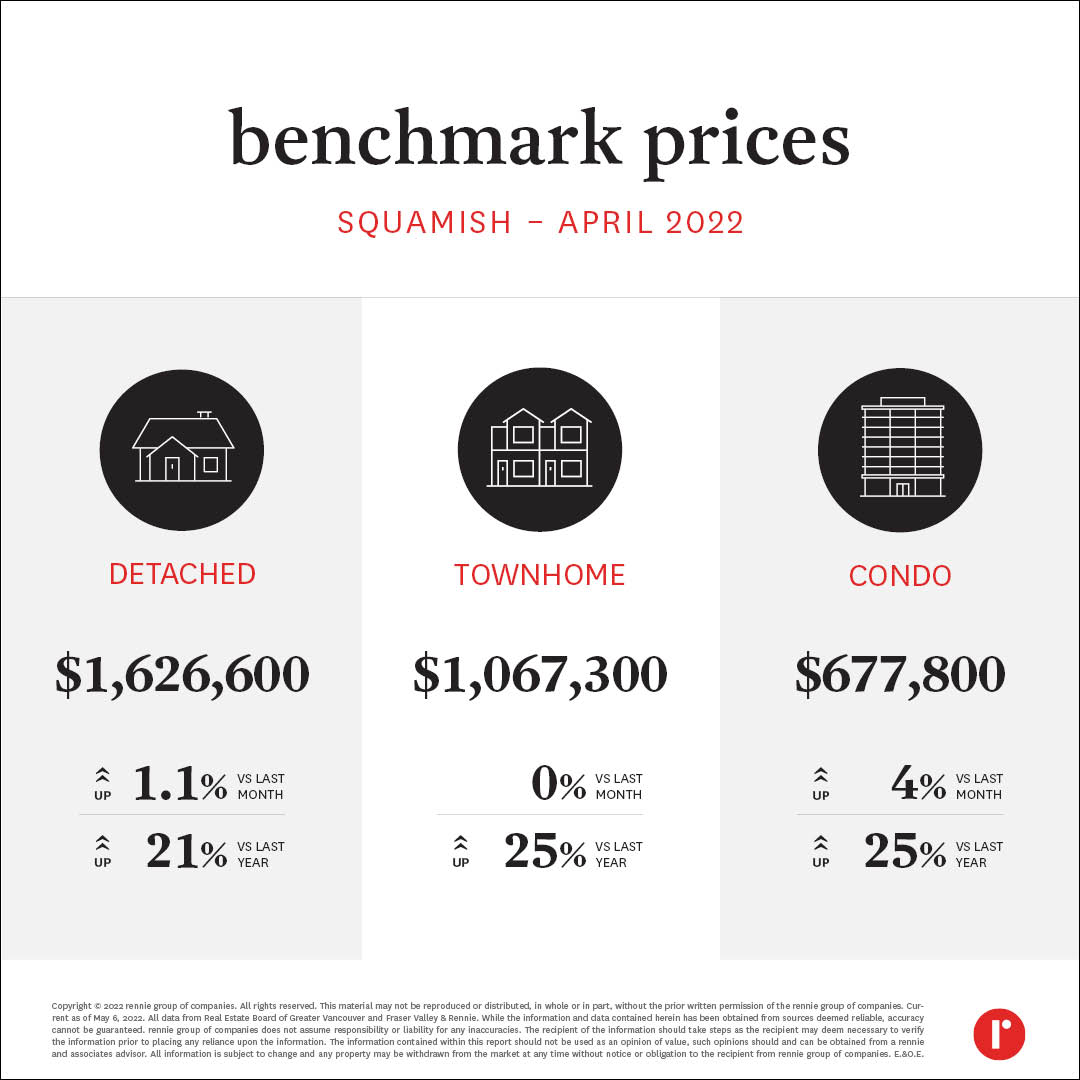 Tsawwassen
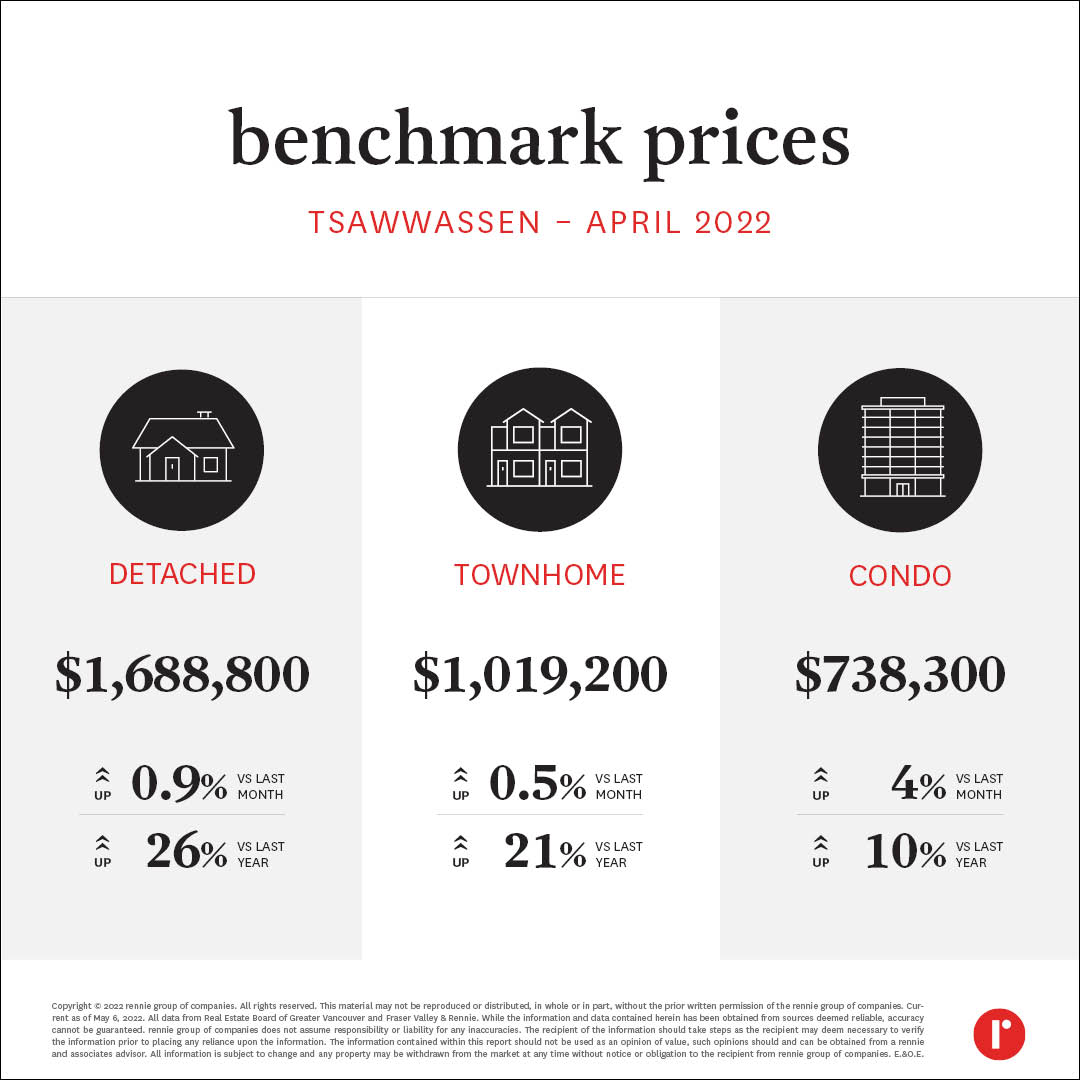 Port Coquitlam
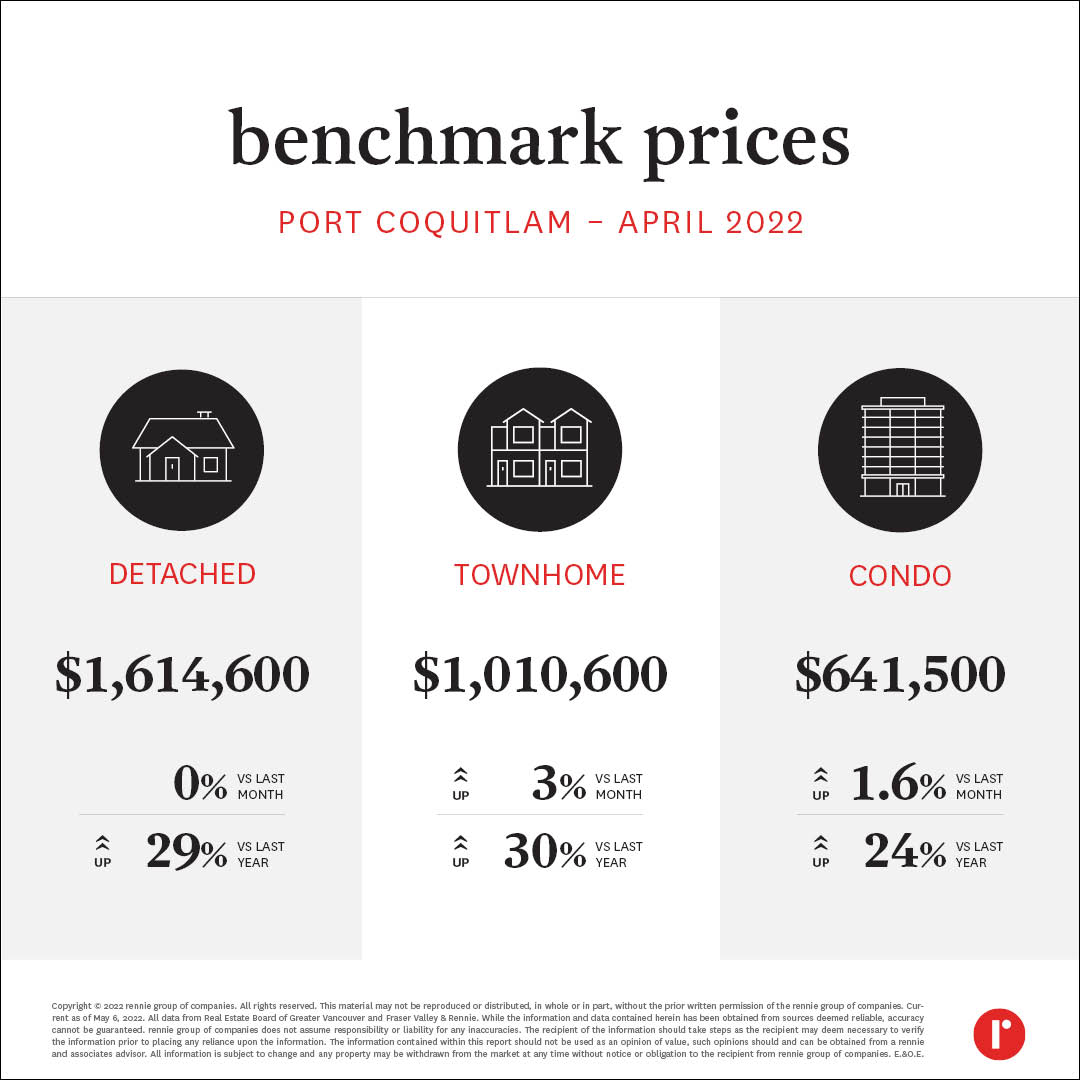 Port Moody
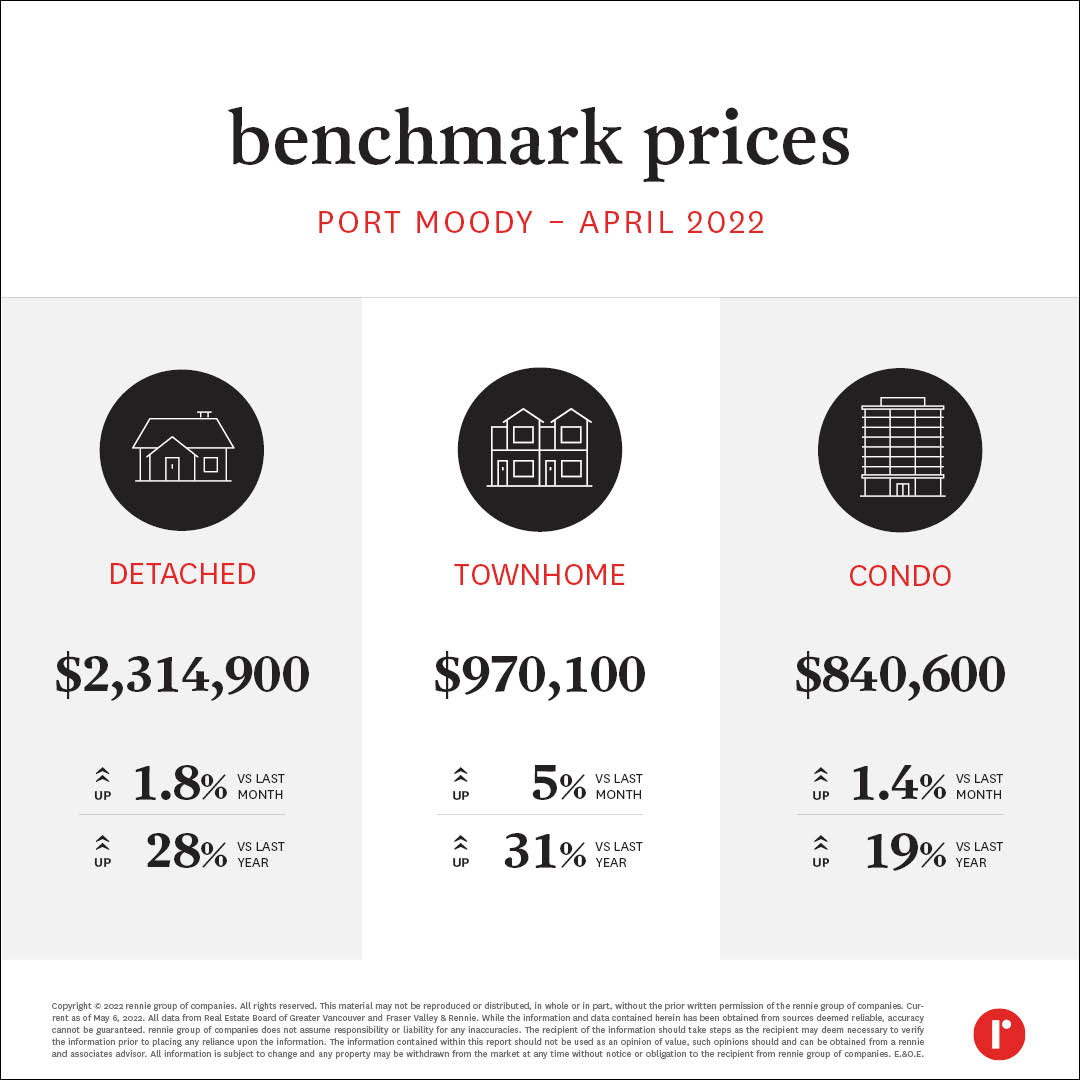 Fraser Valley Board Area
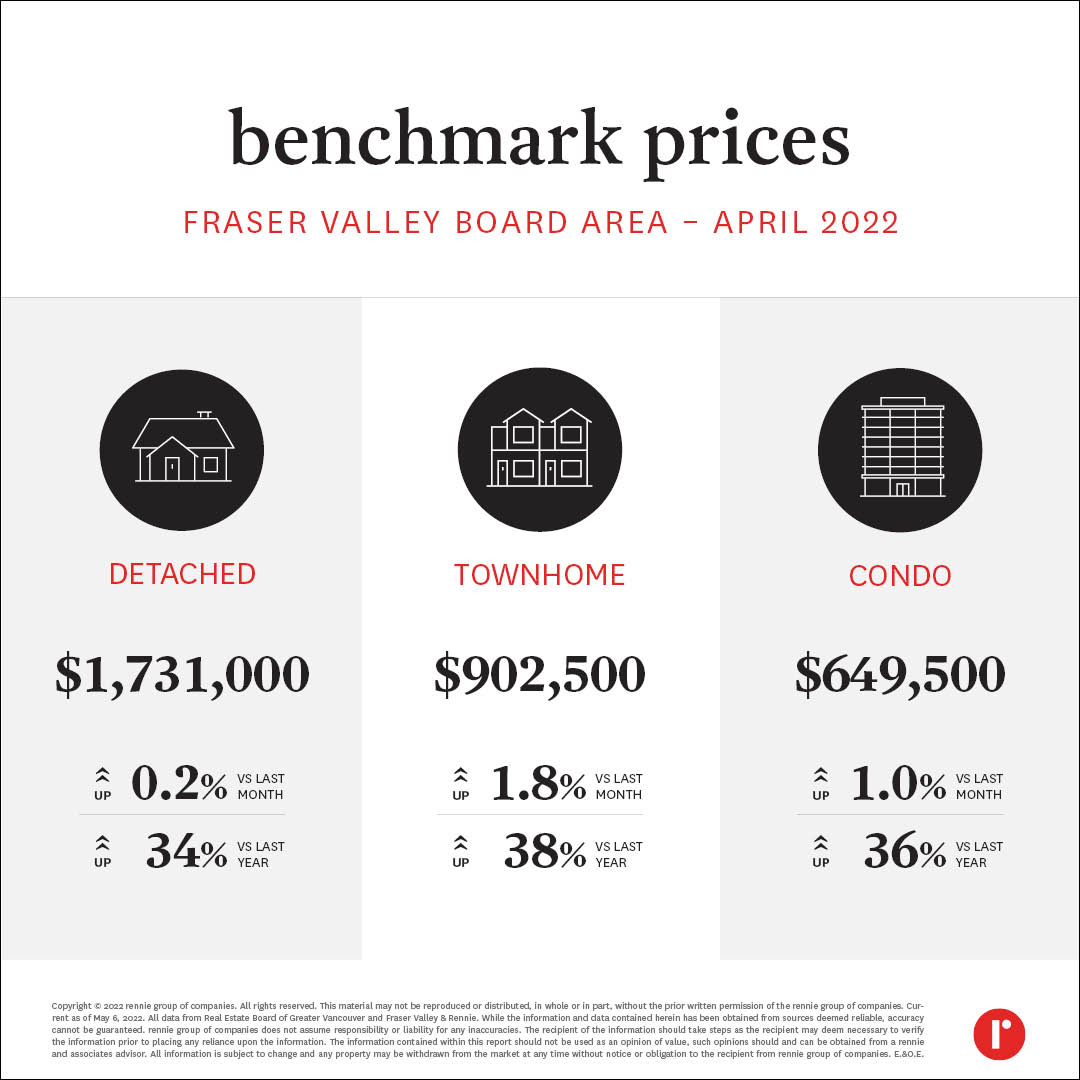 Surrey
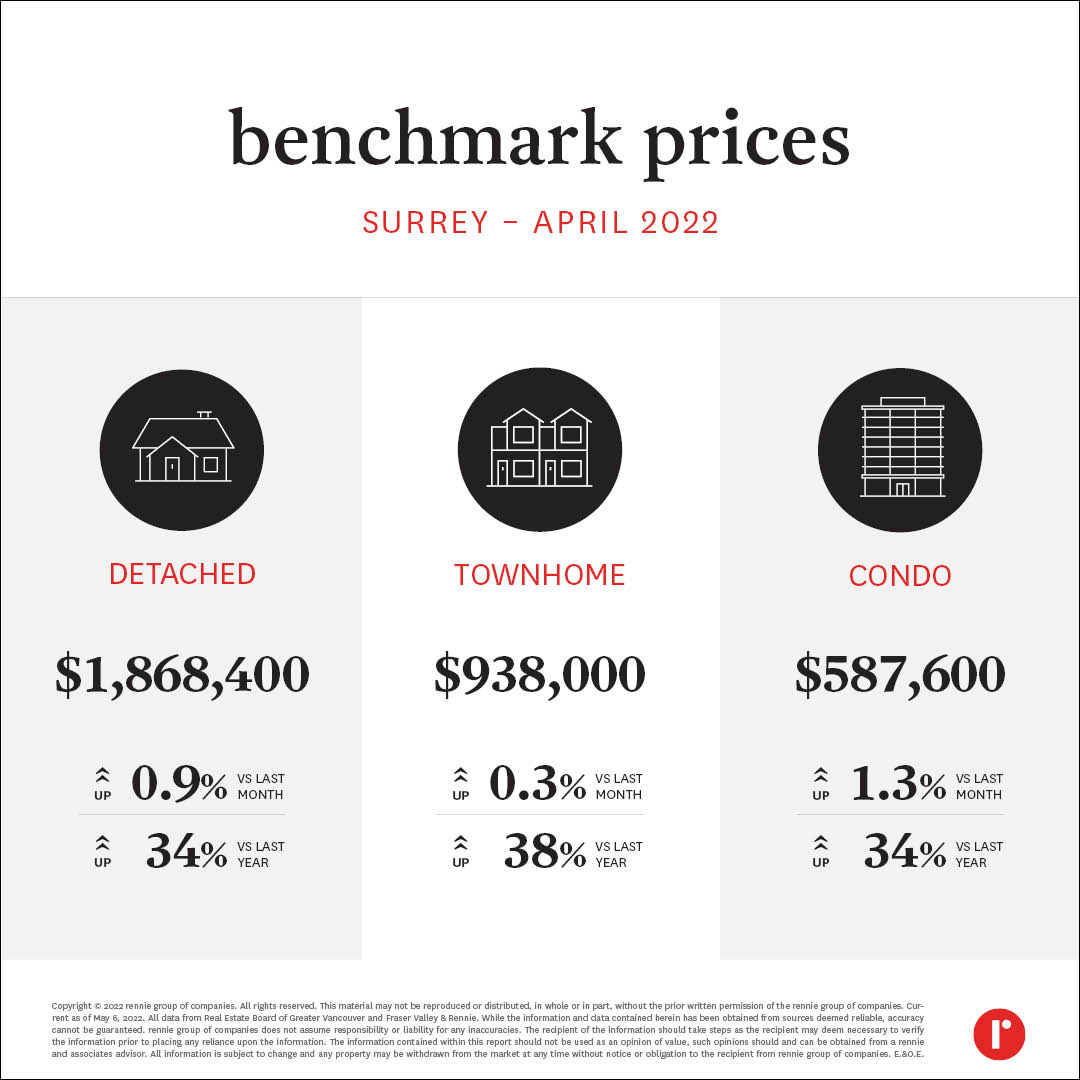 Langley
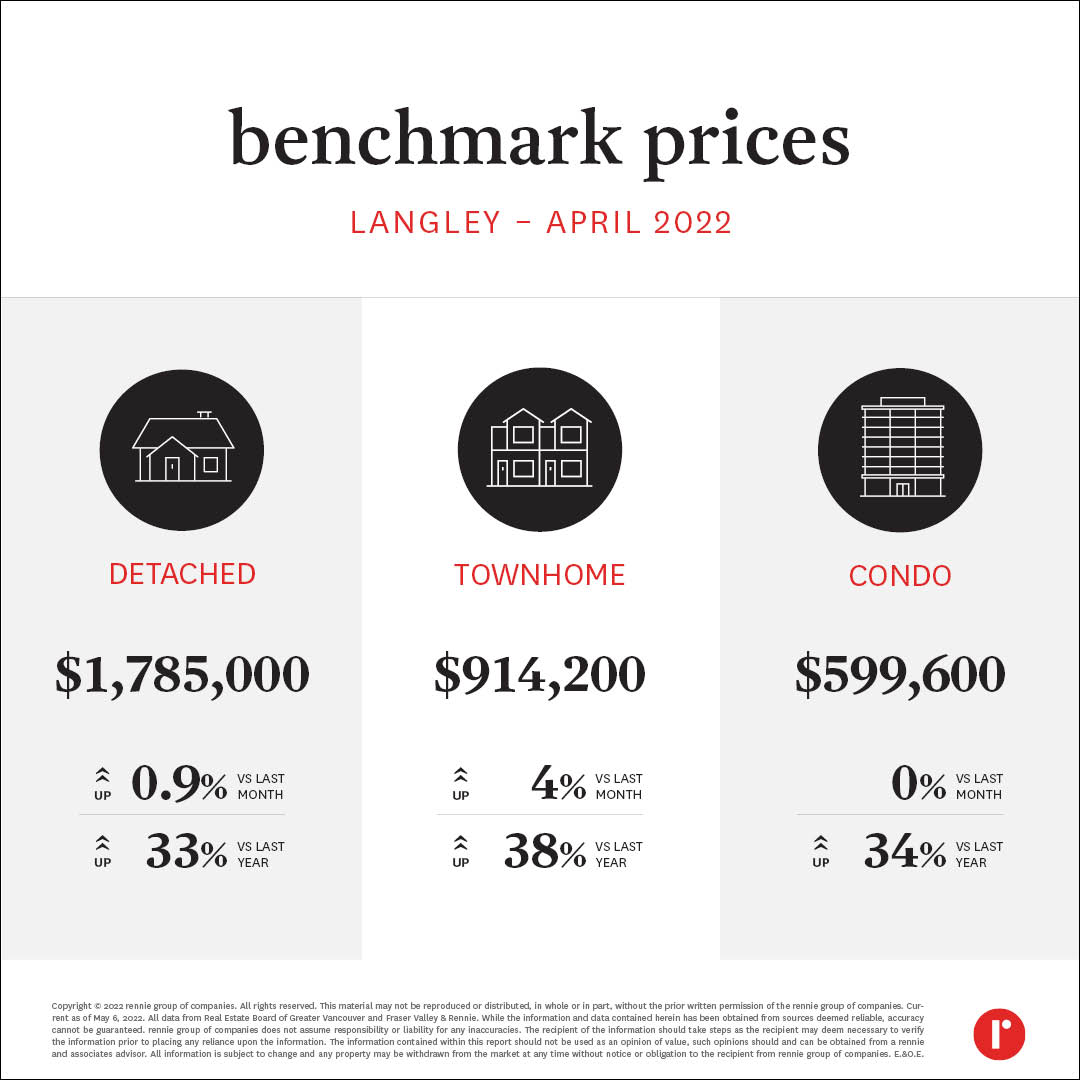 Pitt Meadows
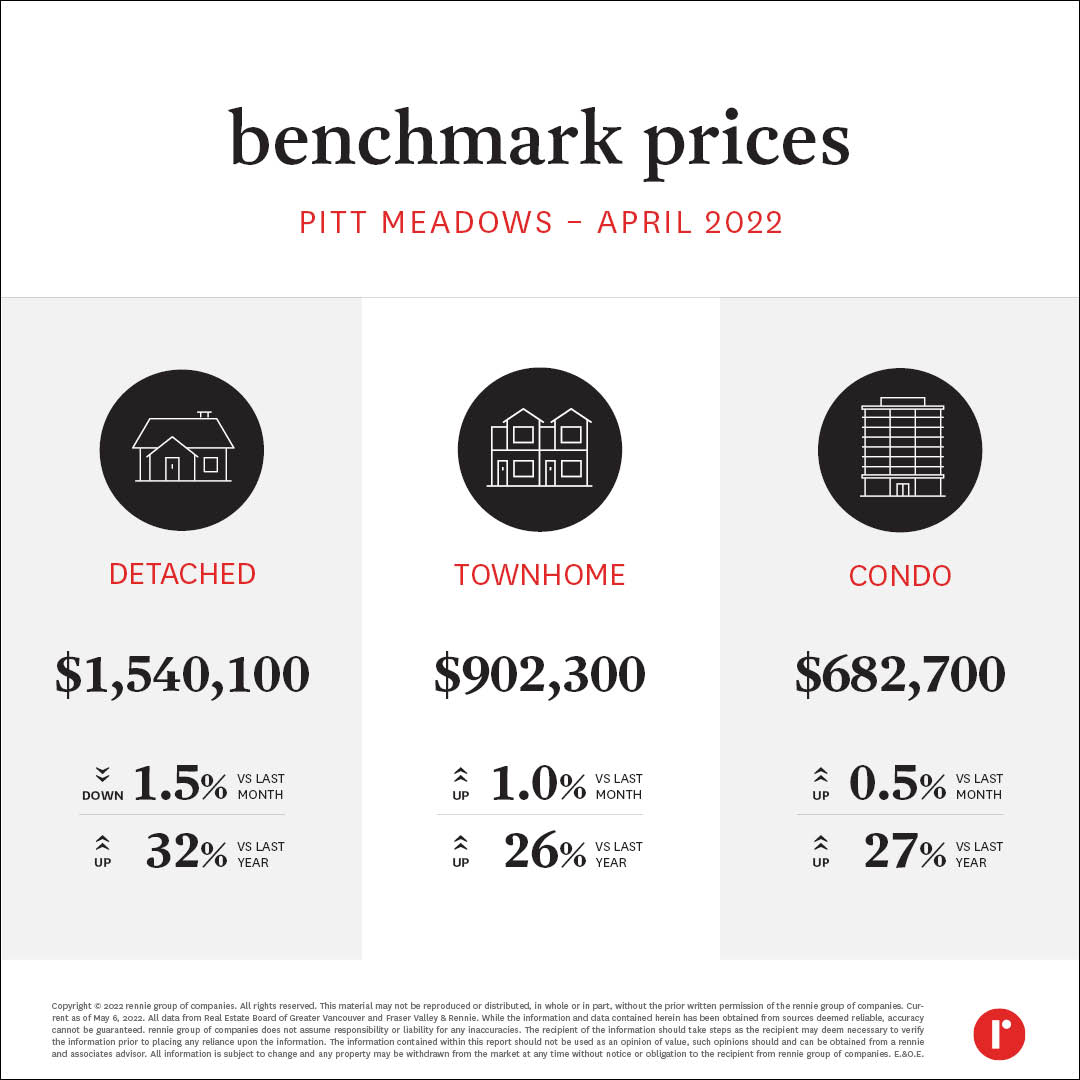 Maple Ridge
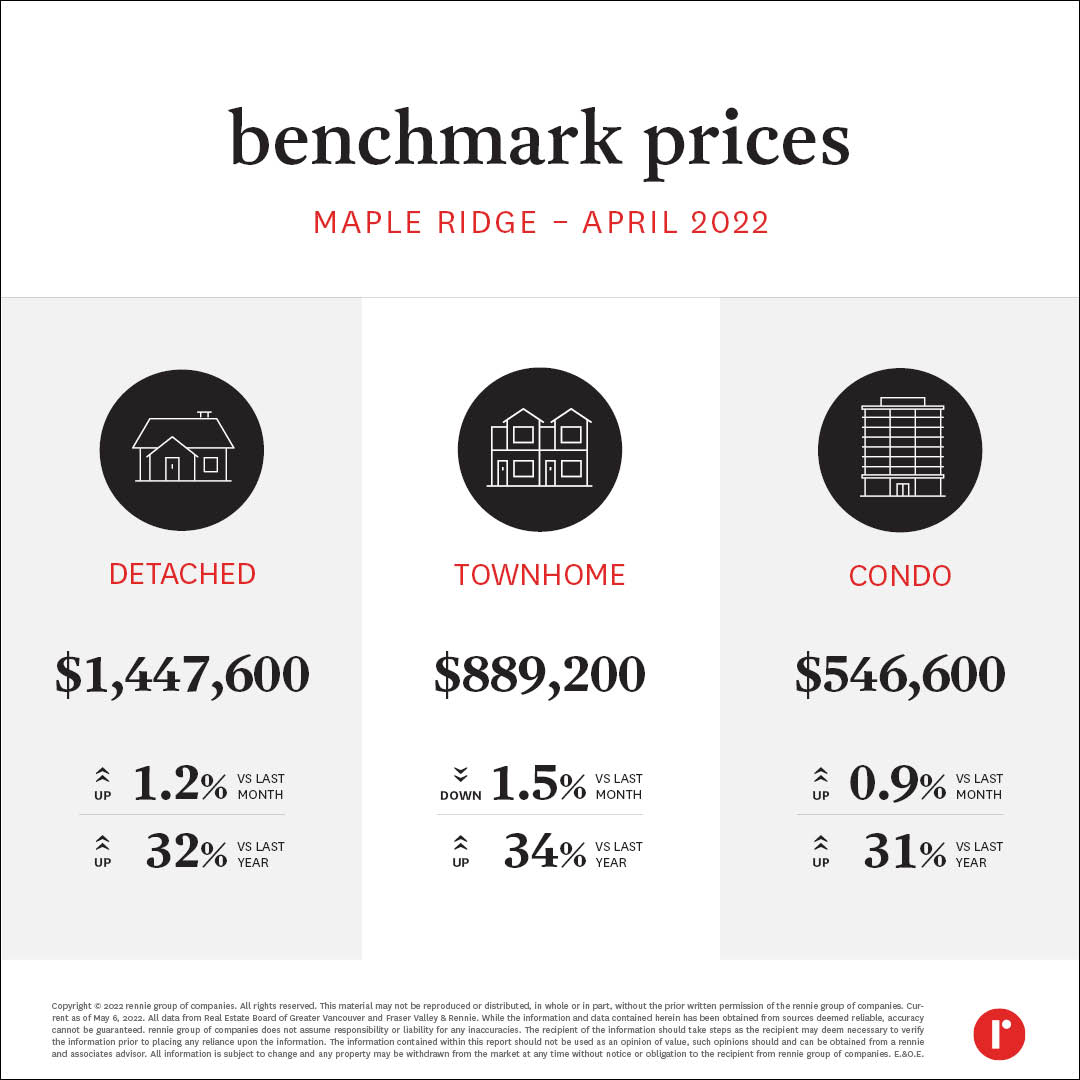 White Rock
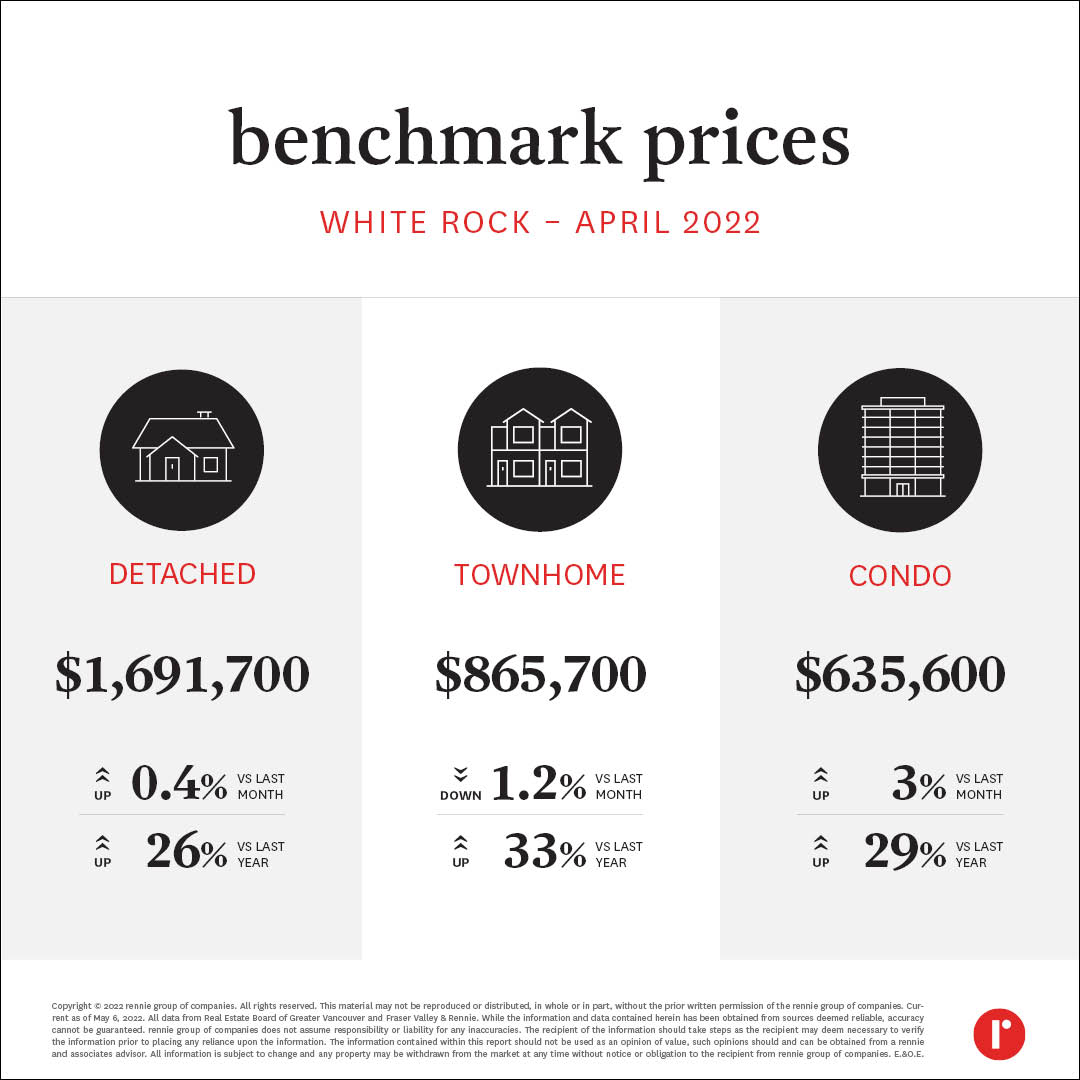 Abbotsford
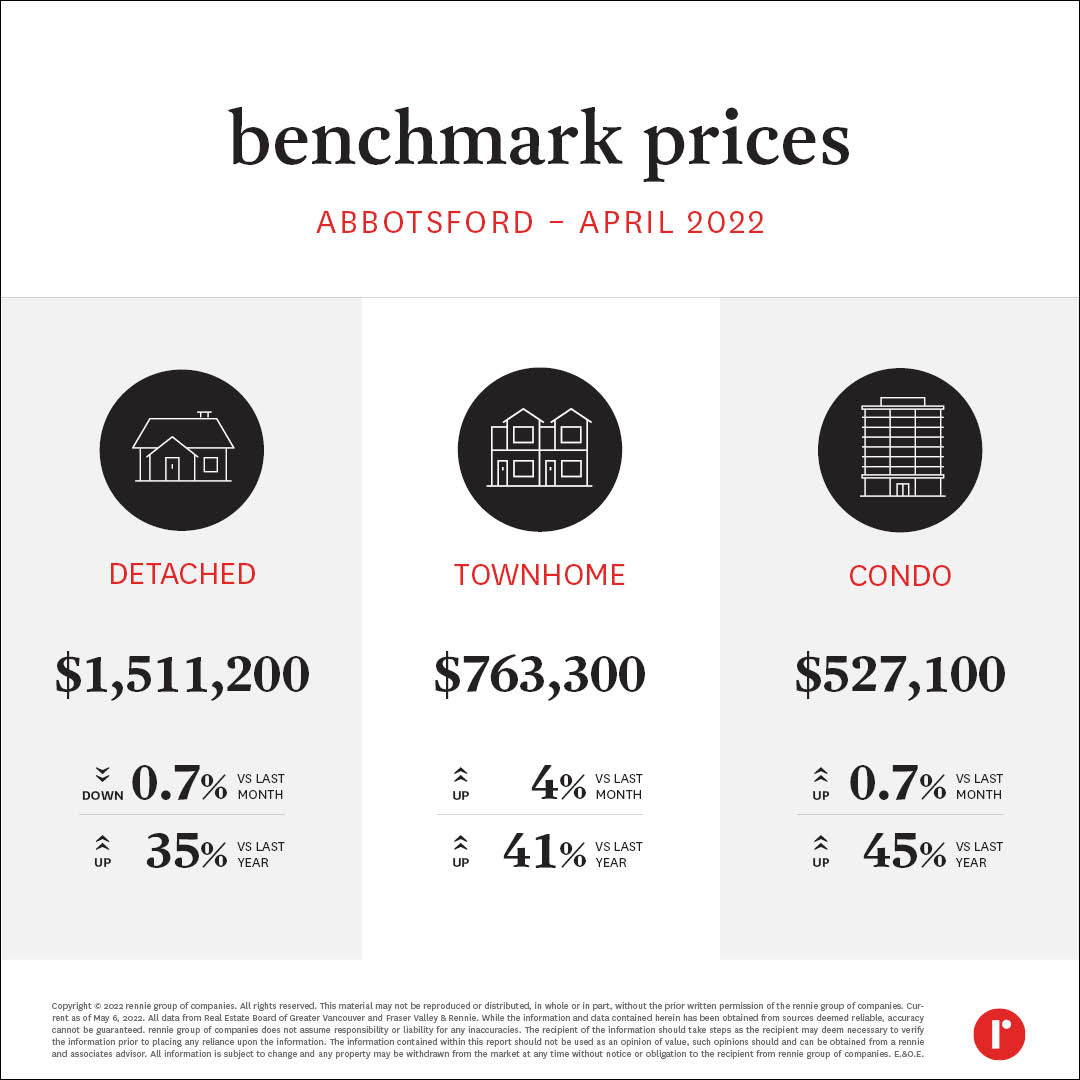 Chilliwack and District Board Area
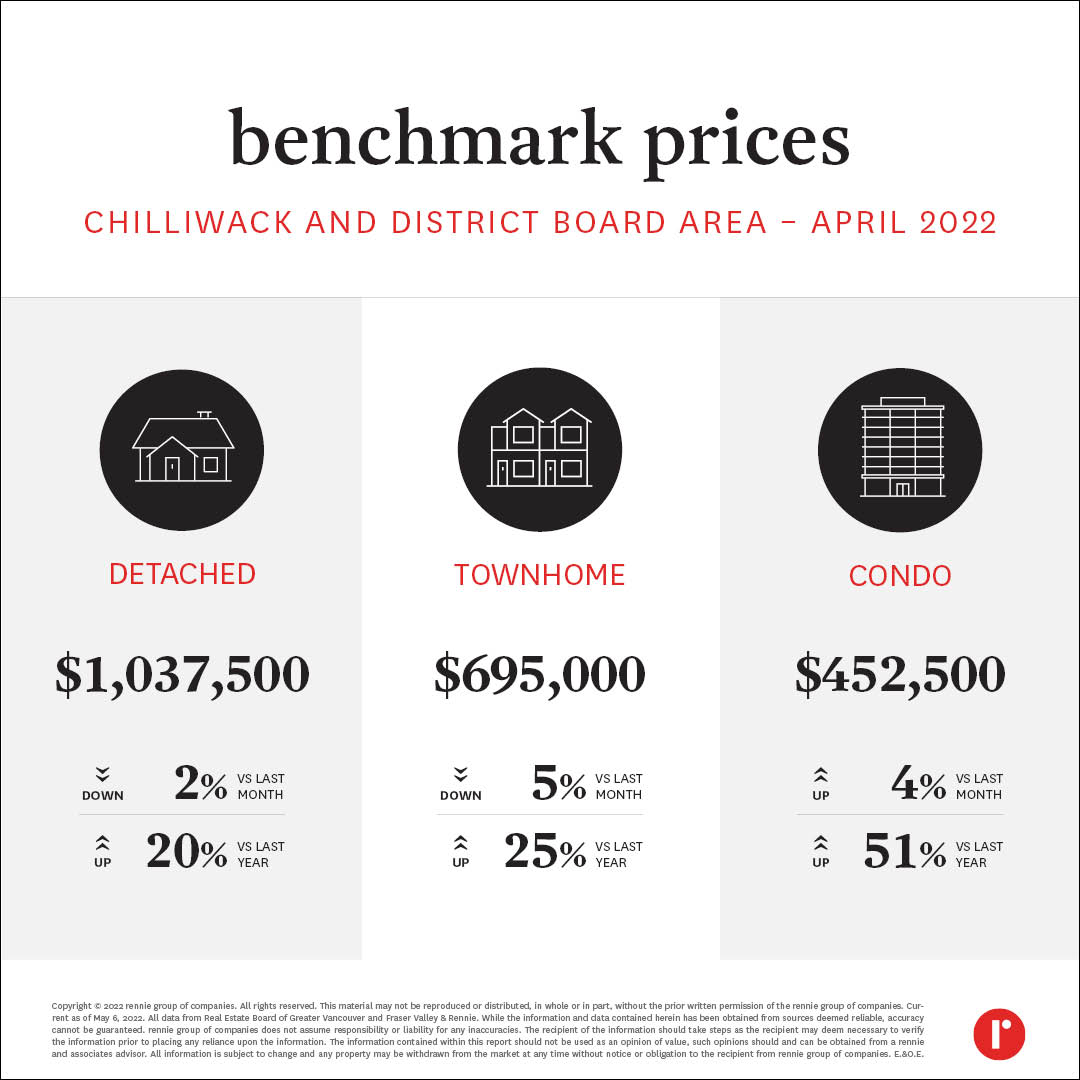 Note, the Chilliwack and District Board Area (CADREB) denotes the Median Sales Price rather than the Benchmark Price. The CADREB does not have a benchmark price available for record.
See Benchmark Prices Infographics for April 2022. Our rennie intelligence team comprises our in-house demographer, senior economist, and market analysts. Together, they empower individuals, organizations, and institutions with data-driven market insight and analysis. Experts in urban land economics, community planning, shifting demographics, and real estate trends, their strategic research supports a comprehensive advisory service offering and forms the basis of frequent reports and public presentations. Their thoughtful and objective approach truly embodies the core values of rennie.
Written by
Related
Sales in the Coachella Valley fell more than usual from March to April and, though they were slightly above last April’s count, they remained well below long-run monthly average levels. New listings were also down year-over-year and were well below typical levels for April, which put downward pressure on inventory levels.
May 2026
Report
Conditions tightened in the Coachella Valley in March, with sales reaching a 4-year March high while the number of active listings fell. The conflict in the Middle East is beginning to be felt here at home, as mortgage rates have begun their rise.
Apr 2026
Report