Market IntelligenceEconomy

Market Watch - Condominium Sales in Coquitlam Increase by 41%


Sep 08, 2016

Written by 

Ryan Berlin

SHARE THIS

In comparison to markets across the Lower Mainland, according to the latest rennie review, Coquitlam saw the largest spike in condominium sales. Sales increased by 41% year-over-year for attached homes, with a total of 142 sold compared to 101 last year. The average price for a condominium continues to rise, at an average of $479,346.

https://cdn.rennie.com/images/images/001/337/831/original/Inline-Trend.jpg

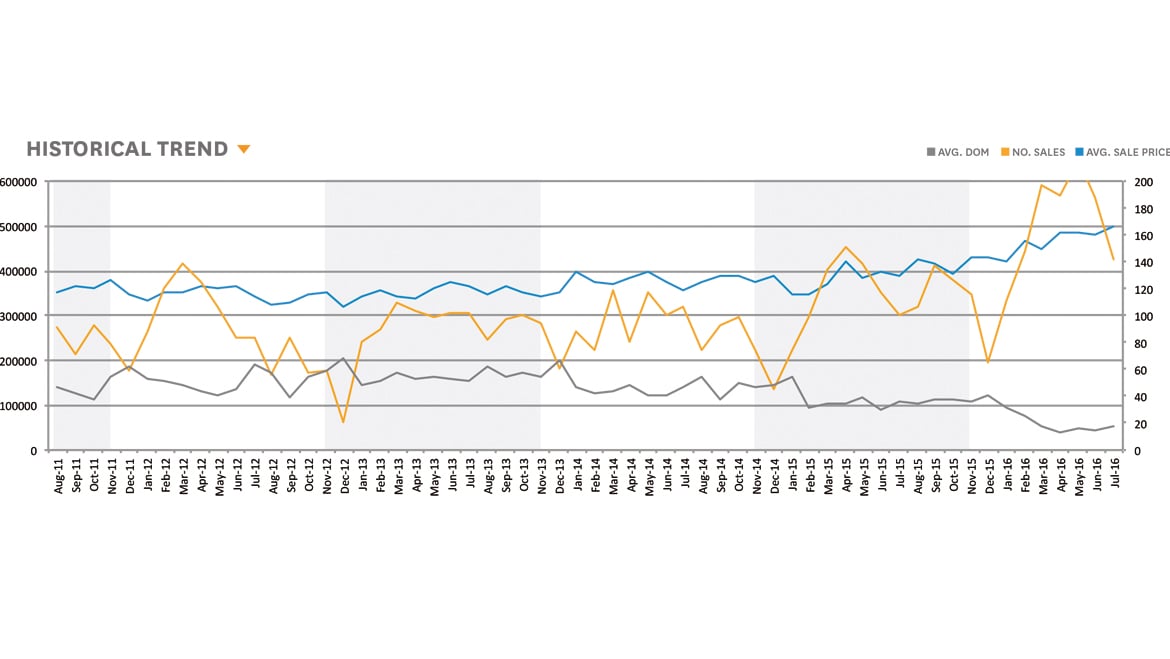
According to the Vancouver Sun, the Evergreen Line is scheduled to open before Christmas. It’s estimated that this new line will carry 70,000 passengers daily and increases access to the corridor between Burnaby and Coquitlam. Among other economic factors, the new Evergreen Line could be a factor of the rise in condo sales. Overall, the condominium market in Coquitlam is strong. The number of listings in Coquitlam have dropped by 39%, from 421 to 256, and the average days on market has also dropped to 18 days, from 36 days in the same period last year. The average sale price has increased by 28% to $497,346 from $389,747 last year. Data indicates that it’s a seller's market for Coquitlam condominiums with the sales to active listings ratio at 55%.Looking to buy a condo in Coquitlam? Our rennie advisors specialize in every neighbourhood across the lower mainland, and can help you find the home best suited to your needs.

Written by

Ryan Berlin

Subscribe to weekly market insights

Receive insights, analysis, and perspective from our rennie intelligence team on the Lower Mainland’s real estate market.

Related

blog-feature-media-cmm55v4204ker07sp8gyvrwrd
the seattle rennie advance | March 2026
King County recorded the fewest sales in the month of February among the available data going back to 2013, while new listings for the month were at their highest over the same period. Inventory was also at more than a 10-year high, driven by elevated townhome and condo listings.

Mar 2026

Report

blog-feature-media-cmlu50s771mcx07snv5wi9ry6
benchmark prices | February 2026
Benchmark price infographics for detached homes, townhomes, and condos are available for sub-markets in the Vancouver Region, Greater Victoria, and Central Okanagan regions.

Feb 2026

Report

Rennie Forbes Horizontal Red
  • Find a Home

rennie & associates realty ltd

copyright © 2026 rennie all rights reserved

By using this website, you agree to our Privacy Policy and Terms of Use.

do not share or sell my personal information

California DRE #02248150

MLS® Reciprocity

Disclaimer: This representation is based in whole or in part on data generated by the Chilliwack & District Real Estate Board, Fraser Valley Real Estate Board or Real Estate Board of Greater Vancouver which assumes no responsibility for its accuracy.

Disclaimer: This is not an offering for sale. Any such offering can only be made by way of disclosure statement. E&OE. The developer reserves the right to make changes and modifications to the information herein without prior notice. Photos and renderings are representational only and may not be accurate.