Benchmark Prices - January 2023
Jan 05, 2023
Written by
Ryan BerlinSHARE THIS
Here are the latest Benchmark Price Infographics for the areas of the Vancouver Region.Greater Vancouver Board Area Burnaby East
  Burnaby North
 Burnaby South
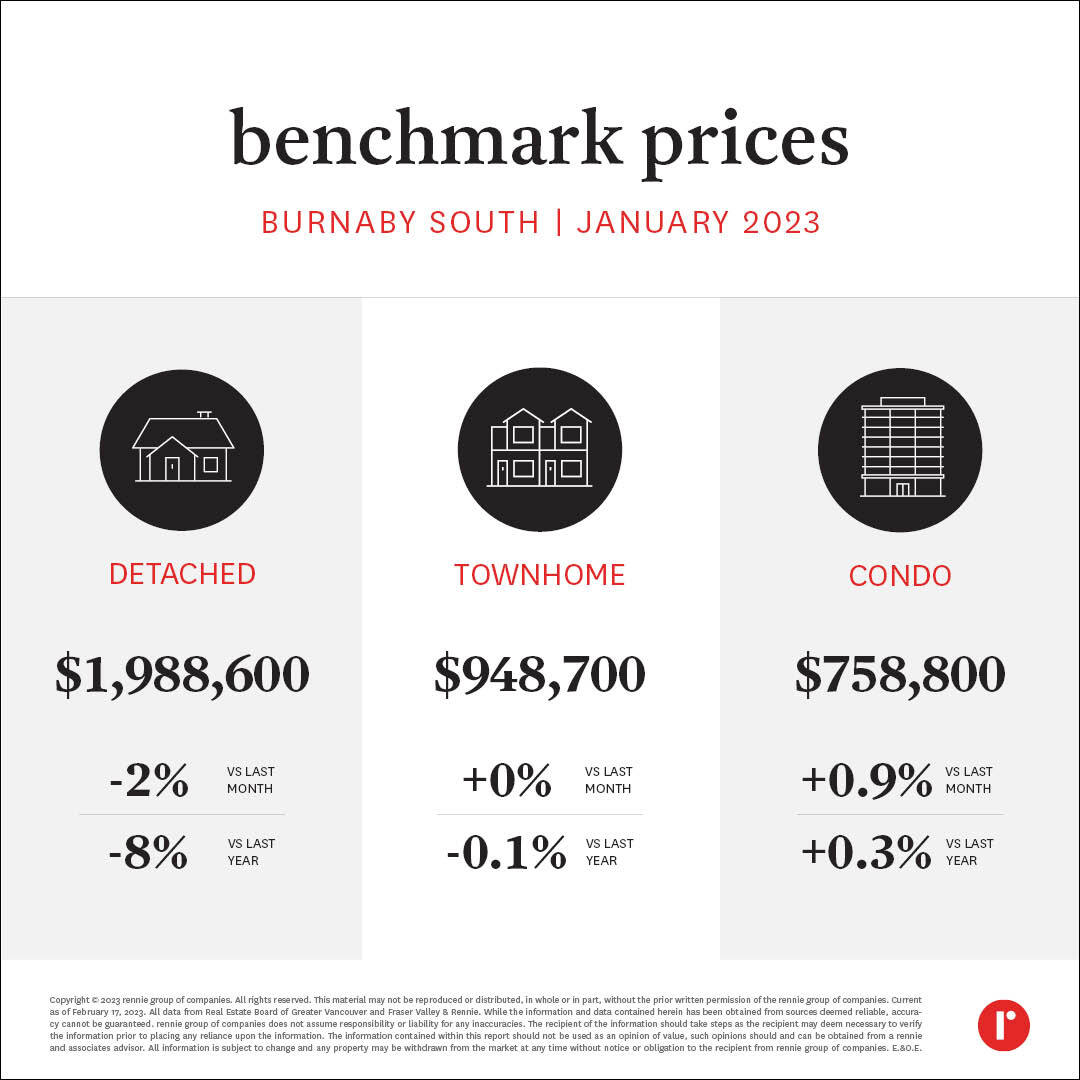 Coquitlam
 North Vancouver
 Richmond
 Vancouver East
  Vancouver West
  West Vancouver
 New Westminster
 Squamish
 Tsawwassen
 Port Coquitlam
 Port Moody
 Fraser Valley Board Area
 Surrey
 Langley
 Pitt Meadows
 Maple Ridge
 White Rock
 Abbotsford
 Chilliwack and District Board Area
 North Delta
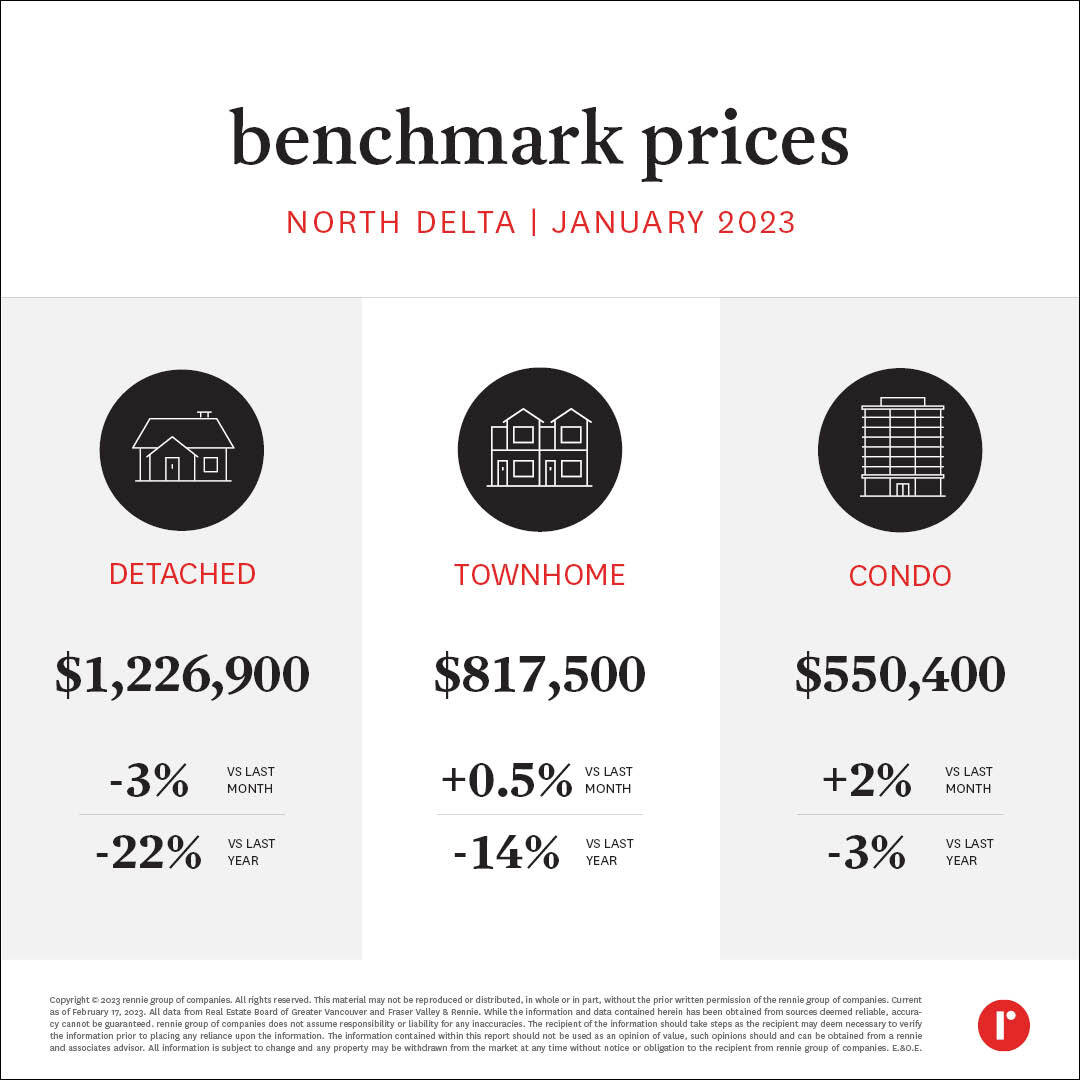 Note, the Chilliwack and District Board Area (CADREB) denotes the Median Sales Price rather than the Benchmark Price. The CADREB does not have a benchmark price available for record.
See Benchmark Prices Infographics for December 2022. Our rennie intelligence team comprises our in-house demographer, senior economist, and market analysts. Together, they empower individuals, organizations, and institutions with data-driven market insight and analysis. Experts in urban land economics, community planning, shifting demographics, and real estate trends, their strategic research supports a comprehensive advisory service offering and forms the basis of frequent reports and public presentations. Their thoughtful and objective approach truly embodies the core values of rennie.
Written by
Related
The rental "discount" available in traditionally more affordable Seattle submarkets is shrinking, and in some cases, have disappeared entirely.
May 2025
Article
5mins read
Another month of below-average sales and elevated new listings in April helped push inventory in the Central Okanagan closer to a new decade high. Available condo inventory has diverged from other home types and was more than 70% above long-run average levels.
May 2025
Report