By now, you’ve probably heard that Canada is in the midst of a record population boom. With nearly 1.3 million new Canadians added to the country in the 2023 calendar year (yielding annual growth of 3.2%), Canada found itself in territory unfamiliar to most developed nations as one of the fastest growing countries in the world.
Non-permanent residents (which are those people coming to Canada on student visas or temporary work permits) have been the primary driver behind such rampant growth. The sheer pace of these new arrivals has accentuated affordability issues across the country, which in turn has led to some evident migratory patterns between provinces (i.e., from more expensive regions like BC and Ontario to more affordable regions like the prairies and maritime provinces). Until recently, discussion on these migration patterns have largely been limited to the provincial level.
On May 22nd, Statistics Canada released sub-provincial population estimates for the year leading up to July 1st, 2023. While the data is certainly not timely, it nonetheless offers some fascinating insights on how individual communities have been affected by record population growth and how people are moving within and between provinces. Here, we’ll assess how the population composition of BC’s three largest census metropolitan areas (CMAs)—Vancouver, Victoria, and Kelowna—have been impacted by the boom.
Only the Big Grow Fast?
As things grow, sustaining a high growth rate becomes increasingly difficult. For example, a small fruit stand that generated $10,000 in sales last year would only need to sell $1,000 more fruit this year to achieve a 10% annual growth rate. On the other hand, a national grocer that generated $10 billion in revenue would have to increase sales by another $1 billion to achieve the same growth rate. That’s one million times more incremental sales than the fruit stand to achieve the same growth rate.
Applying this logic to cities, it’s relatively easier for the population of a smaller regional centre to achieve a given growth rate than it is for a larger urban centre as it requires fewer new people on an absolute basis to generate said growth. In fact, that is precisely what has been playing out right across BC for the better part of the past decade. Between 2012 and 2022, average annual population growth in smaller CMAs like Kelowna (2.3%), Chilliwack (2.0%), and Nanaimo (1.8%) outpaced growth in the province’s largest CMA of Vancouver (1.5%). Focusing on Kelowna specifically, growth was so robust over this period that, among Canada’s 41 CMAs, it finished among the top five fastest-growing in nine consecutive years (in four of which it placed first).
However, flip to 2023 and things looked considerably different. Not only was Vancouver the fastest-growing CMA in the province, but it was also the sixth fastest-growing CMA in the country. With a population of 2.97 million, annual growth in Metro Vancouver came in at 4.2%, far surpassing levels seen over the previous two decades (its second fastest growth rate was 2.9% in 2022). Prior to 2023, none of Canada’s three largest urban metropolitan areas (Toronto, Montreal, and Vancouver) had placed in the top 10 fastest-growing CMAs in nearly a decade.
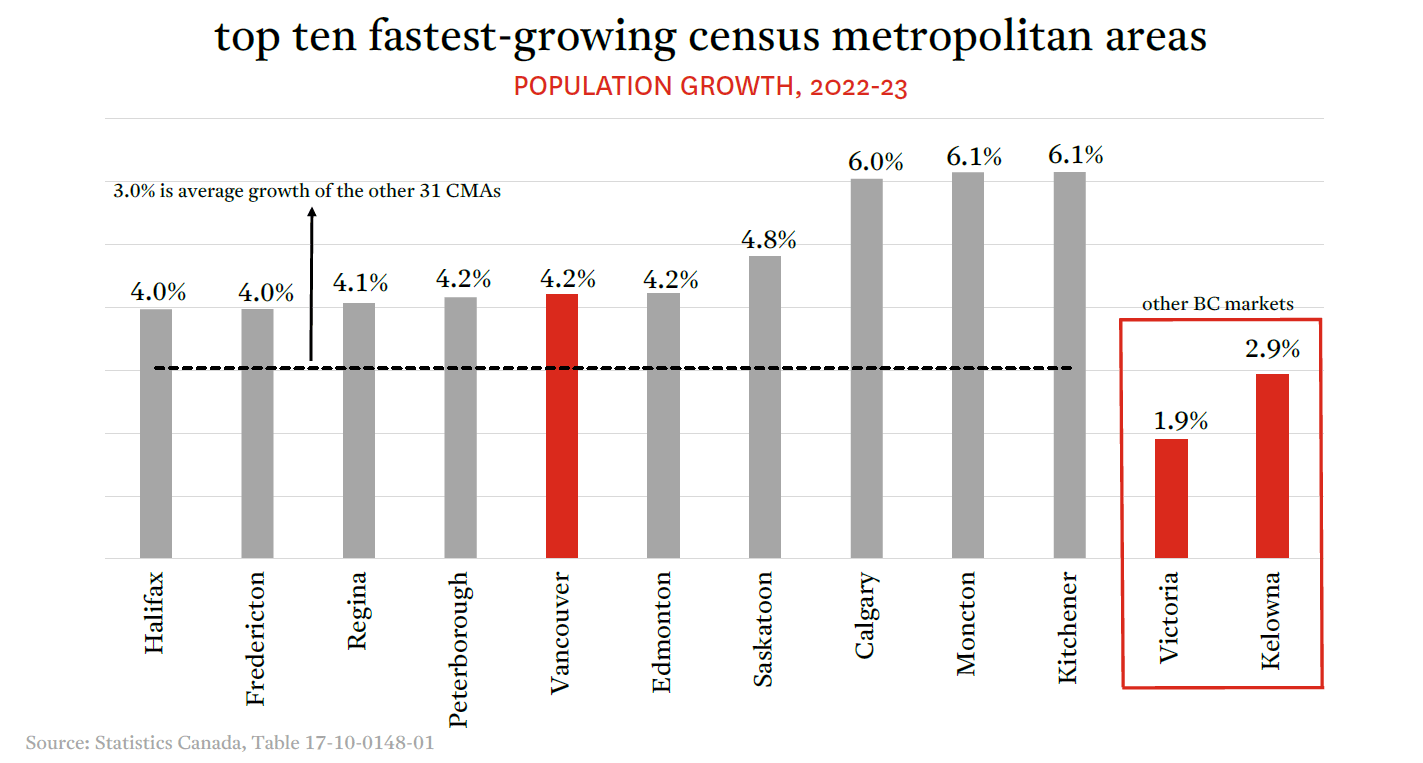
Meanwhile, population growth across BC’s smaller CMAs stood in contrast not only to Vancouver, but to their own trajectories over the past decade. With growth of 2.9% and a population approaching 247,000, Kelowna fell to 24th place on the growth list, its lowest ranking in two decades of data. Kamloops (2.6%), Chilliwack (2.1%), Nanaimo (2.0%), and Victoria (1.9%) were all near the bottom of the list with rankings between 29th and 38th.
To make matters even more perplexing, population growth in all of these smaller CMAs actually outpaced their own 10-year average growth rates (and some by a significant margin). So what explains this upside-down dynamic of robust population growth in BC’s smaller regional centres but poor performance relative to other Canadian CMAs? And what explains Vancouver’s ascent to the top of the population growth list?
All Roads Lead to International Migration
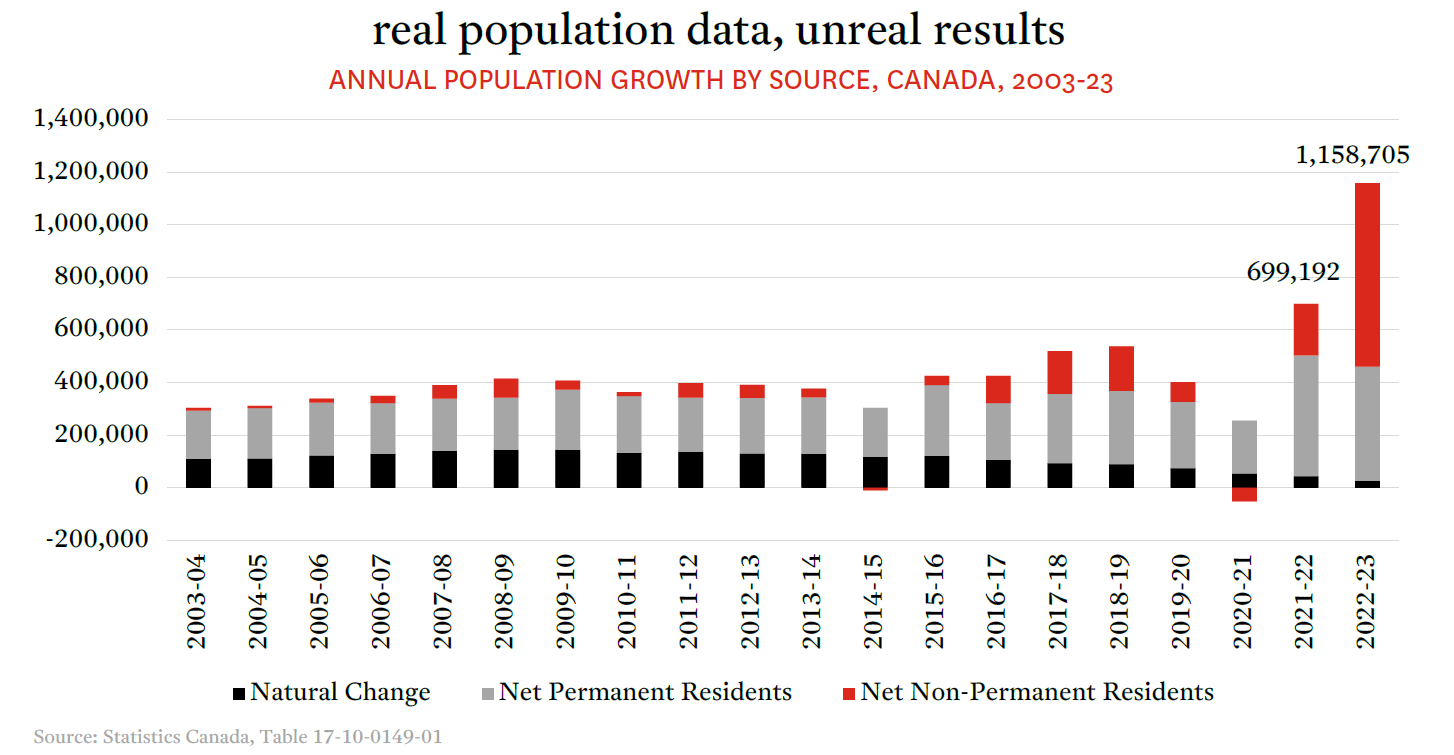
Applying substantial change and pressure to any system is bound to disrupt (and in some cases magnify) pre-existing rules and patterns. Such is the case with Canada’s immigration system, which has seen an almost incomprehensible level of change in the past two years. Between 2006 and 2015, Canada saw net international migration (which includes both permanent residents and non-permanent residents) average about 240,000 people per year. That number climbed to about 365,000 between 2016 and 2020 under a new government keen on addressing a population that was (and still is) quickly ageing into mass retirement. Barring a disruptive 2020 and the onset of the pandemic, international migration has since skyrocketed. In the 12 months leading up to July 2023, Canada’s population grew by 1.16 million, 98% (1.13 million) of which came from international migration.
Where these people land determines how individual communities are impacted by the population boom. Generally, international migrants settle in larger urban centres, which we can prove by calculating the ratio of a community’s share of new international migrants in a year to its share of the national population. A ratio above 1.0 identifies a community that is absorbing more than its expected share of international migrants, while a ratio below 1.0 indicates the opposite. Notice in the below chart how Canada’s four largest metropolitan areas all had ratios well above 1.0.
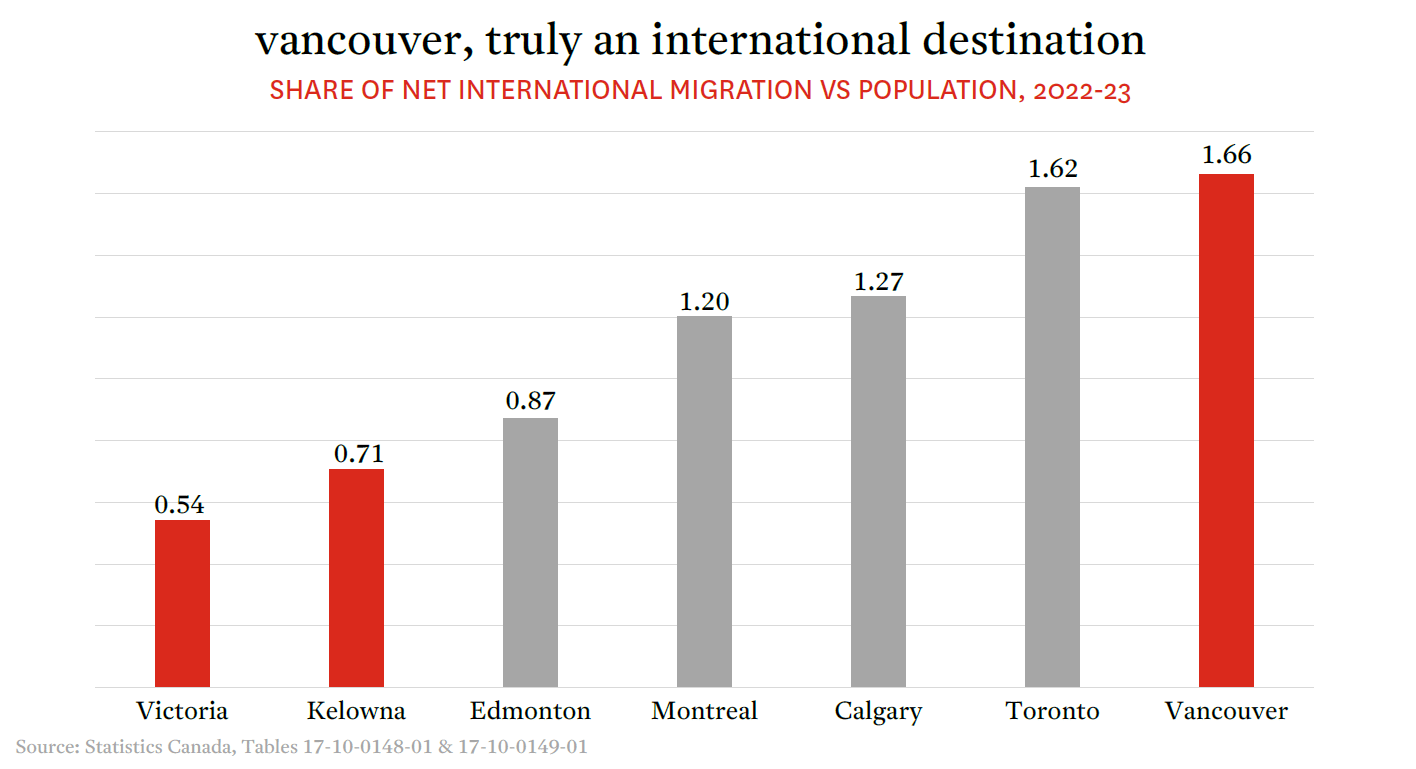
You will also notice that Vancouver had the highest ratio among the large CMAs at 1.66, slightly outpacing Toronto (1.62) and more handily outpacing Calgary (1.27), Montreal (1.20), and Edmonton (0.87). What this means is that Vancouver welcomed the most disproportionate share of international migrants among Canada’s largest CMAs in 2023. Despite accounting for 7.4% of Canada's population, Metro Vancouver welcomed 139,215 international migrants in 2023, or about 12.3% of the total (12.3% divided by 7.4% yields a ratio of 1.66). Put another way, the region absorbed 66% more international migrants than would be expected if migrants were simply allocated across the country based on the size of each town and city. Victoria and Kelowna, in contrast, absorbed fewer new Canadians than would be expected by their size (with ratios of 0.54 and 0.71, respectively).
So, what about the above analysis might explain Vancouver’s top 10 growth performance and the slipping relative performance of Victoria and Kelowna? Well, when you combine record international migration at the national level with a region that bears the most disproportionate share of that migration, you end up in a situation where the country’s third largest CMA (Vancouver) is among its fastest-growing. Simultaneously, smaller communities like Victoria and Kelowna fell towards the bottom of the growth list because they absorb a relatively small proportion of international migration.
There’s More Than One Way in (And Out) of Town
While international migration accounts for the vast majority of population growth in Canada, there are still other factors to consider when looking at the population composition of provinces and communities. Domestic migration—movements of people within and between provinces—provides us with some additional information on how communities are growing. Here too, some sharp changes in pre-existing patterns of migration occurred in 2023.
Perhaps the most notable takeaway from the newly-released data was the new high in the number of residents calling it quits on Metro Vancouver. Despite the long list of things that the region has going for it, there are also many reasons why some might choose to seek out a new life elsewhere, be it better housing affordability, less traffic, or a more laid-back lifestyle (among others). This is not a particularly new phenomenon; in fact, Metro Vancouver has consistently lost residents to other parts of BC for the past two decades. Since 2016, departures due to intra-provincial migration have ramped up significantly, reaching a high of 18,694 in 2022.
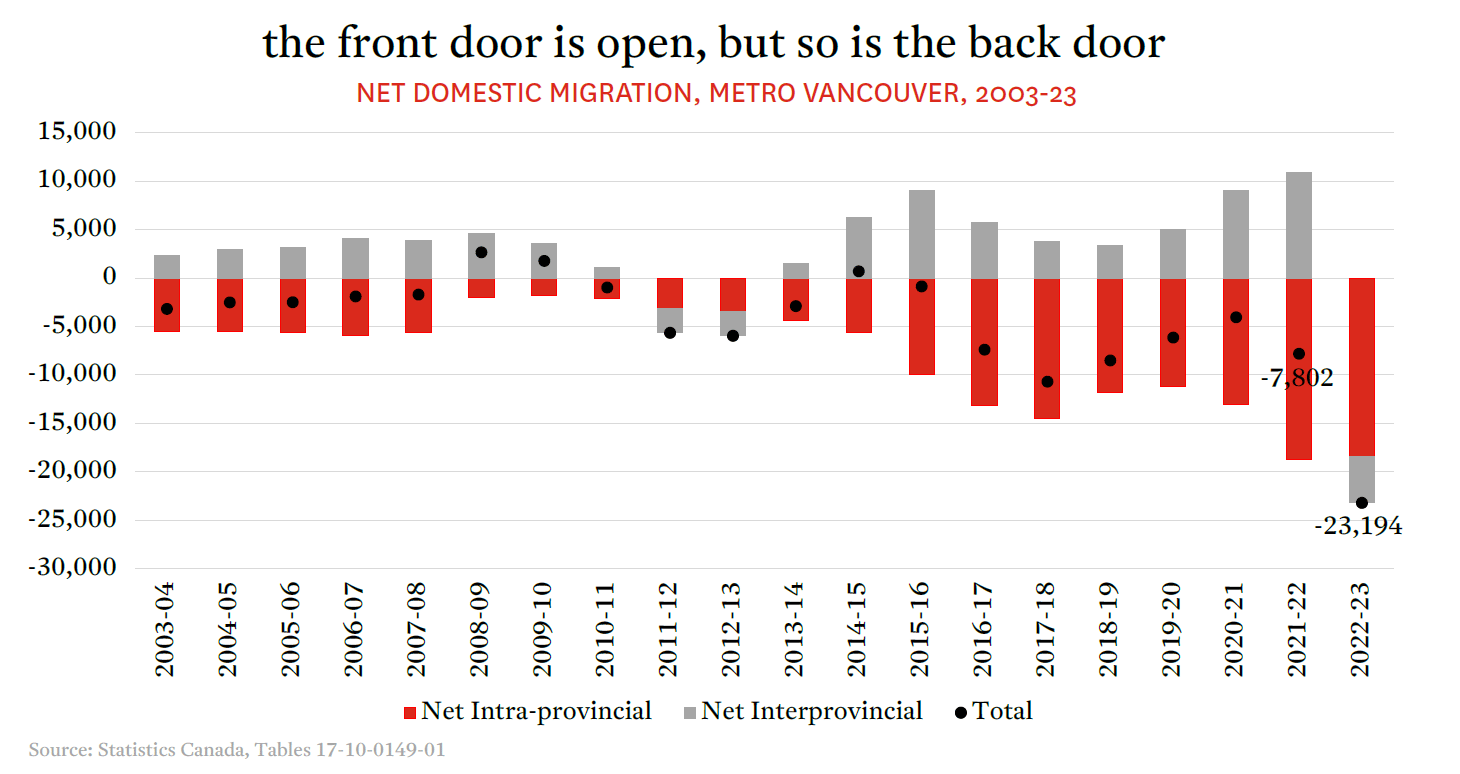
While Metro Vancouver posted a nearly identical loss in 2023, it also saw its largest outflow of residents to other provinces in two decades. This resulted in a net loss of 23,194 residents to domestic migration (this was up 197% from the prior year’s net loss of 7,802). In the past, losses of residents to other parts of BC were partly offset (and in some cases more than offset) by net inflows of people from other provinces. That pattern was upended in 2023 showing that, while Vancouver may be a hot destination for new Canadians, not everyone feels the same way.
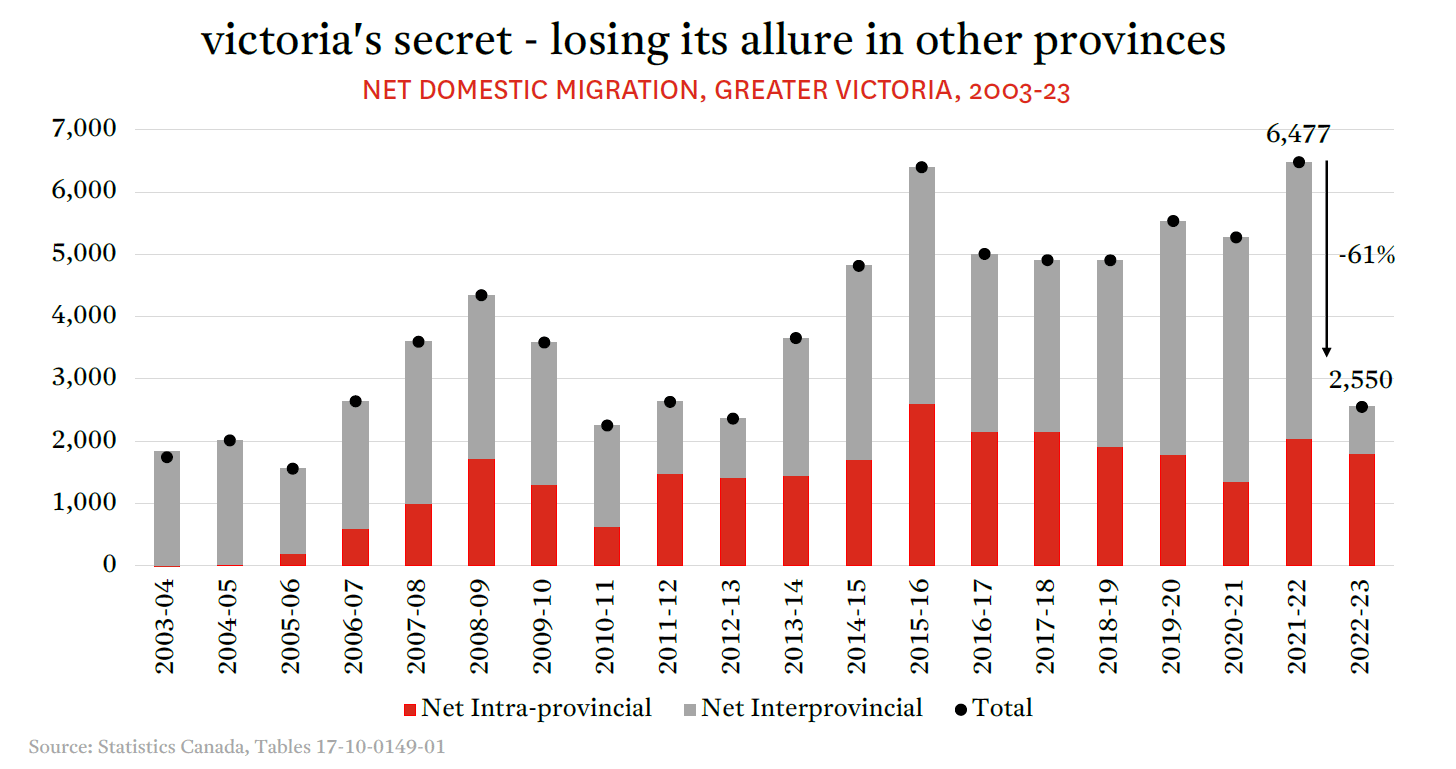
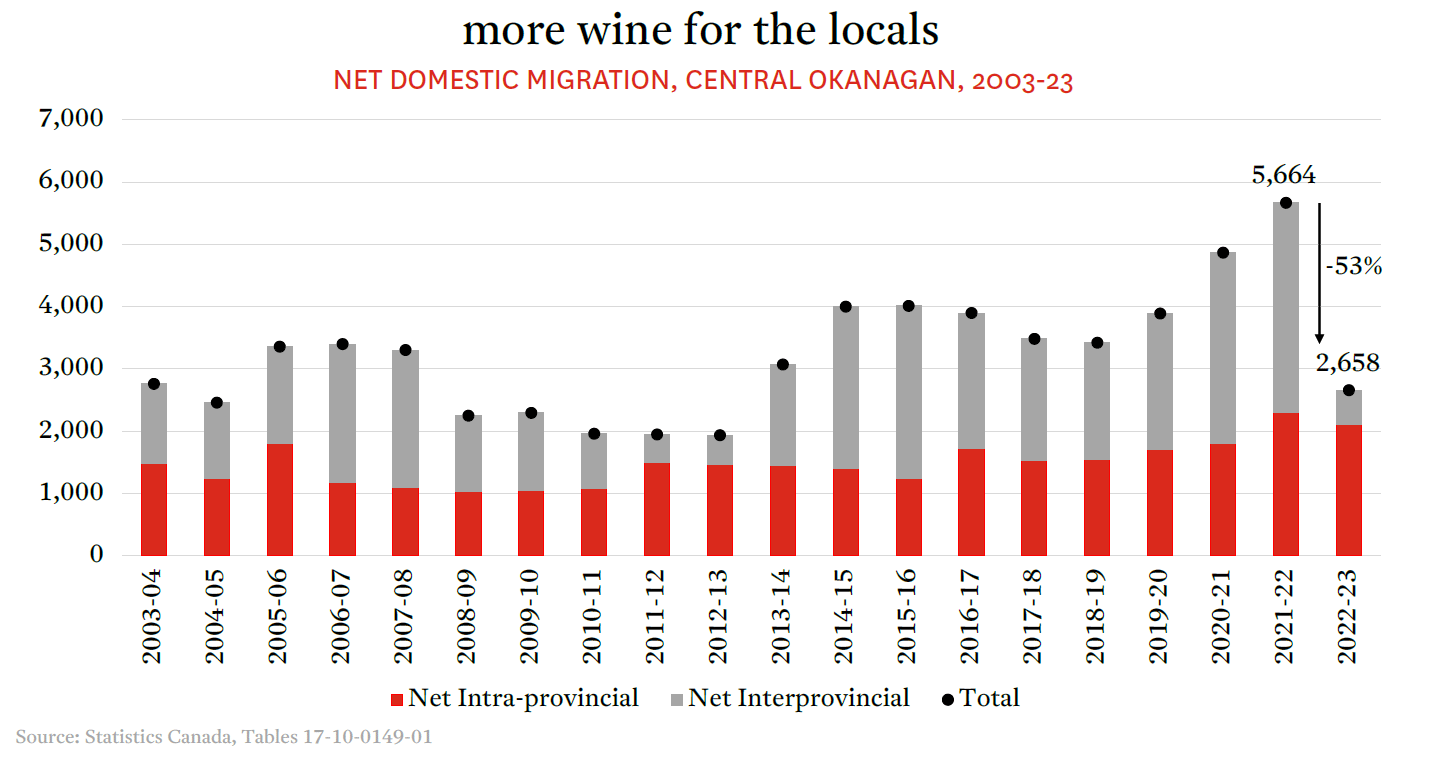
In Victoria and Kelowna, contrary to Vancouver, both regions have historically seen net annual gains in residents from other parts of BC, primarily Metro Vancouver. This has typically been augmented by even higher shares of interprovincial migration. However, in 2023, a change in interprovincial migration patterns upended the pace at which these two regions saw growth from domestic migration. Total net domestic migration to Greater Victoria was down 61% year-over-year (to 2,550), driven by an 83% decline in interprovincial migration. Similarly, net domestic migration to the Kelowna region was down 53% year-over-year, driven by an 84% decline in interprovincial migration. While some of these declines were offset by an increase in the number of international migrants, it’s clear that all three of BC’s largest metro areas have lost some of their lustre vis-a-vis other provinces.
Expect More of the Same
Record international migration to Canada has disrupted traditional patterns of growth and migration within the country, at the same time as it has accelerated others. In a typical year, you probably wouldn’t expect to find a place the size of Metro Vancouver at the top of the national growth chart. But as 2023 showed, when international migration is ramped up to truly unprecedented levels, our largest cities (and especially Vancouver) bear the overwhelming brunt of said migration. While a strong case can be made for higher immigration, it is not without consequences. Pressure on affordability and other infrastructure caused a record number of people to move out of Metro Vancouver in 2023, some of whom chose to call it quits on BC entirely.
Looking ahead, it is important to keep in mind some of the limitations in the data shared in this article. The sub-provincial population estimates produced by Statistics Canada, as mentioned earlier, are not a real-time view of migration patterns to and between communities; the latest report only provides estimates up to July 2023. Since then, many of the trends discussed above have only accelerated. For example, over the past year, Canada has continued to take in international migrants at a record pace. Through the first three months of 2024, Canada has issued slightly more than 400,000 permits to non-permanent residents, an increase of 25% from the first three months of what was a record 2023–and that’s on top of 121,620 new permanent resident permits.
Beyond that, rising rents, elevated home prices, and stubbornly-high interest rates have continued to stress housing affordability, which in turn has continued to drive migration from more expensive to less expensive regions. In the second half of 2023, BC lost another 7,362 net residents to other provinces. Much of that loss was to BC’s closest neighbour–Alberta–which we will explore in more detail in a future article.
All that to say, the trends discussed throughout this article are likely to have remained unchanged over the past year. So, if you thought that migration patterns in 2023 were a one-off, you might want to think again.