February 2017 Market Summary
Click to view our February 2017 market update video featuring Board President Dan Morrison.
Here's the video's minutes:
Reluctance of amongst Metro Vancouver's Home Sellers is impacting sales and price activity across the region.
3 key housing market indicators:
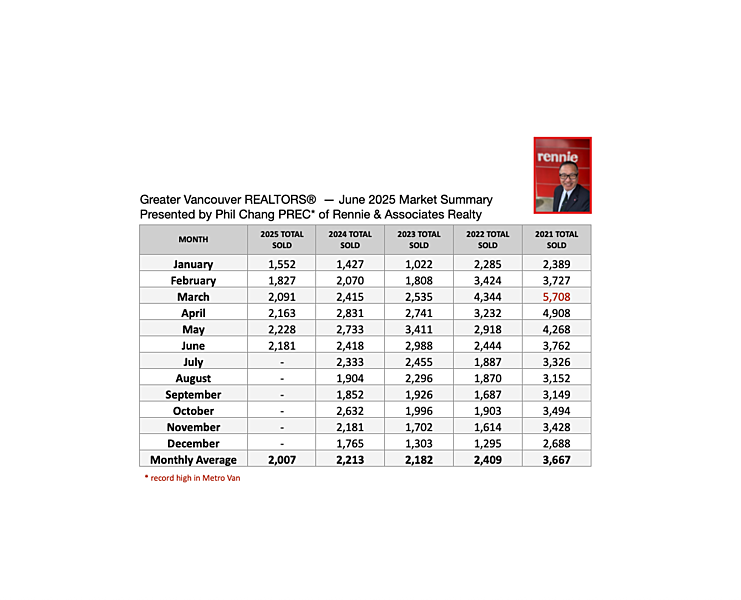
Sales: down 41.9% from February 2016 or 7.7% below the 10 year average
Listings: 7594 total listings in February 2017, up 5% from January 2017, and 4% higher from this time last year (Feb 2016)
However new listings are at a historic low for the month. Only 3666 new home listings were in February 2017, making it the lowest February of new listings in 14 years (since 2003).
Prices: benchmark price for all residential homes in Metro Vancouver is $906,700 in February 2017. This is up 1% from January 2017. and 14% up from February 2016. The 1% price increase from January is the first price gain we’ve seen in the past 6 months.
To undestand this, we review our Sales-To-Active Listings Ratio.
- 31.9% in February 2017
- 21.0% in January 2017
So to refresh your memory:
- A Buyer’s Market is when this ratio is below 12%.
- A Seller’s Market is when the ratio surpasses 20% for several months.


