Benchmark Prices - April 2019
Apr 08, 2019
Written by
Ryan BerlinSHARE THIS
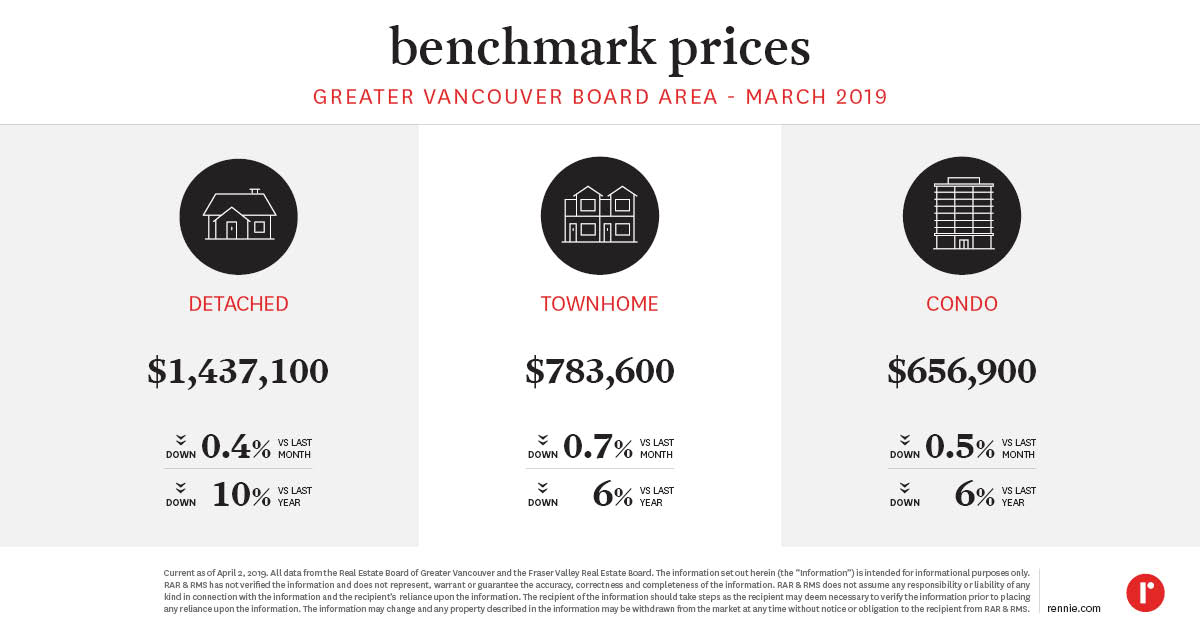
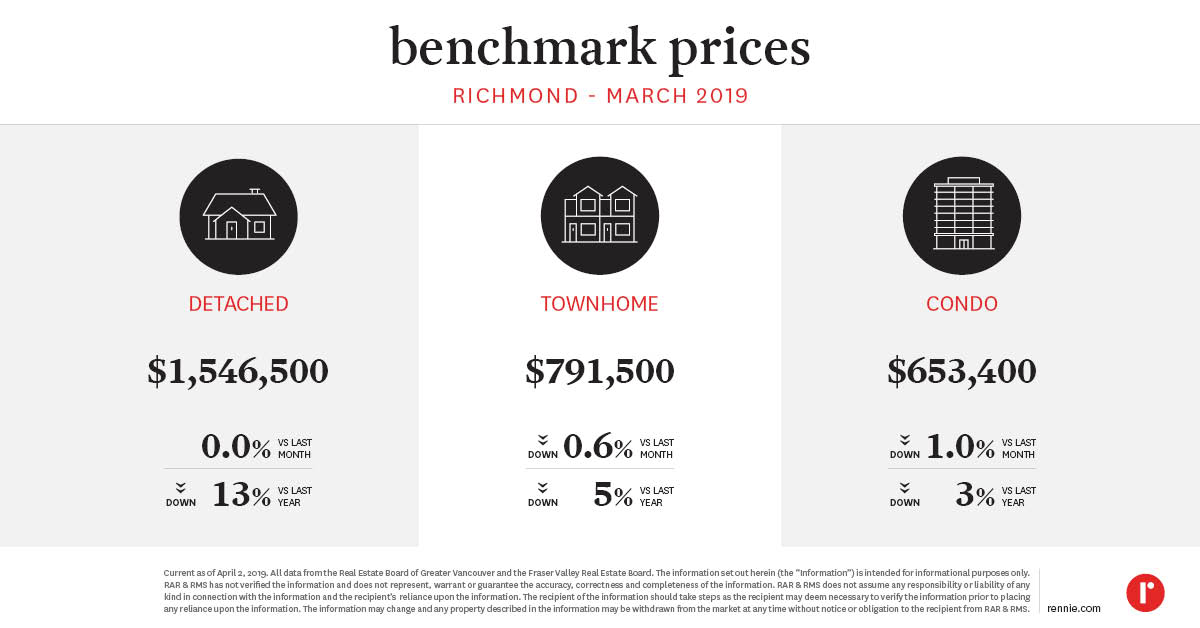
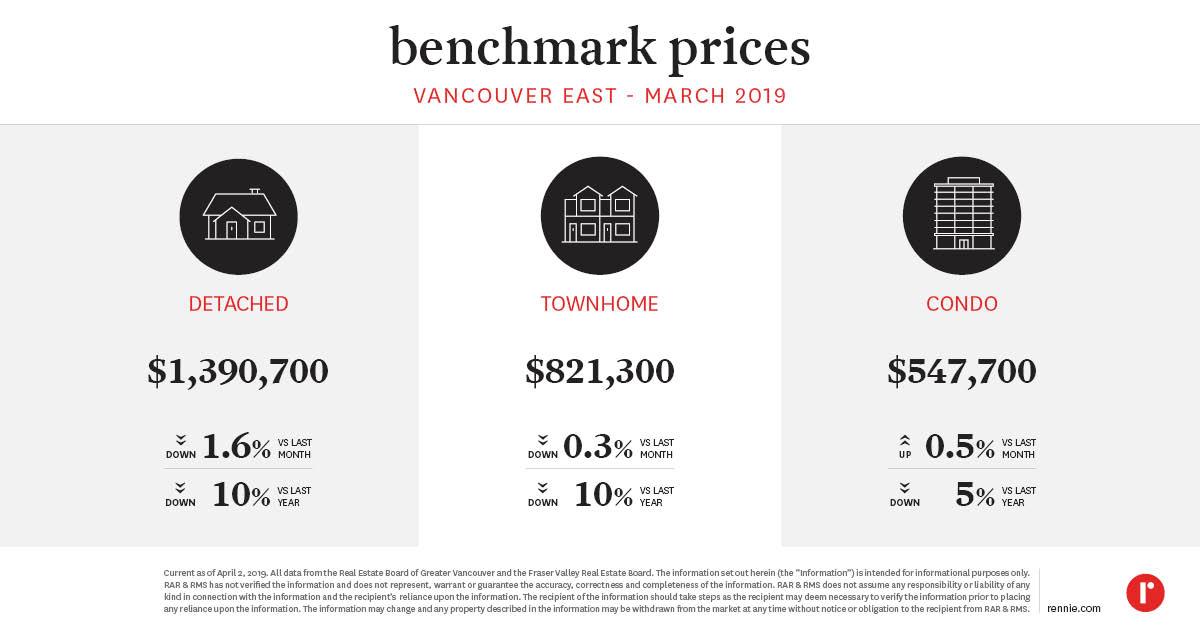
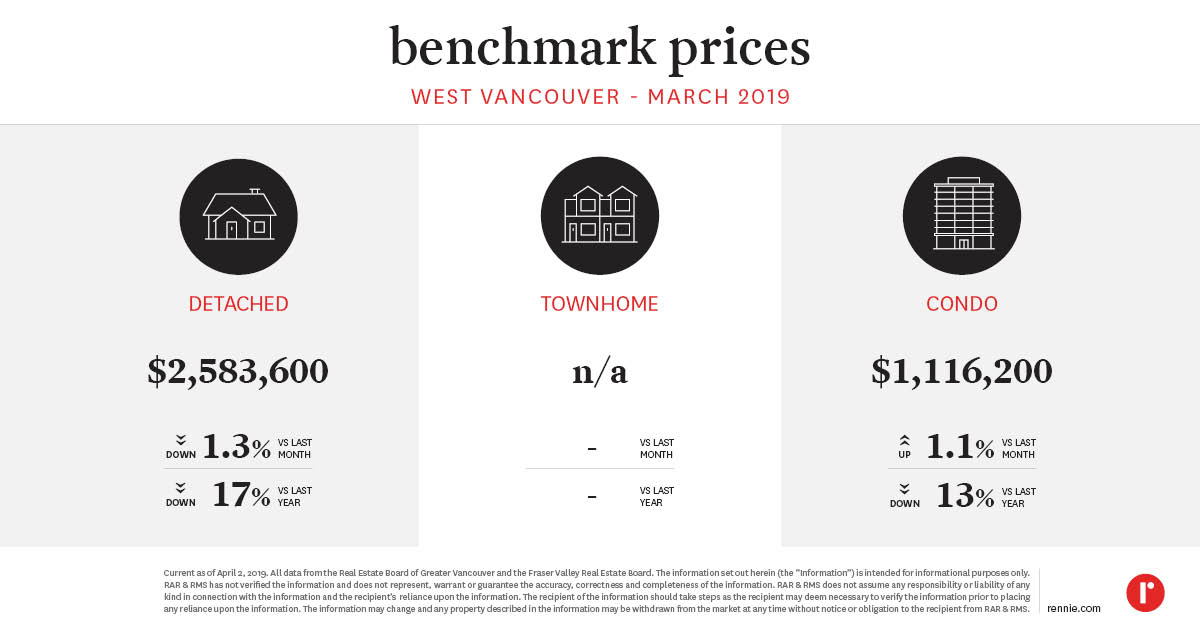
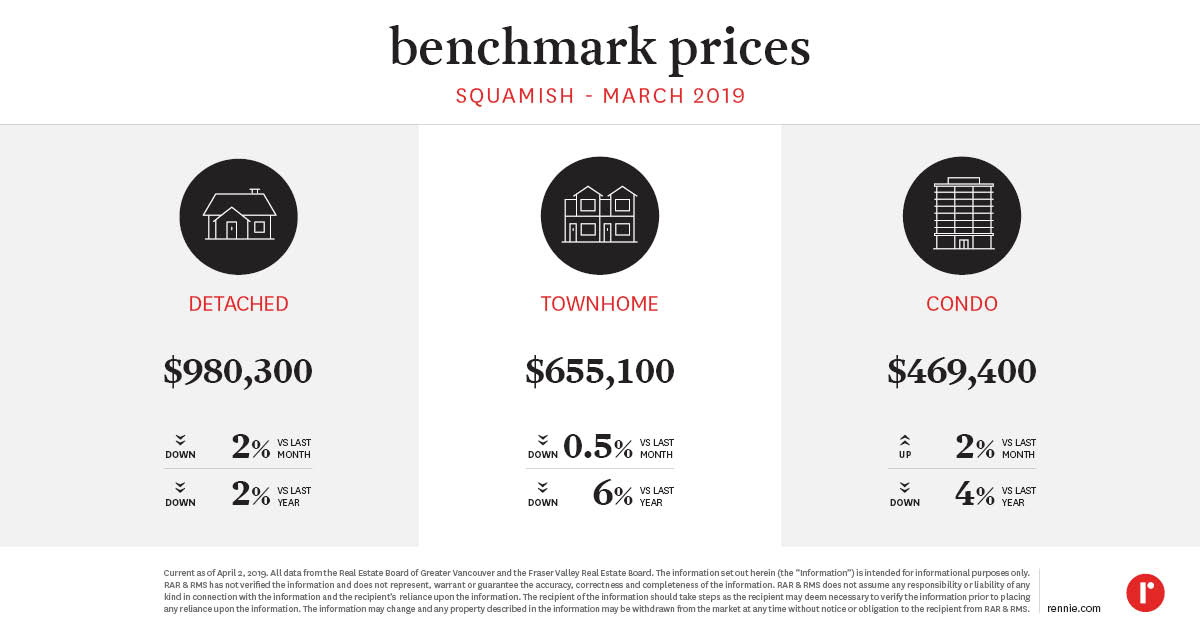
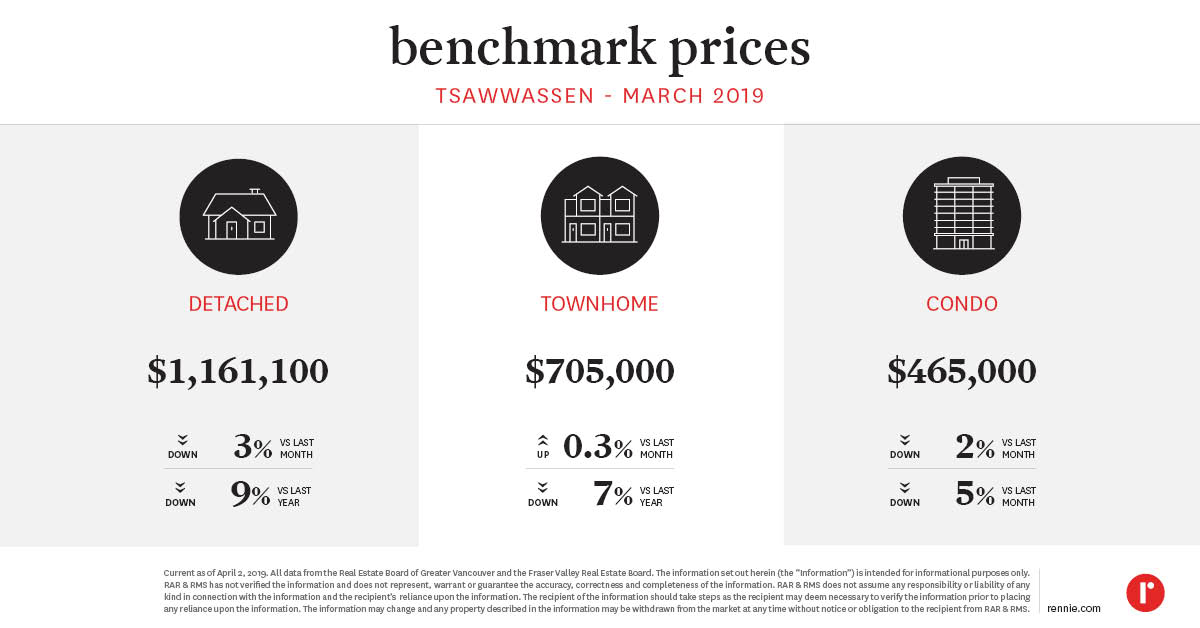
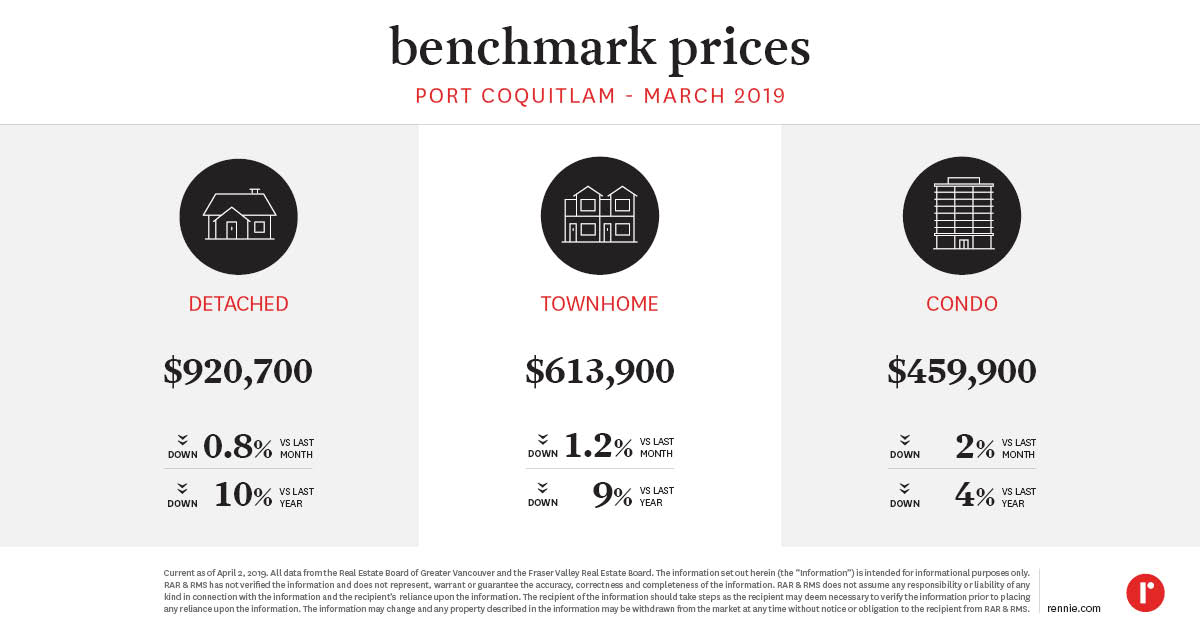
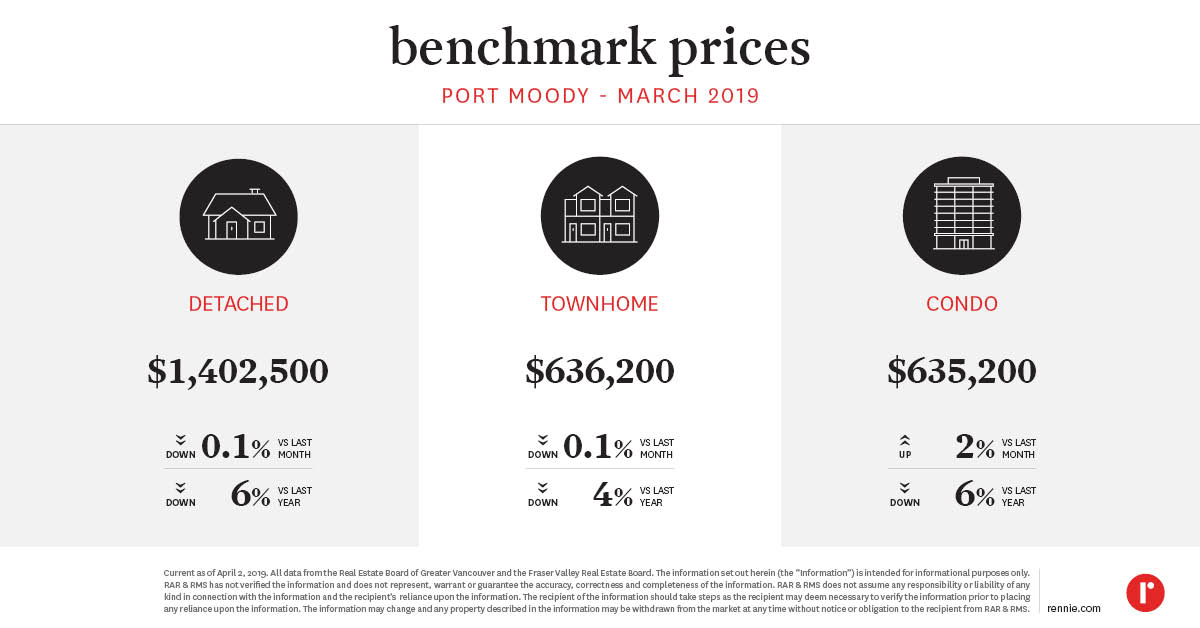
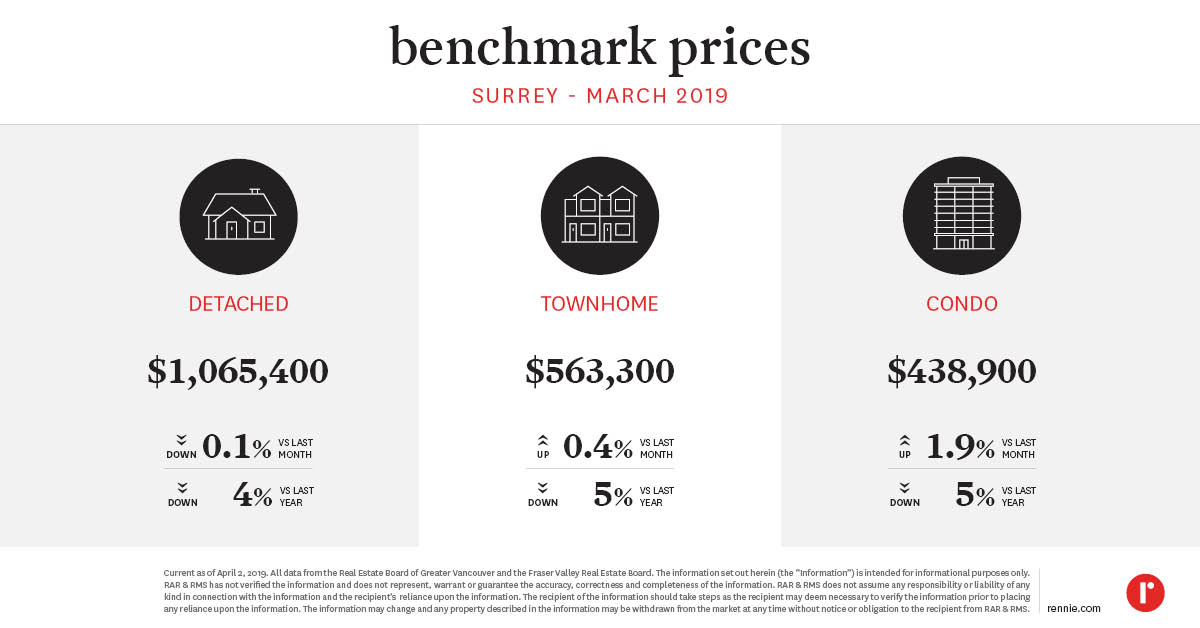
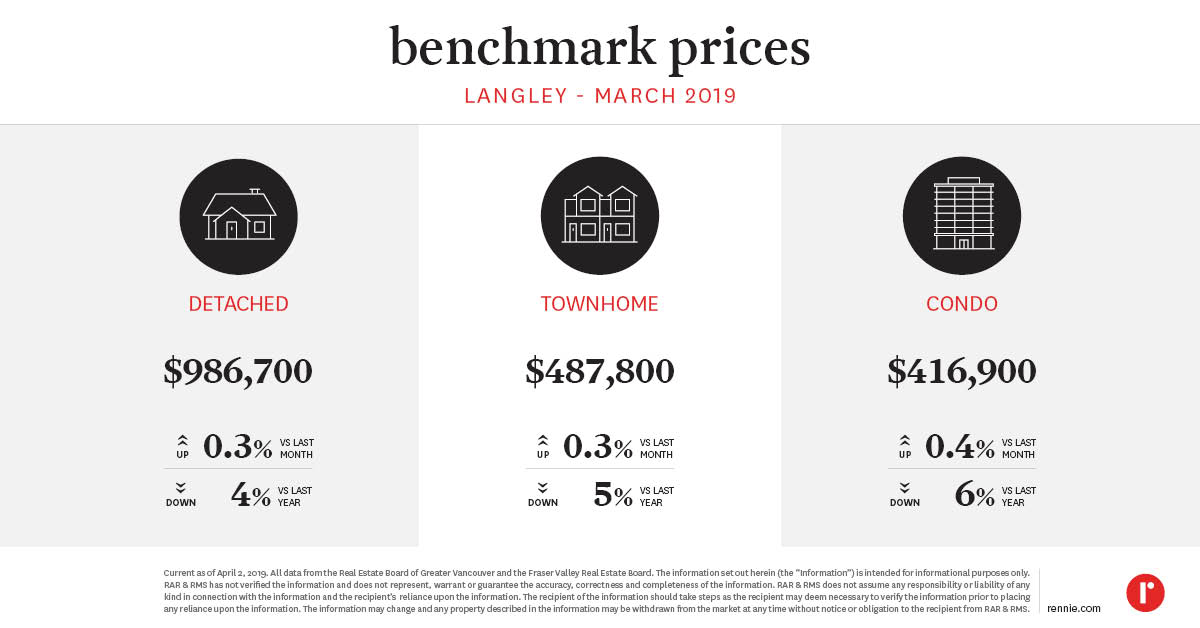
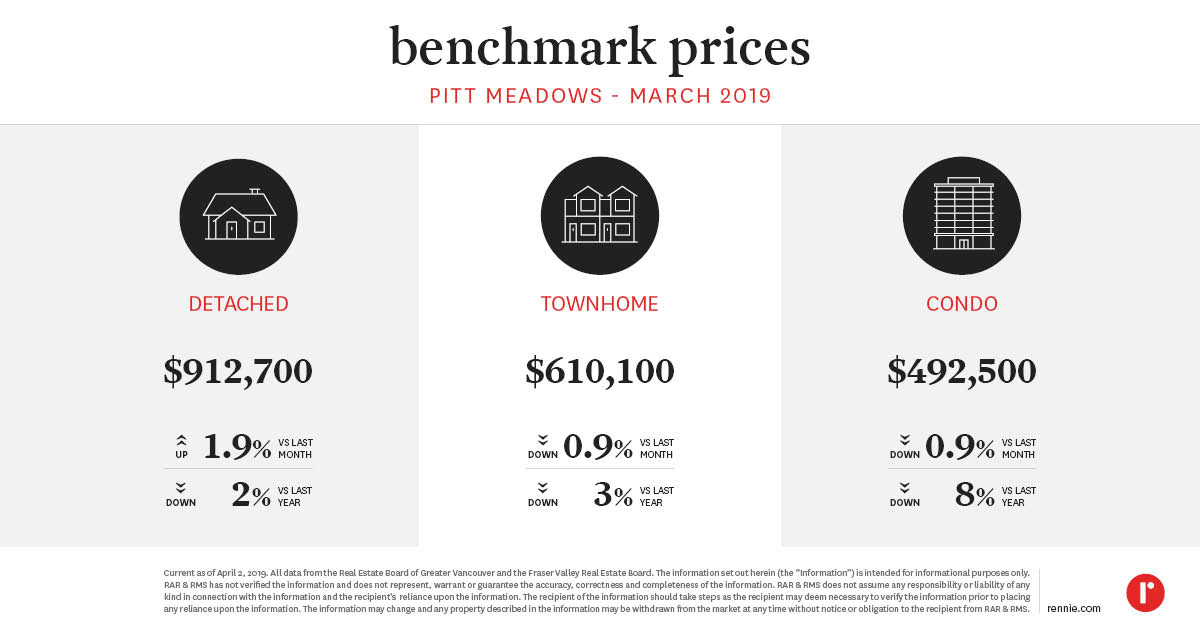
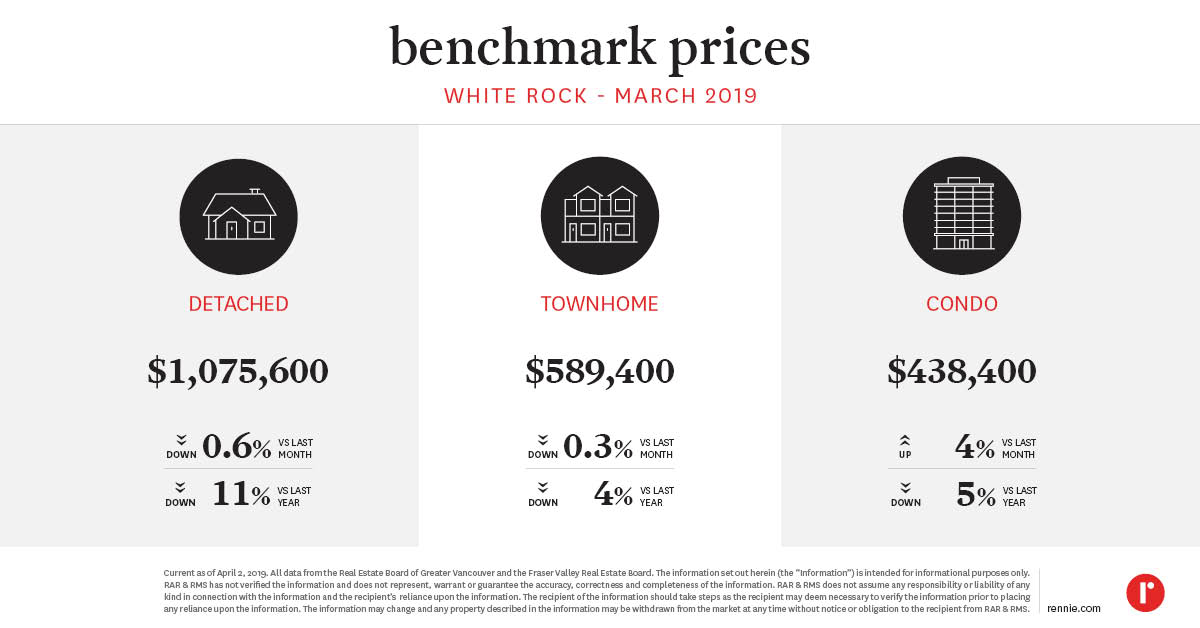
Here are the Benchmark Price Infographics for the areas of the Lower Mainland covered in the monthly rennie review. The areas include the REBGV, Burnaby East, Burnaby North, Burnaby South, Coquitlam, North Vancouver, Richmond, Vancouver East, Vancouver West, West Vancouver, New Westminster, Squamish, Tsawwassen, Port Coquitlam, Port Moody, FVREB, Surrey, Langley, Pitt Meadows, Maple Ridge, White Rock, Abbotsford, and CADREB.Greater Vancouver Board Area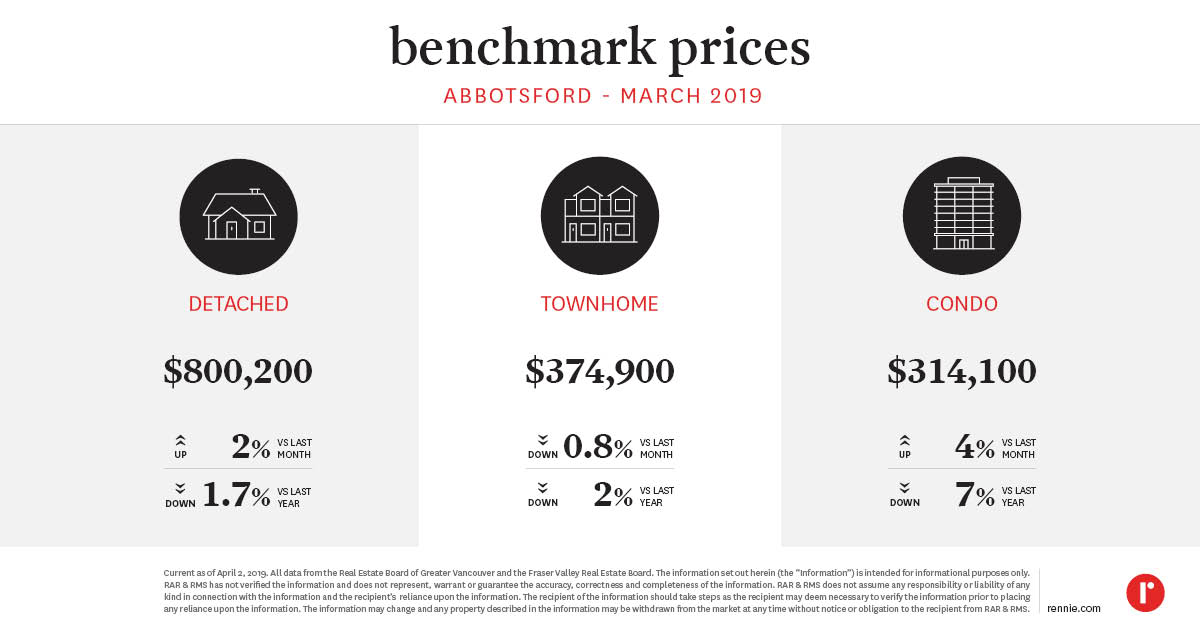 Chilliwack and District Board Area
Burnaby East

Burnaby North

Burnaby South

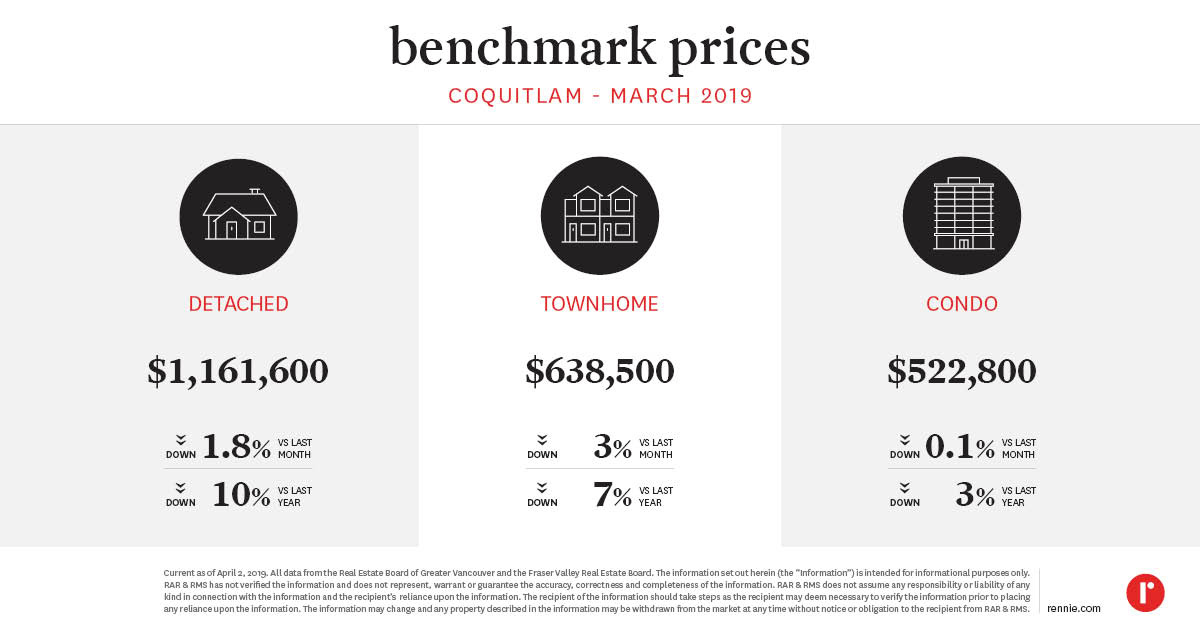
Coquitlam
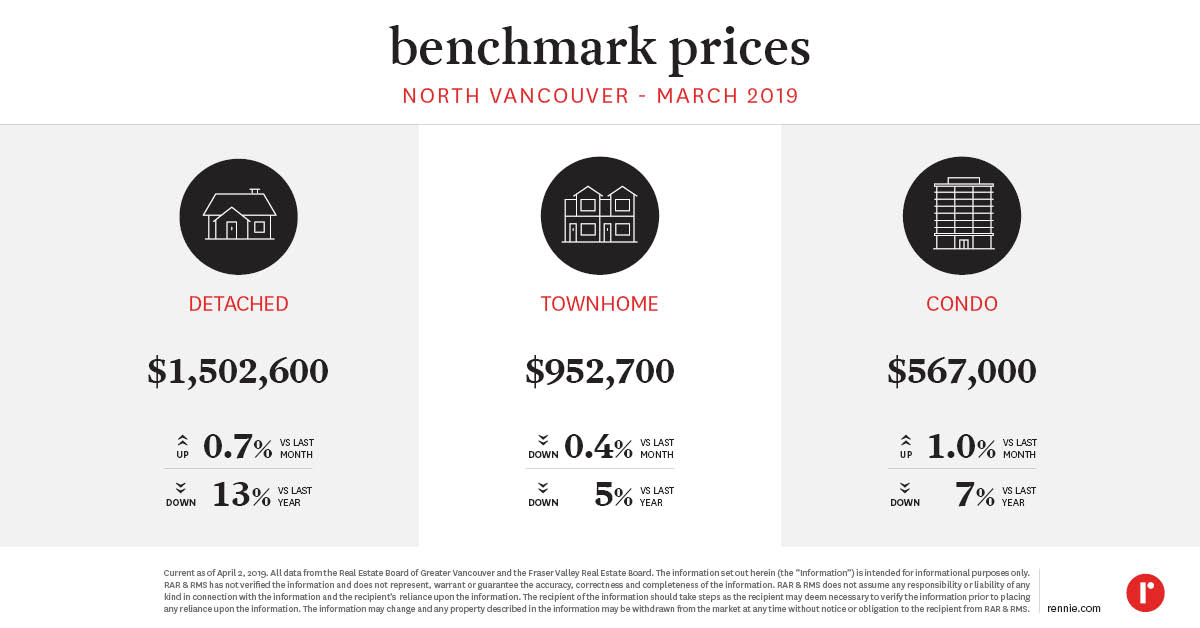
North Vancouver
Richmond
Vancouver East
Vancouver West

West Vancouver
New Westminster

Squamish
Tsawwassen
Port Moody


Chilliwack and District Board Area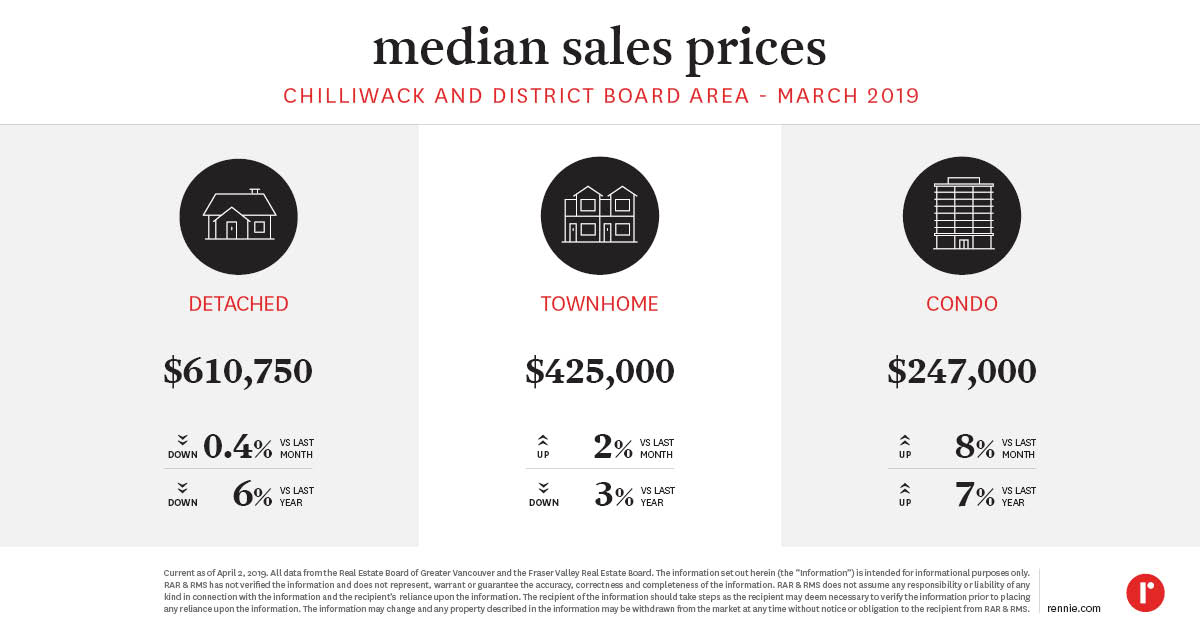
Written by
Ryan Berlin
Related
the san diego rennie review | April 2026
San Diego’s housing market remains stable, with middling sales accompanied by slowly-expanding inventory, as rising listing counts may have already peaked on a seasonally-adjusted basis. All eyes are on inflation and interest rates as the war in Iran drives up the price of oil across the globe.
Apr 2026
Report
the seattle rennie review | April 2026
Home sales in King County remain below long-run levels against a backdrop of expanded listing counts. The war in Iran presents new challenges for inflation and interest rates and, by extension, home buyers and sellers.
Apr 2026
Report