
It seems unfitting to begin an article discussing the Covid-19 pandemic as we are nearly a half-decade removed from the days of lockdowns and social distancing—but we promise, there’s good reason.
There has been much discussion surrounding the impact the pandemic had on where people chose to live, be it a temporary change or a more permanent departure. The reality is, Americans have been moving around the US—pandemic or not—for quite some time. Back in 2010, 15.4% of the population aged one and older moved in some way in the year prior, be it a move within the same county, from a different county, from a different state, or from abroad. Since then, there has been a steady decline in the share of population moving, falling to 13.6% by 2019 before declining to 12.5% in 2022 (the latest year for which this level of data is available). If we examine the population aged 18 to 44, almost 24% of that cohort moved one year prior back in 2010—this has now declined to approximately 20% as of 2022. Yes, people are moving less but that doesn’t mean people stopped moving altogether. What’s changing is the way in which people move.
Data from the US Census Bureau from 2010 to 2022 shows an annual decline in the share of those who moved within the same county (from a high of 9.4% in 2010, to 7.5% by 2019, and further to 6.2% in 2022). With this said, the share of those who moved from a different county within the same state has remained relatively unchanged over the past twelve years (at an annual average of 3.2%), while the share of those who moved from abroad has held steady (fluctuating between 0.6% and 0.7% in all but one year). Increasing over this timespan has been the share of individuals moving from a different state, rising from 2.2% in 2010, to 2.3% in 2019, and finally to 2.5% in 2022. Of course the pandemic, through remote work and a collective reassessment of the value one places on certain qualities in a home, provided greater flexibility for those intent on making a change, but the reality is moving to a new city, county, or state is not a novel idea.
To dive deeper into the movement of people, rennie intelligence is embarking on a series of publications analyzing population changes since 2010 across the 35 most populous metropolitan statistical areas (MSAs) in the country. An MSA, according to the US Census Bureau, is a “core area containing a substantial population nucleus, together with adjacent communities having a high degree of economic and social integration with that core”. In simpler terms, it’s an area of at least 50,000 people that encompasses a city and all of its surrounding communities that are economically, geographically, and culturally linked.
One constant narrative throughout the pandemic, and continuing to date, is the sun belt’s soaring population. Amongst the most populous 35 MSAs, sun belt cities composed nine of the top ten with respect to population growth between 2010 and 2022. As shown below, Charlotte had the largest relative increase in population, growing a whopping 56% (climbing from a population of 1.76 to 2.76 million). Heading further south, Austin’s population rose 40% (increasing from 1.73 to 2.42 million) while Orlando and Nashville grew 29% and 28%, respectively. Rounding out the top ten metropolitan areas for population change between 2010 and 2022 were three Texas cities (Dallas growing 24% and San Antonio and Houston each growing 23%), Indianapolis (22%), Phoenix (19%), and Las Vegas (19%).
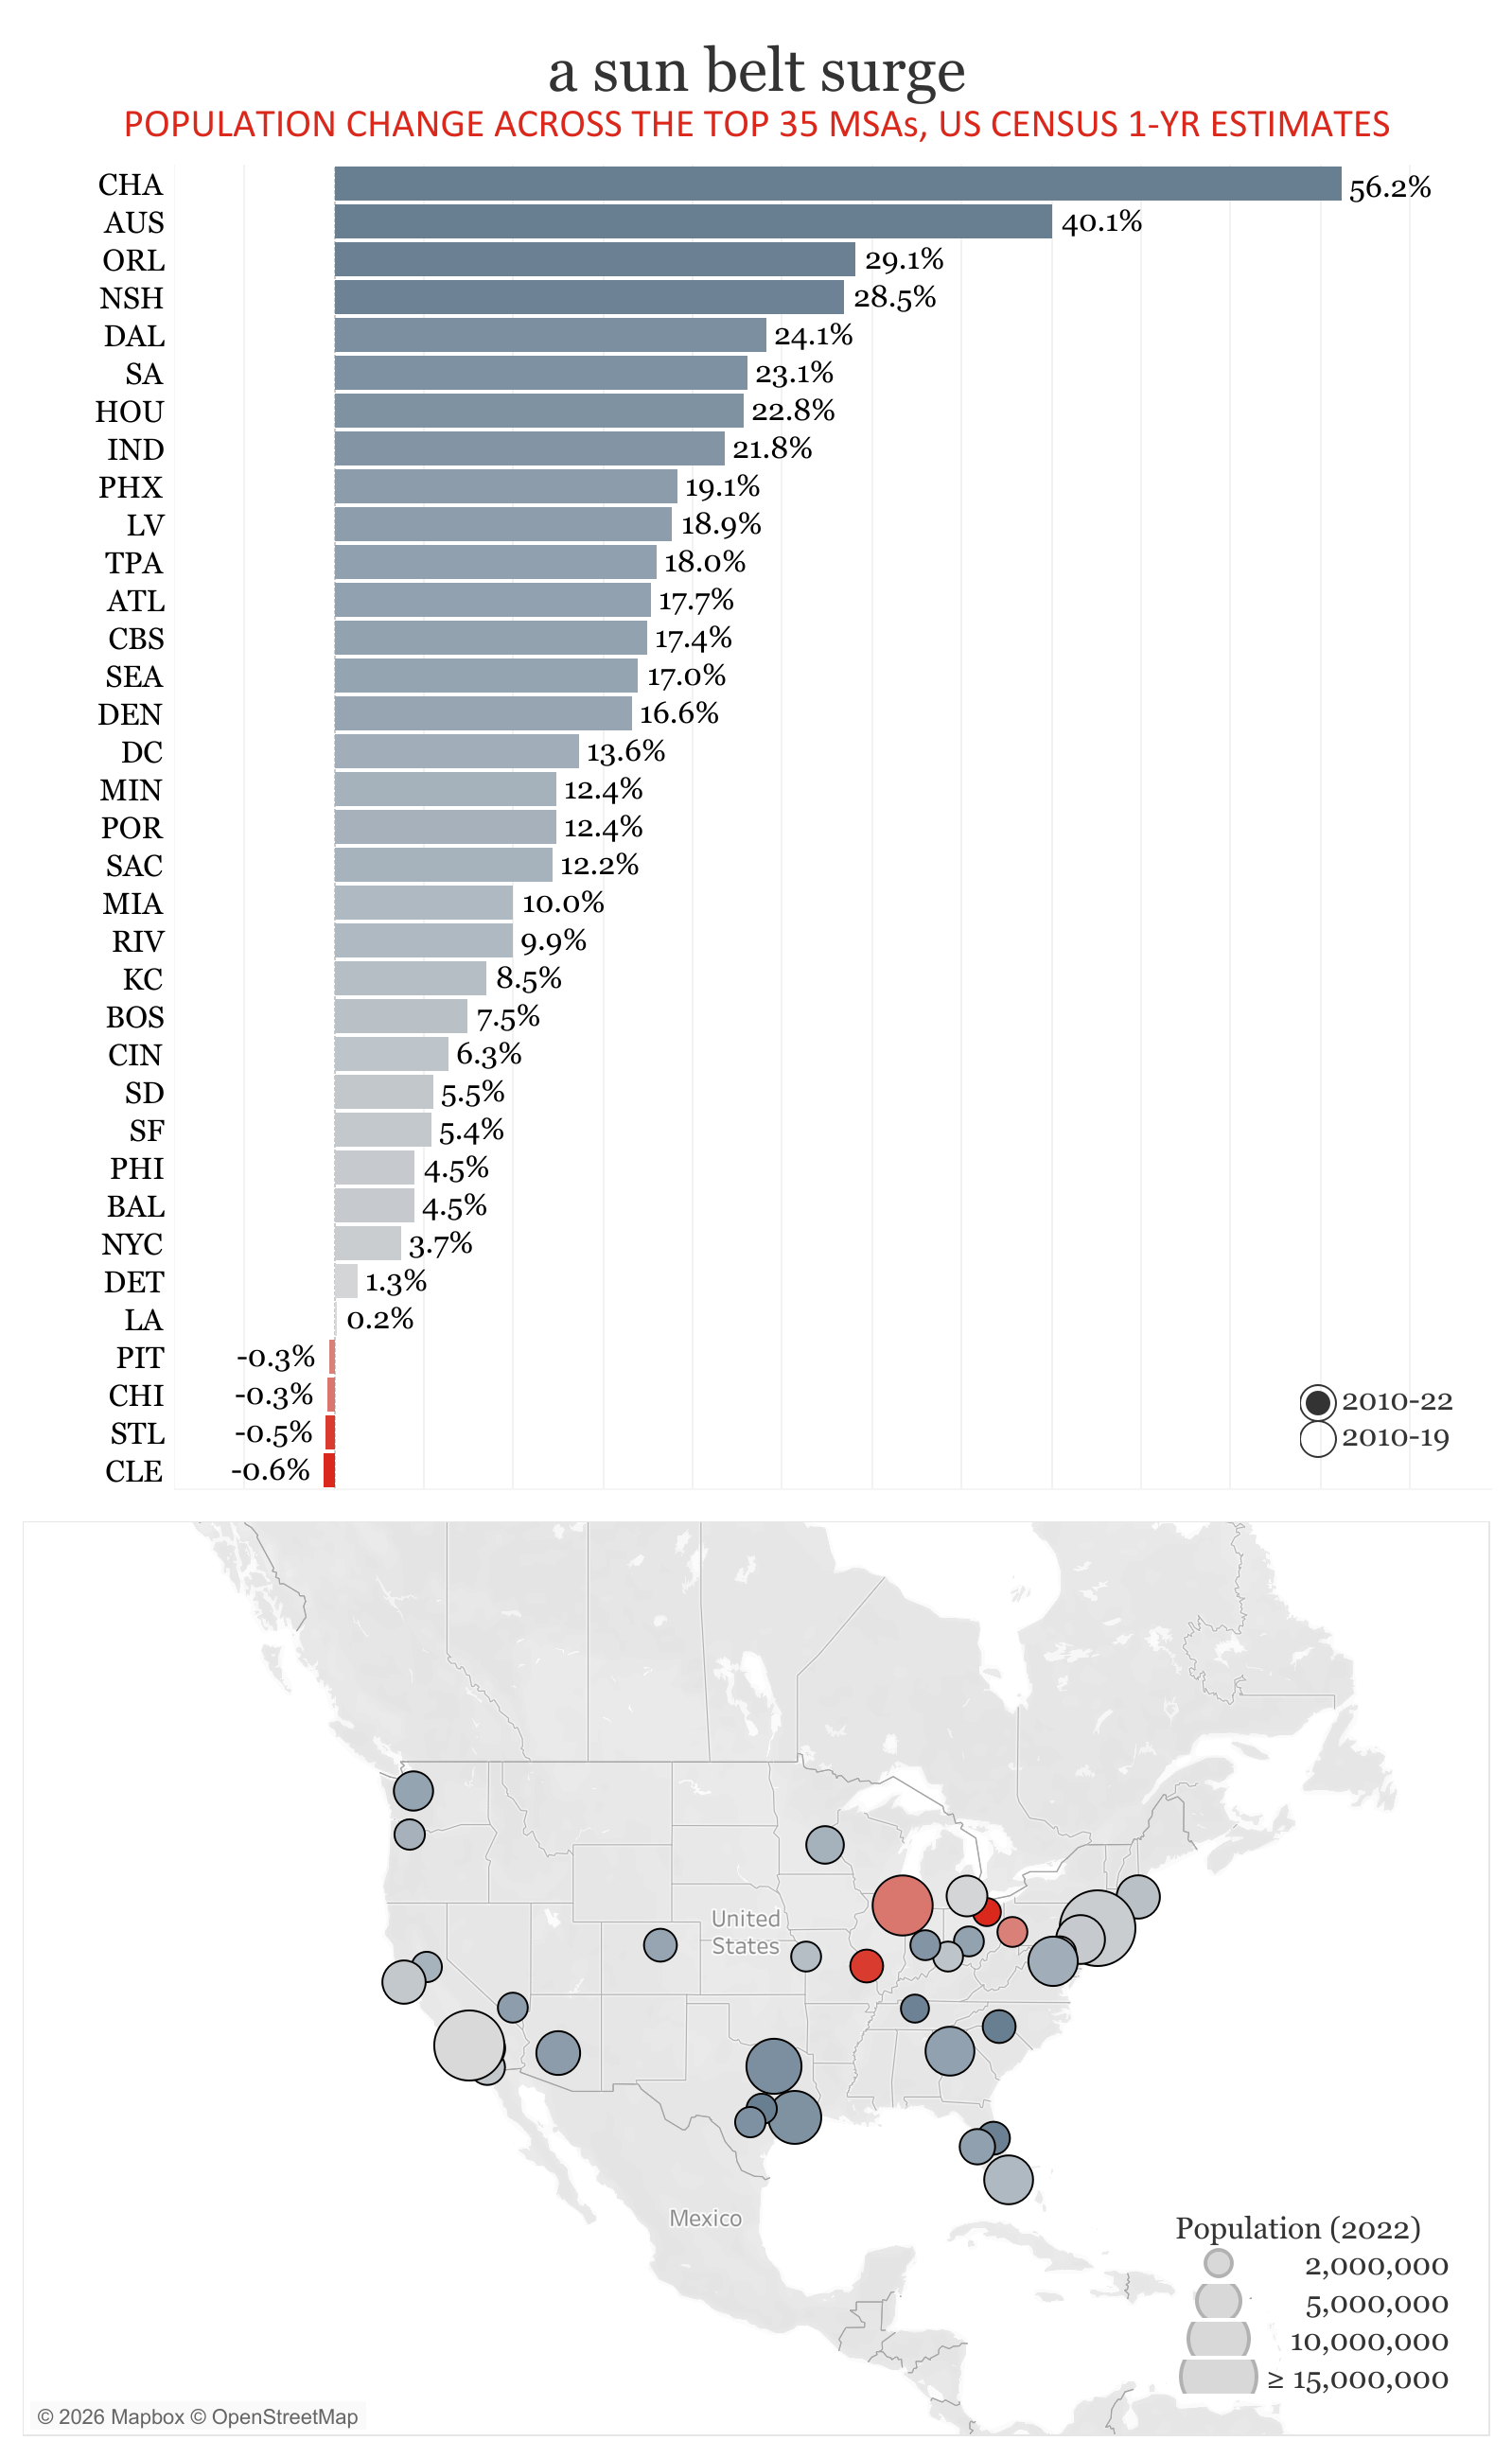
Conversely, there were four MSAs which realized a population decrease between 2010 and 2022: Cleveland losing 12,626 people (a decrease of 0.6%), St. Louis losing 15,340 people (a decrease of 0.5%), and Chicago and Pittsburgh losing 32,052 and 7,209 people, respectively (each experiencing a decrease of 0.3%). The country’s two most populous cities realized minimal population increase during this decade-plus period: New York City growing 4% and Los Angeles growing 0.2%. Notably, using the toggle above one can see how the phenomenon of population gains being realized across sun belt MSAs had begun prior to the pandemic; between 2010 and 2019, the top ten and bottom four are composed of the exact same cities.
While estimates for 2023 are available for MSAs, the most recent year for which components of population change are available is 2022. These components are critical for understanding how these metropolitan areas have transformed, be it the age profile of residents or the origin of the population. As rennie intelligence embarks on a journey exploring these elements, we hope readers gain a deeper understanding of the country’s largest cities and how shifts in their population have secondary effects—including on the housing landscape.
*Note: The US Census Bureau's standard 1-year estimates from the 2020 American Community Survey were not released due to the Covid-19 pandemic.