
- Spurred by the pandemic, the proportion of people who worked from home in Metro Vancouver increased to 27% in 2021, up from 8% in 2016.
- The number of workers commuting to the City of Vancouver declined by 35% in the 2021 census compared with 2016, reducing daytime populations and foot traffic in what were previously concentrated employment centres.
In an ongoing effort to distinguish foundational economic and demographic trends from pandemic-induced ones, we recently released a piece on how commuting flows in Metro Vancouver changed between the 2016 and 2021 Census counts.
Building on these data, we’ve now begun to look into changing employment structures within the region and what some of the implications of the timing of the Census (conducted in May 2021 in the midst of the pandemic) could be for the “place of work” employment counts. So, before our small-area place of work data arrives and we start rummaging through the tabulations, we felt that it was useful to refresh our understanding of certain features of the Census data, and some of the different aspects of our communities that the Census reports on—namely, the patterns of, and changes in, workplace locations.
The Census & Places of Work
Every five years in early May, Statistics Canada aims to enumerate 100% of the people living in Canada. This “short-form” Census yields counts of people and homes; residents’ ages and sexes; household family and marital structures; language(s) spoken; and characteristics of the Indigenous population. In addition to this, 1 in 4 households are required to fill out a more in-depth survey (the “long-form questionnaire”) that collects a broader range of socio-economic information that helps paint a detailed picture of how our communities are evolving.
As part of this long-form questionnaire, residents are asked where they typically work: at home, at a usual place outside the home, at no fixed workplace, or outside Canada. For those with a usual place of work outside the home, the Census asks for the respondent’s workplace address, the sector of the economy (industry and occupation categories) that best aligns with the respondent’s job, and about various features of the respondent’s commute to and from their workplace. We’ll get to the group of commuters in a moment; first, let’s take a look at those working from home.
Homing Our Crafts
In 2016, 105,000 of the 1.28 million employed residents of Metro Vancouver (8%) worked from home, ranging from 6.3% in Surrey to almost a quarter of those (24%) on Bowen Island.
Over the subsequent five years, the number of employed residents in the region grew by almost 65,000 (5%), with—not surprisingly—a much higher proportion of people working from home than in 2016, due to the pandemic. At 27%, the share of work-at-homes in 2021 was almost 3.5 times that seen in 2016. In nominal terms, the number of people working at home increased by more than a quarter of a million people over the five-year period.
Metro Vancouver ‘A’ (encompassed mostly by UBC), saw the greatest relative increase in the number of people working from home (4.8 times the 2016 count by 2021), followed by New Westminster (4.7 times), and Burnaby (4.5 times). The largest numerical increase occurred in the City of Vancouver—the region’s most populous and job-rich municipality—with 91,910 more people working at home in 2021 than in 2016.
(Un)Usual Places of Work
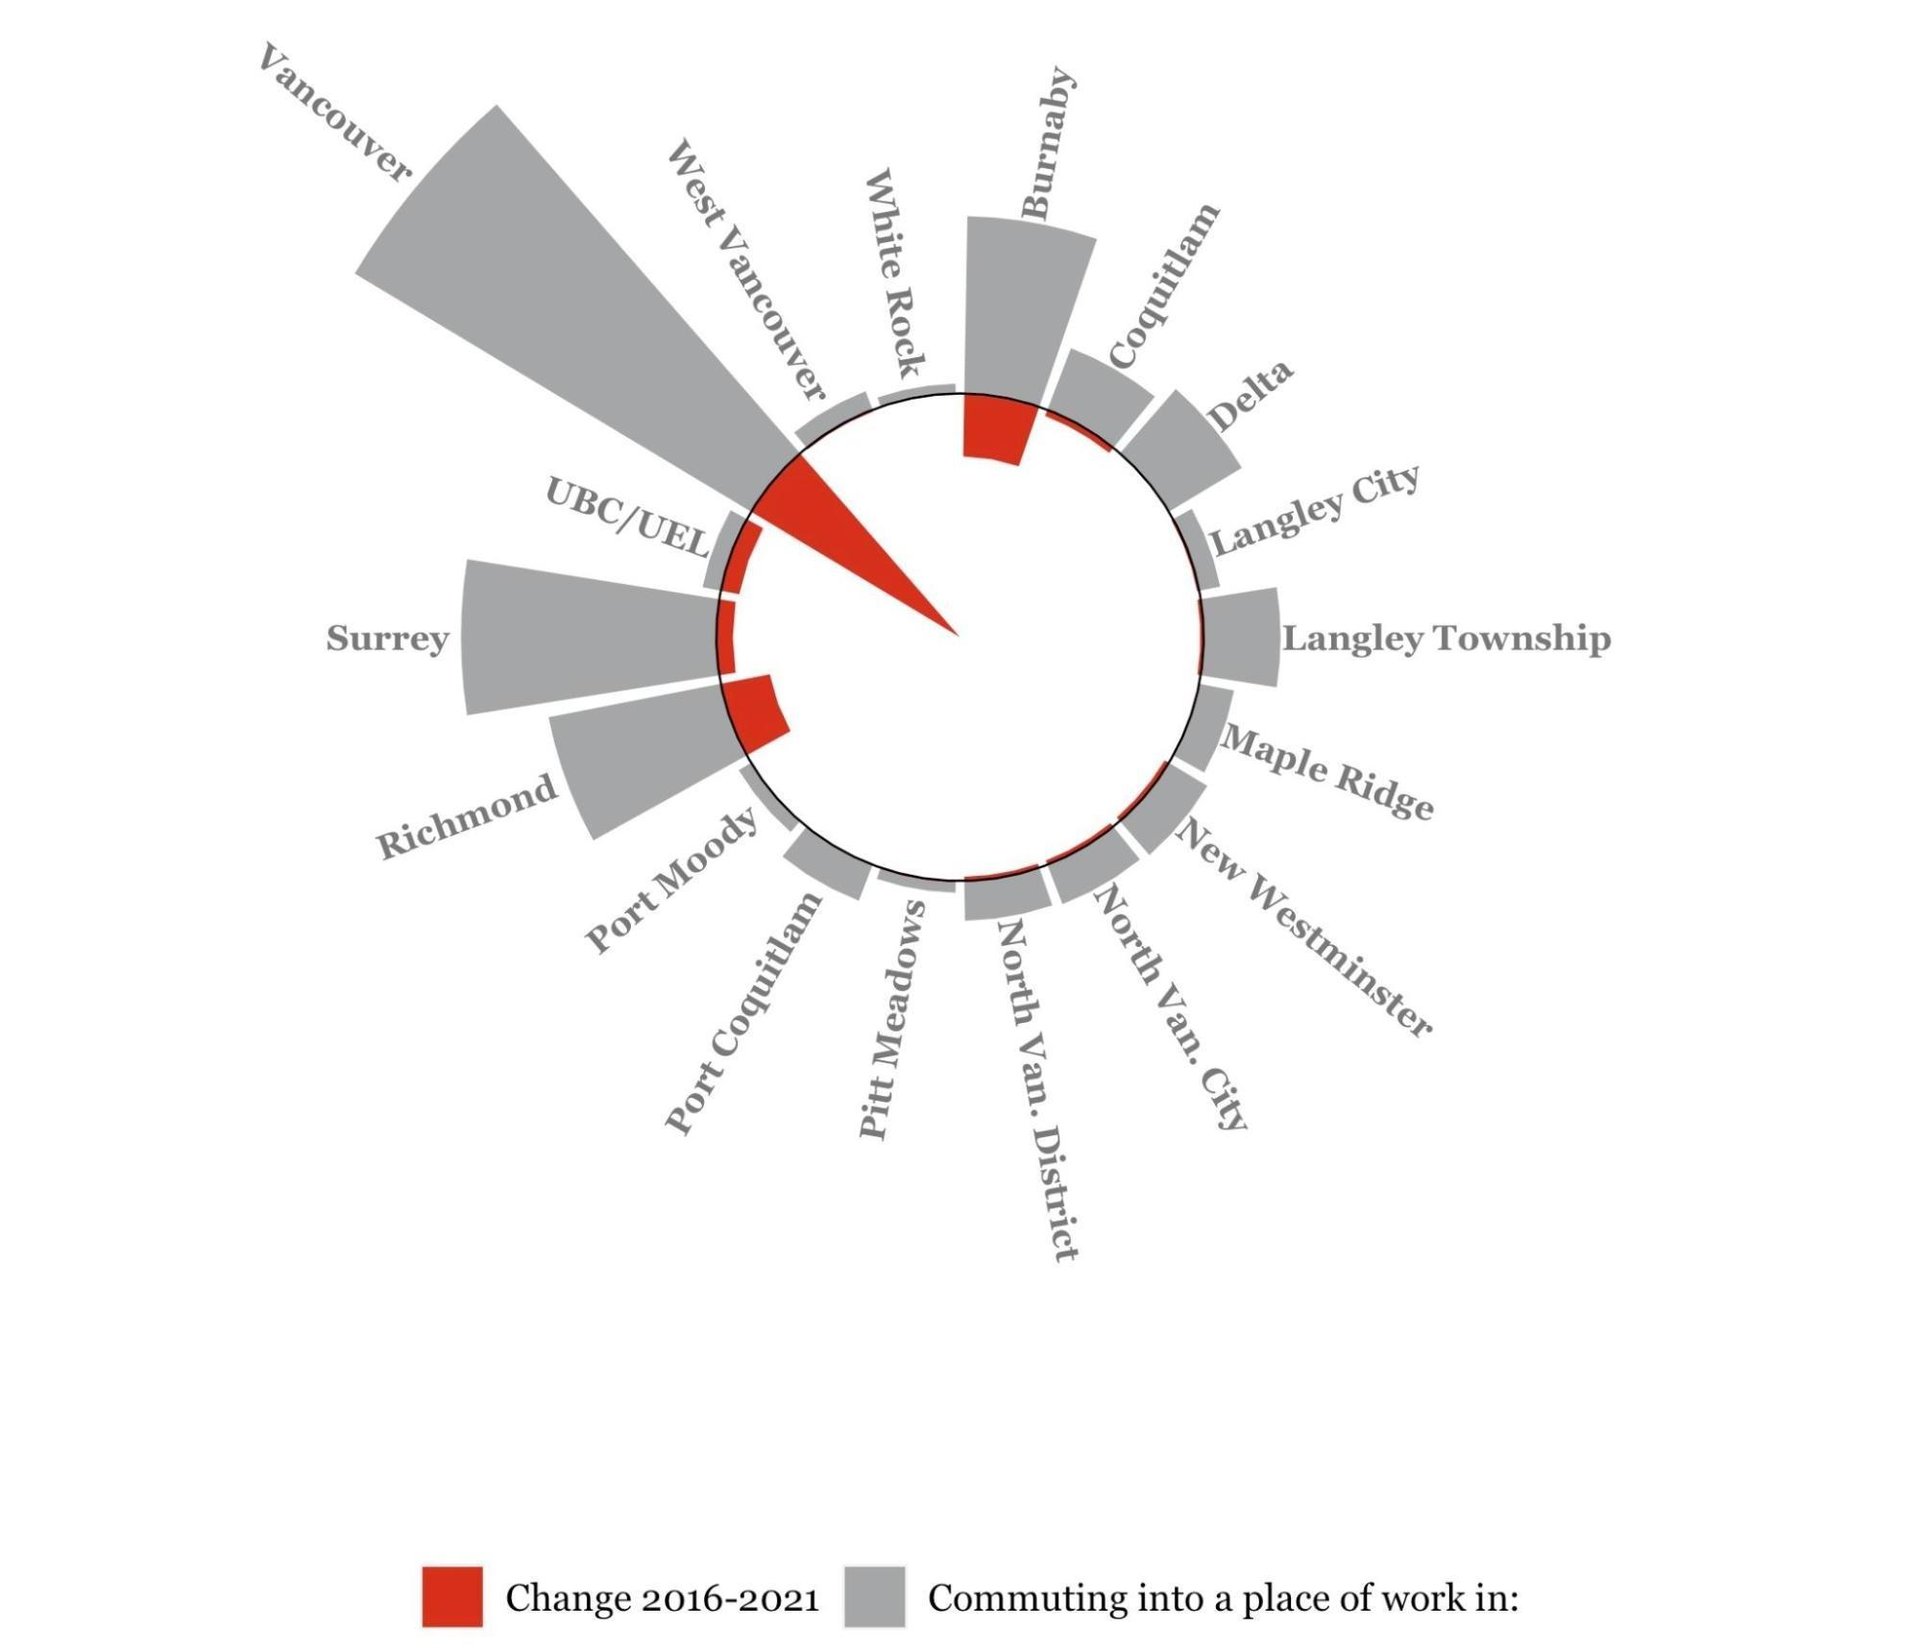
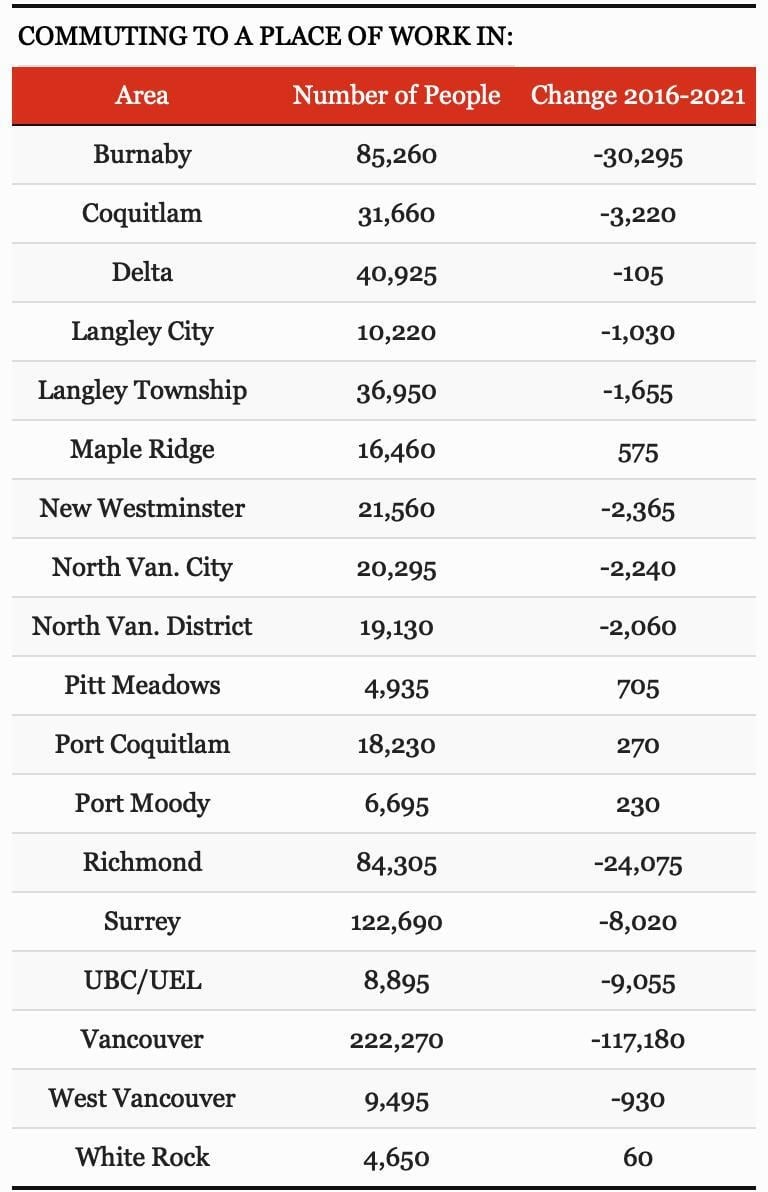
The still-evolving era of ‘working from home’ and lifestyles of more flexible workplaces and times has profound implications for (among others) community planners, economic development officers, and transportation engineers. As an example, the number of jobs situated in the City of Vancouver to which people regularly commuted from other Metro Vancouver municipalities—including the City of Vancouver itself—was 222,270 in 2021 (there were another 99,000 people who commuted to the City from outside of Metro Vancouver in 2021). When compared to 2016 this represents a whopping 117,000 decline.
This 35% decline in the number of usual places of work outside the home in the City has been tied to a host of other data from downtown foot traffic to office vacancy rates to paint a picture of shifting commuting patterns and daytime populations.
While we await more detailed custom tabulations of employment counts by place of work from Statistics Canada to arrive, it may be the case that the 2021 Census data prove to be less useful in tracking longer-term patterns of change in the landscape of our workplaces within the region. To this end, we may ultimately need to rely on a broader range of data sources and other creative approaches to supplement the 2021 counts.
Our rennie intelligence team comprises our in-house demographer, senior economist, and market analysts. Together, they empower individuals, organizations, and institutions with data-driven market insight and analysis. Experts in urban land economics, community planning, shifting demographics, and real estate trends, their strategic research supports a comprehensive advisory service offering and forms the basis of frequent reports and public presentations. Their thoughtful and objective approach truly embodies the core values of rennie.