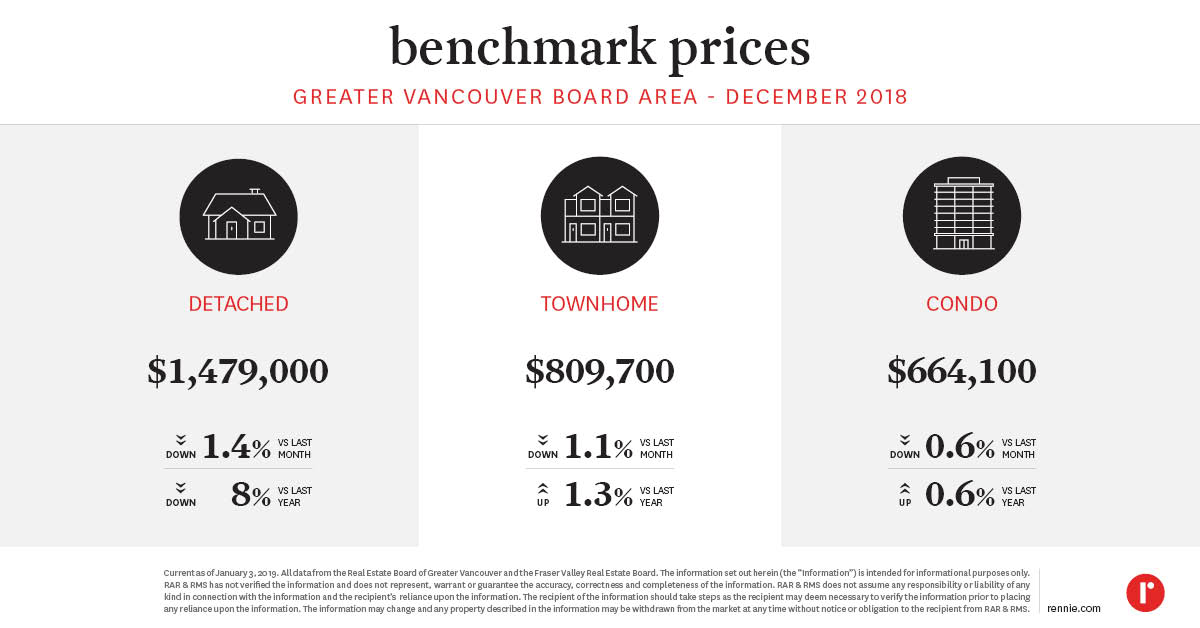
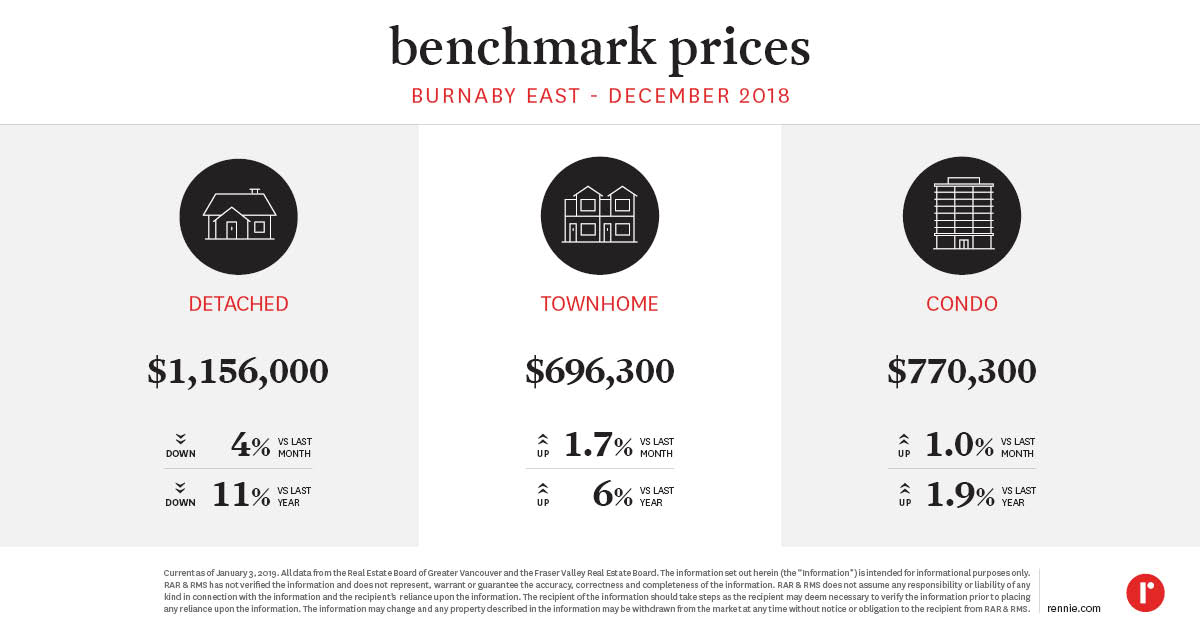
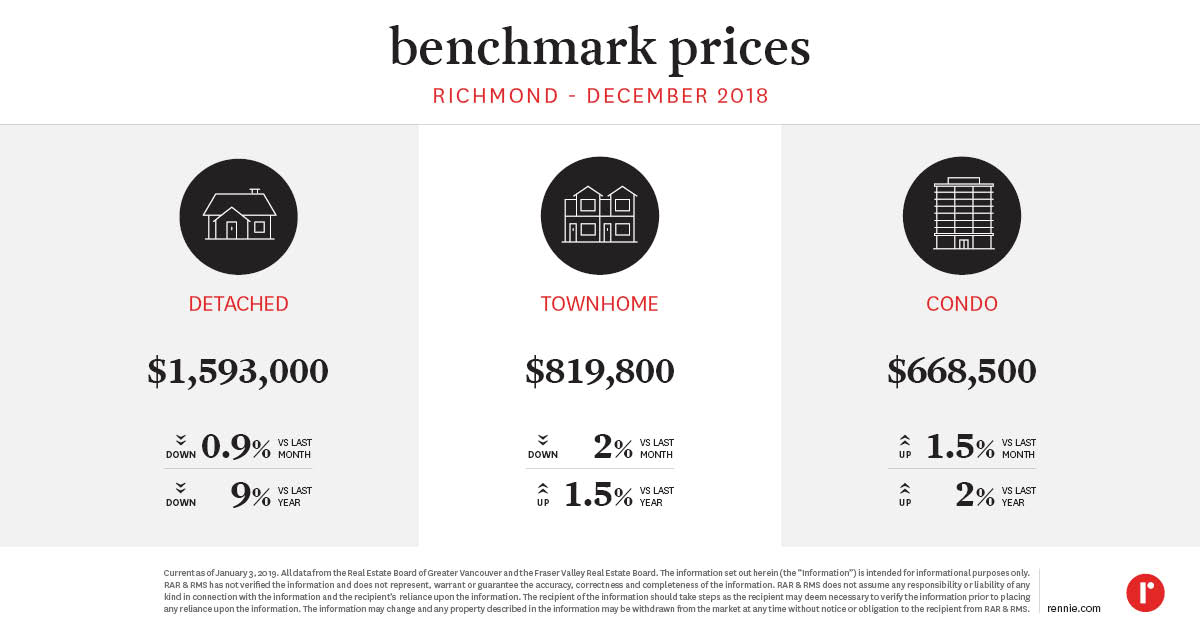
Here are the Benchmark Price Infographics for the areas of the Lower Mainland covered in the monthly rennie review. The areas include the REBGV, Burnaby East, Burnaby North, Burnaby South, Coquitlam, North Vancouver, Richmond, Vancouver East, Vancouver West, West Vancouver, Squamish, Tsawwassen, Port Coquitlam, Port Moody, New Westminster, Surrey, Langley, Pitt Meadows, Maple Ridge, White Rock, and Abbotsford.
Real Estate Board of Greater Vancouver
Burnaby East
Burnaby North

Burnaby South

Coquitlam

North Vancouver

Richmond
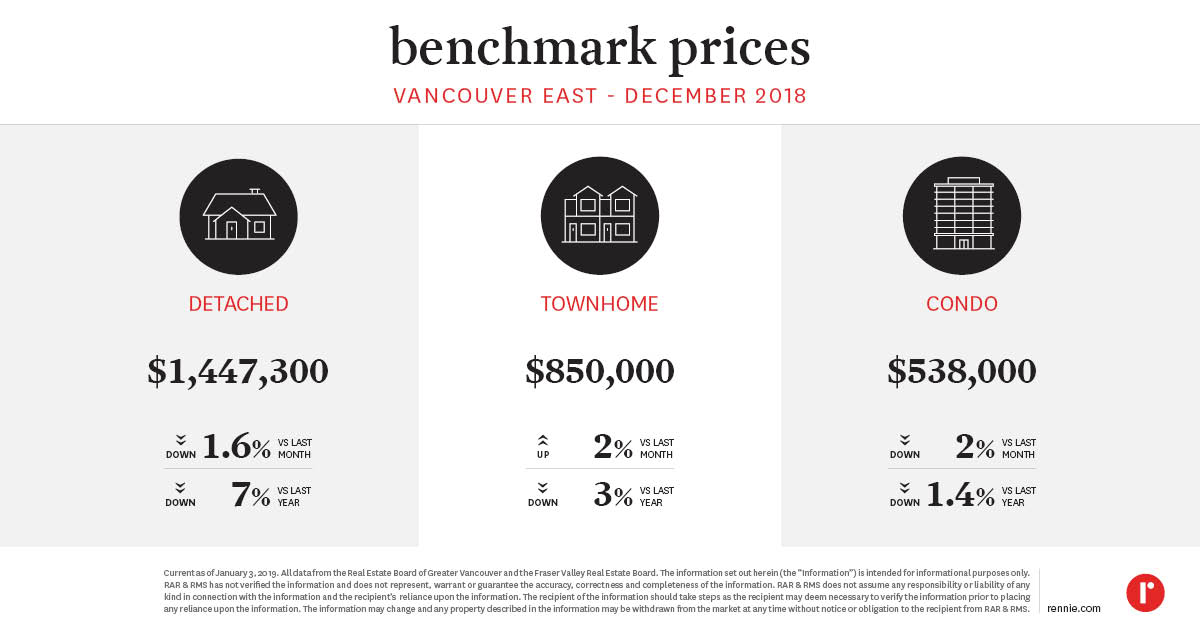
Vancouver East
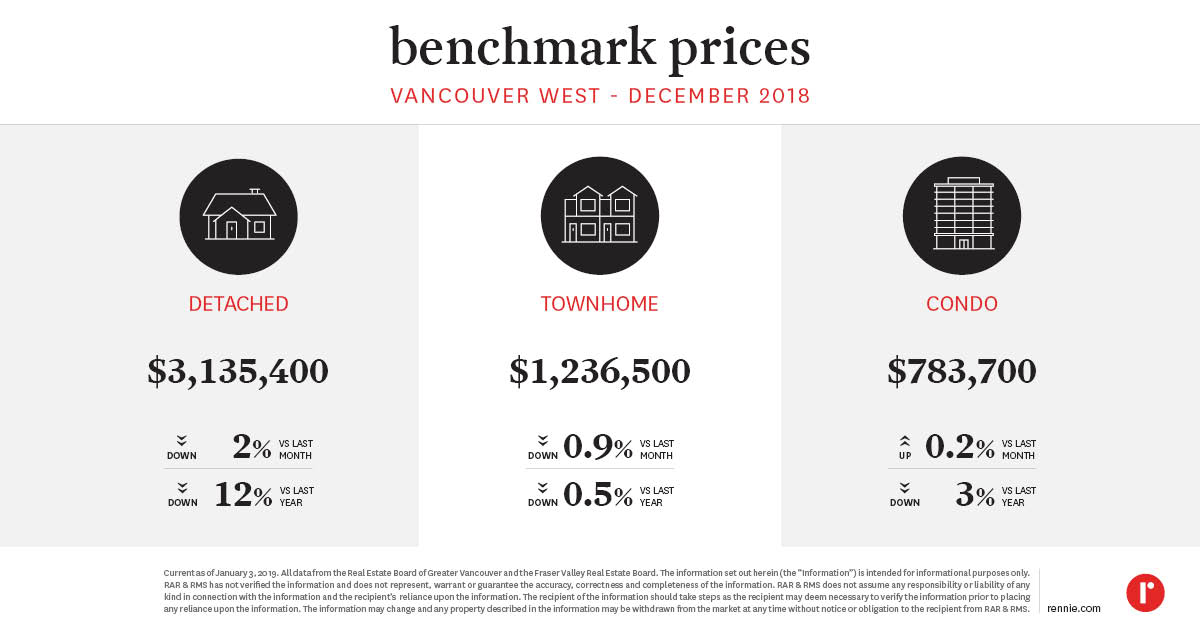
Vancouver West
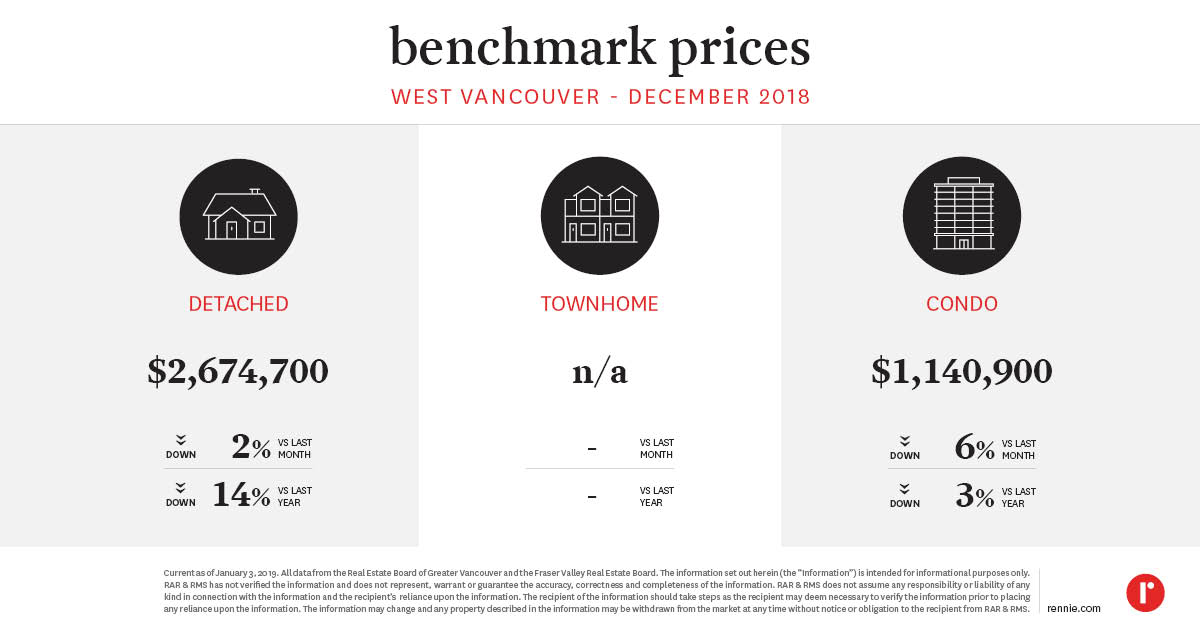
West Vancouver
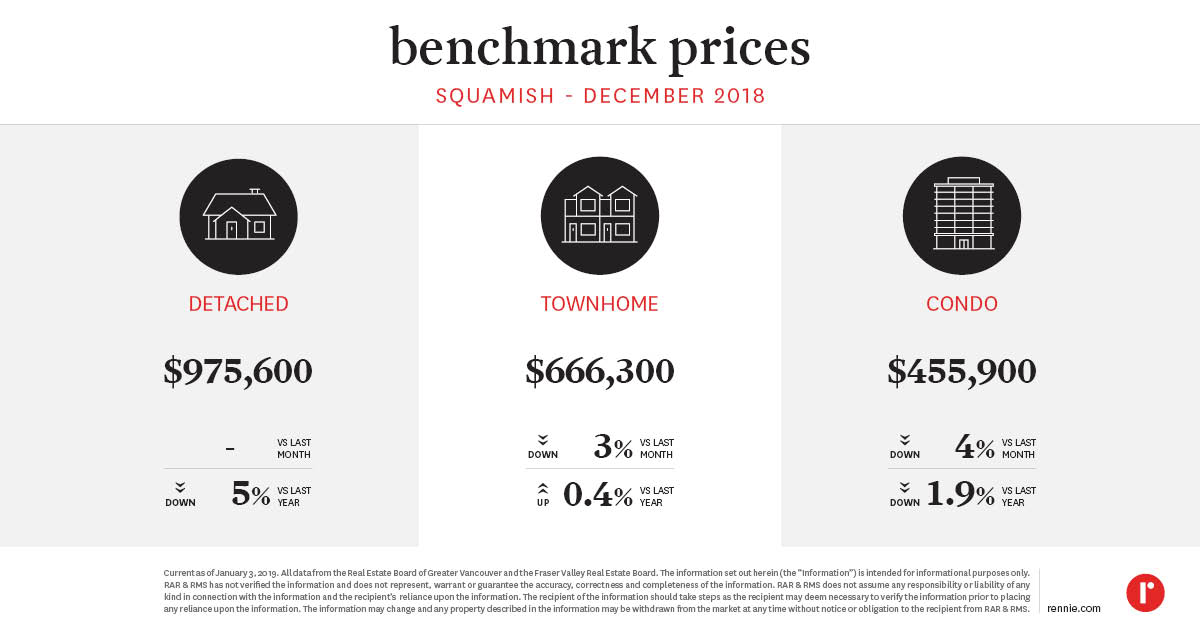
Squamish
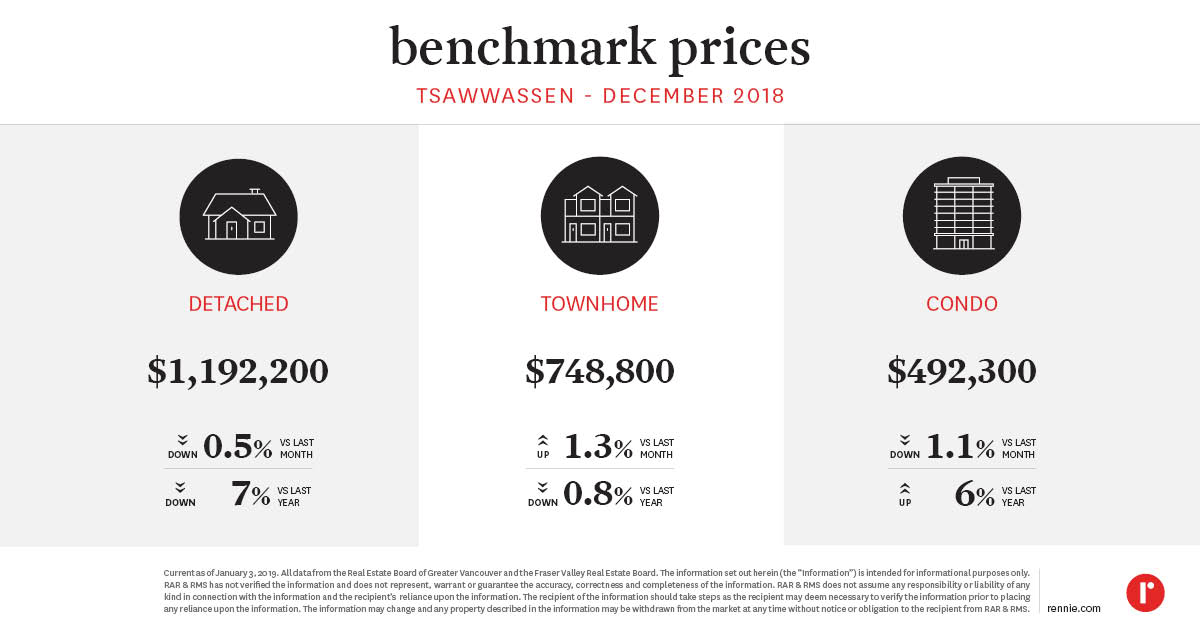
Tsawwassen
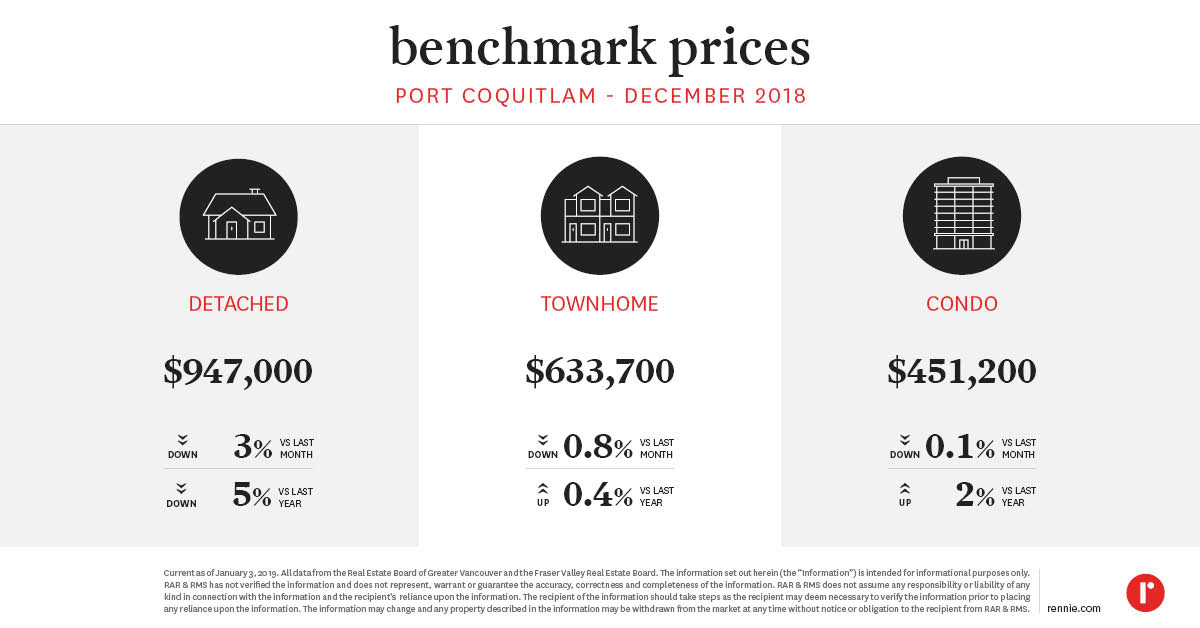
Port Coquitlam
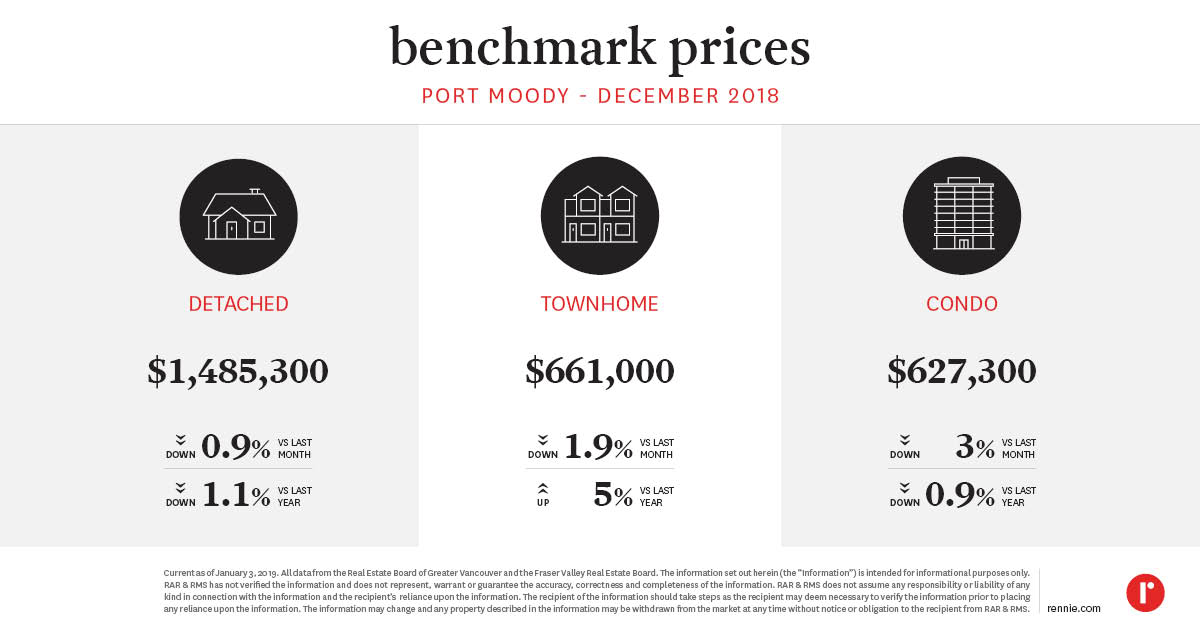
Port Moody
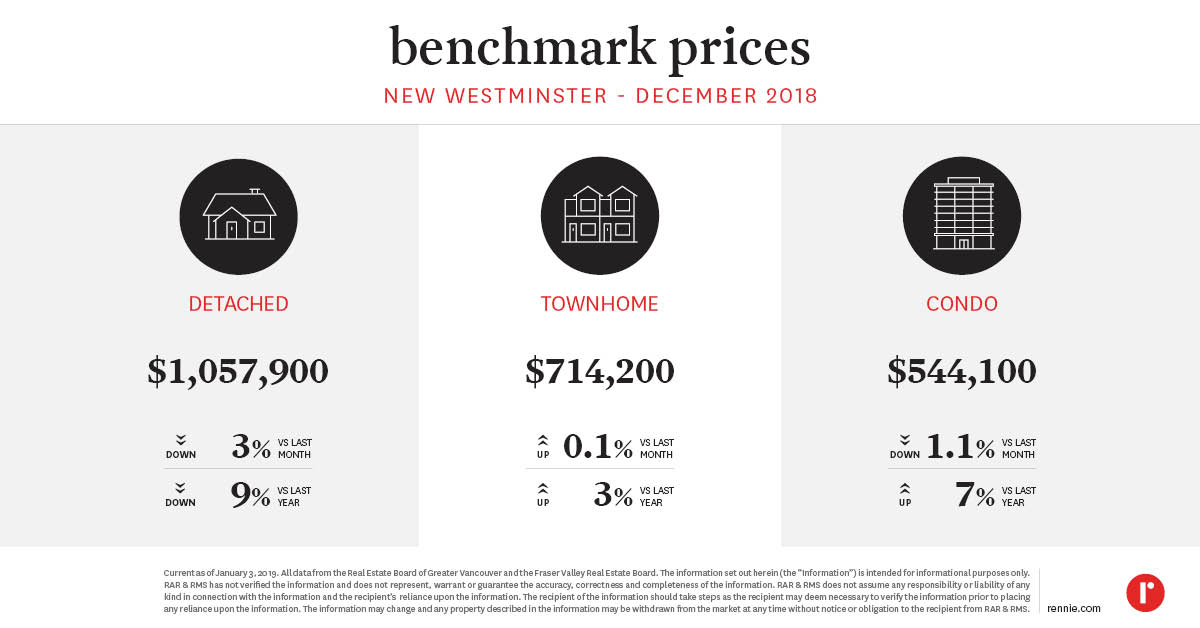
New Westminster
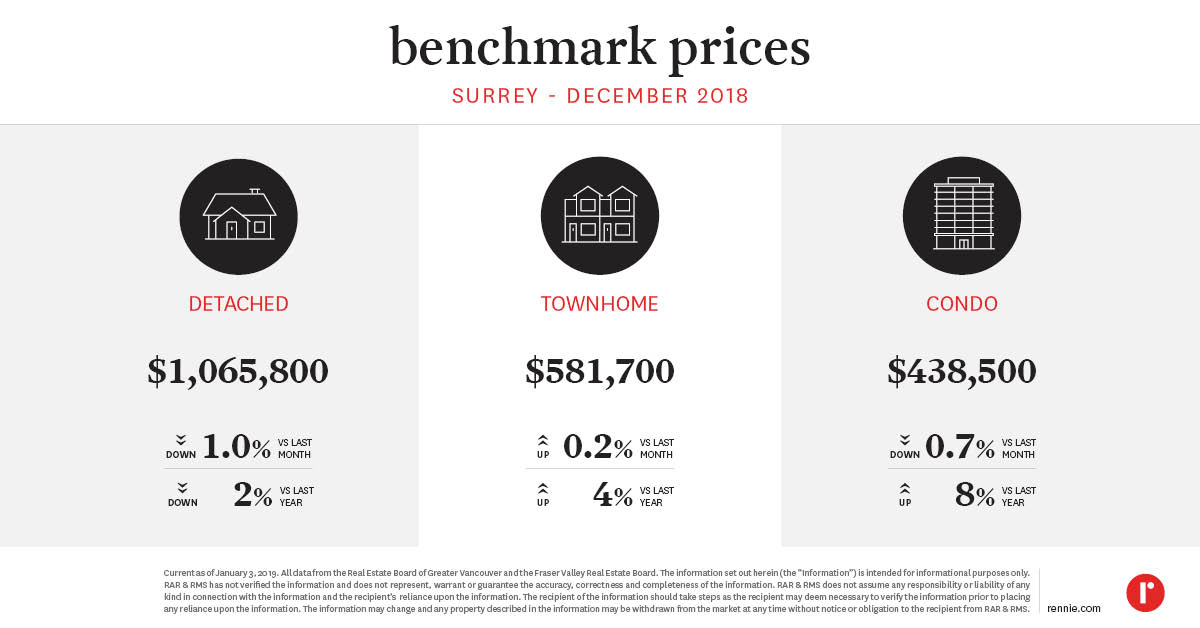
Surrey
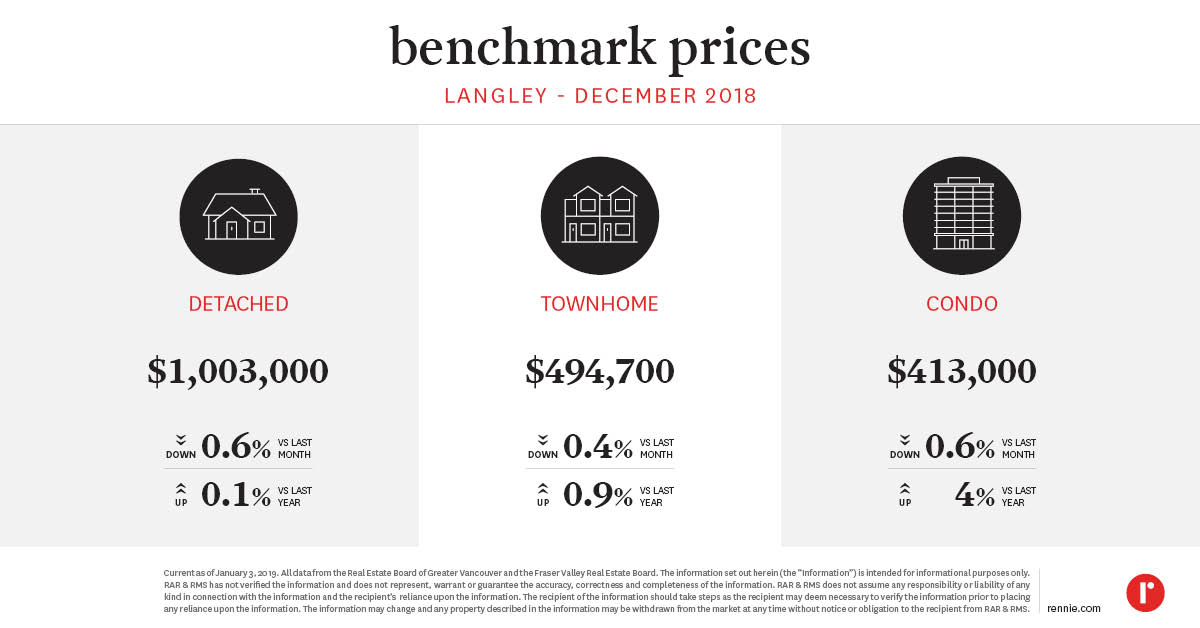
Langley
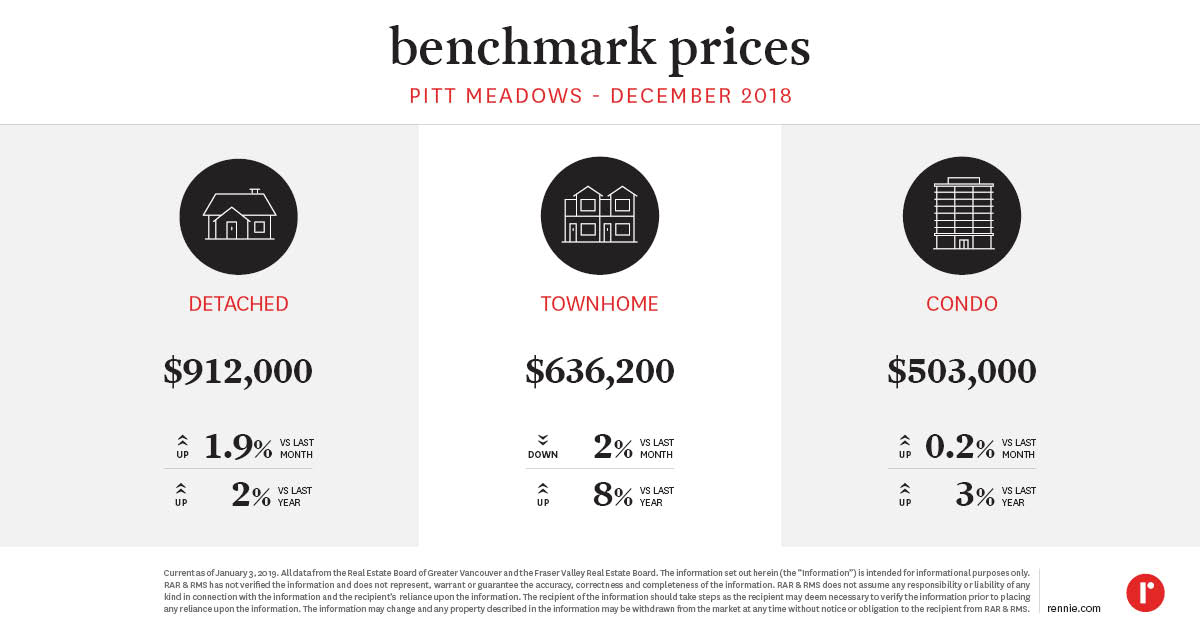
Pitt Meadows
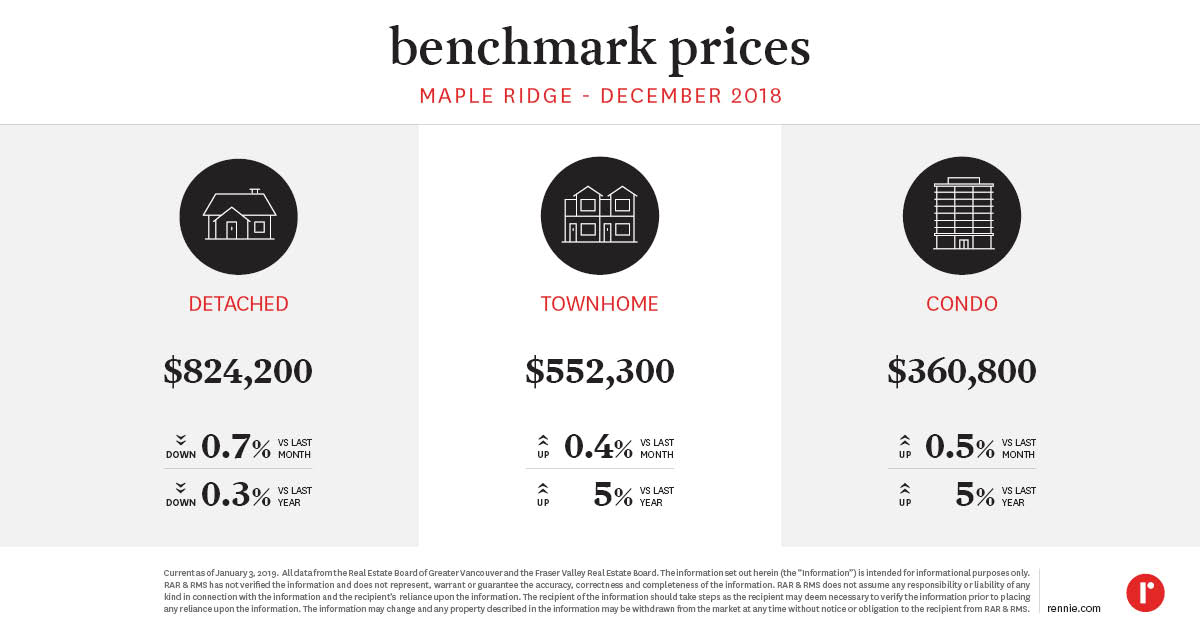
Maple Ridge
Our rennie intelligence division empowers individuals, organizations, and institutions with data-driven market insight and analysis. Experts in urban land economics, community planning, shifting demographics, and real estate trends, their strategic research supports a comprehensive advisory service offering and forms the basis of frequent reports and public presentations. Their thoughtful and objective approach truly embodies the core values of rennie.