Dec 07, 2018
Written by
Ryan BerlinSHARE THIS
Here are the Benchmark Price Infographics for the areas of the Lower Mainland covered in the monthly rennie review. The areas include the REBGV, Burnaby East, Burnaby North, Burnaby South, Coquitlam, North Vancouver, Richmond, Vancouver East, Vancouver West, West Vancouver, Squamish, Tsawwassen, Port Coquitlam, Port Moody, New Westminster, Surrey, Langley, Pitt Meadows, Maple Ridge, White Rock, and Abbotsford.Real Estate Board of Greater Vancouver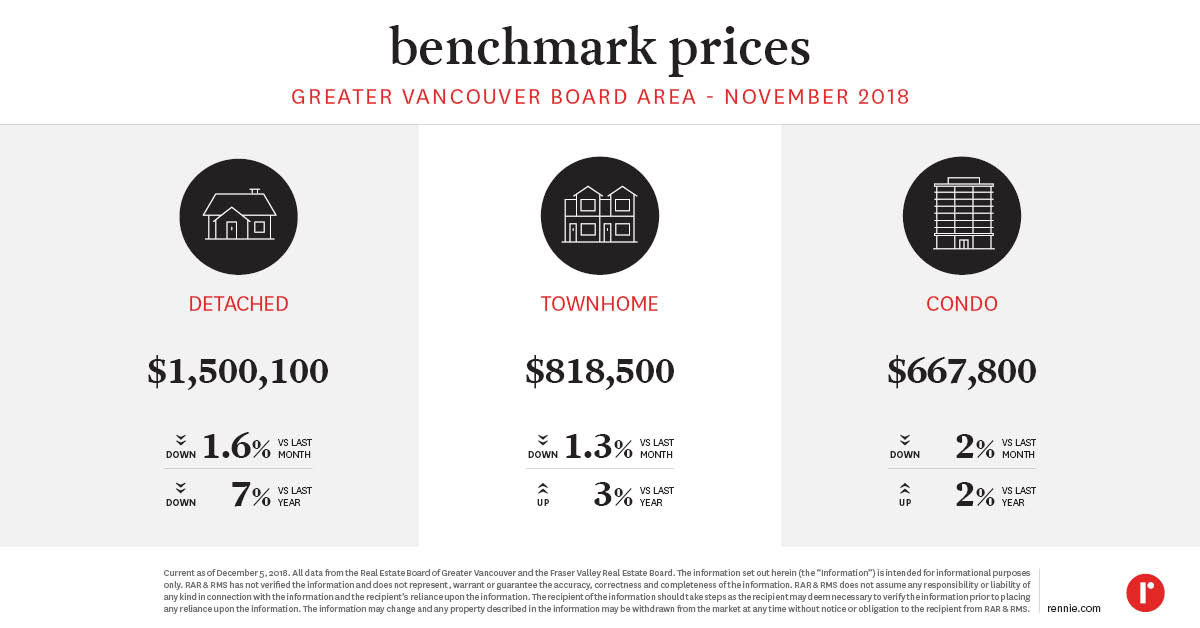 Burnaby East
 Burnaby North
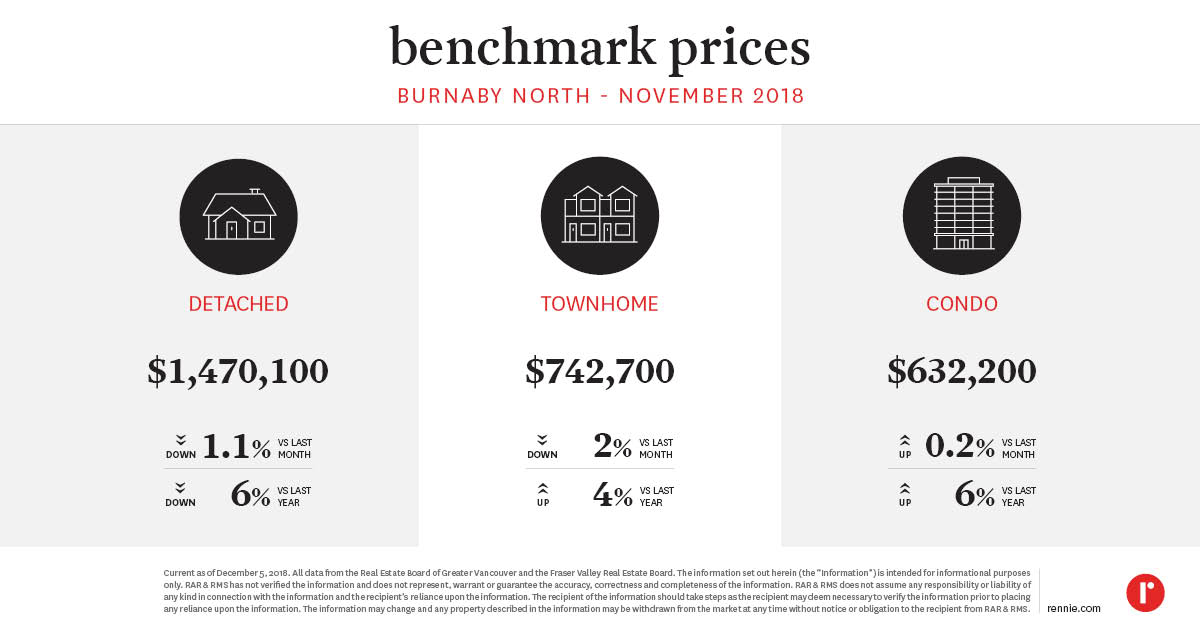 Burnaby South
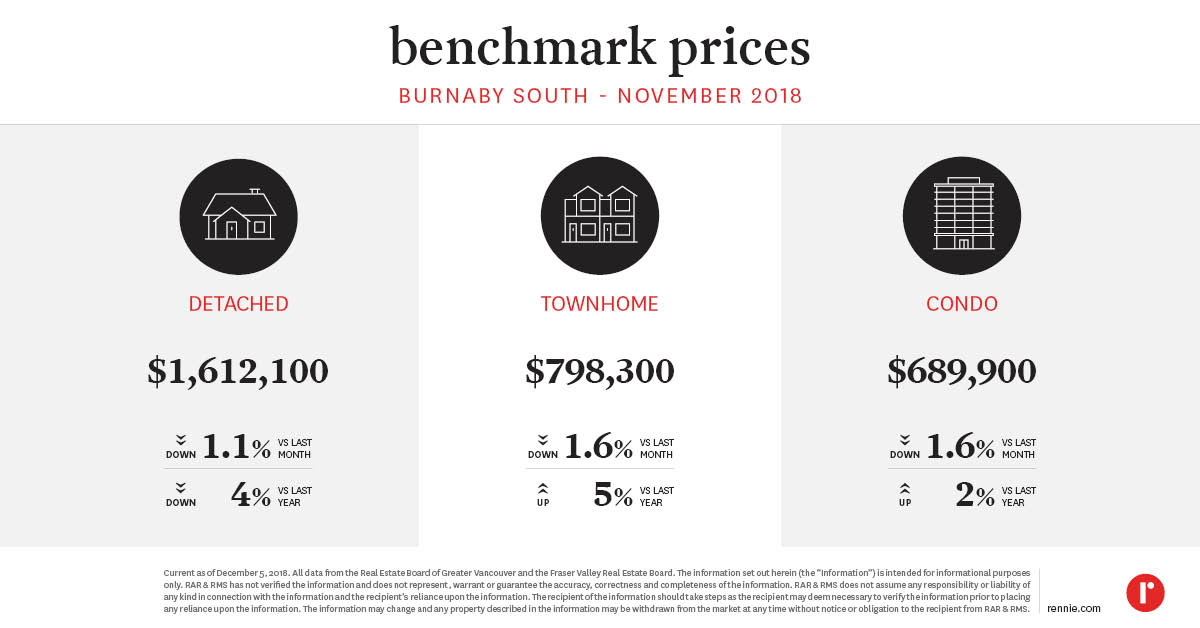 Coquitlam
 North Vancouver
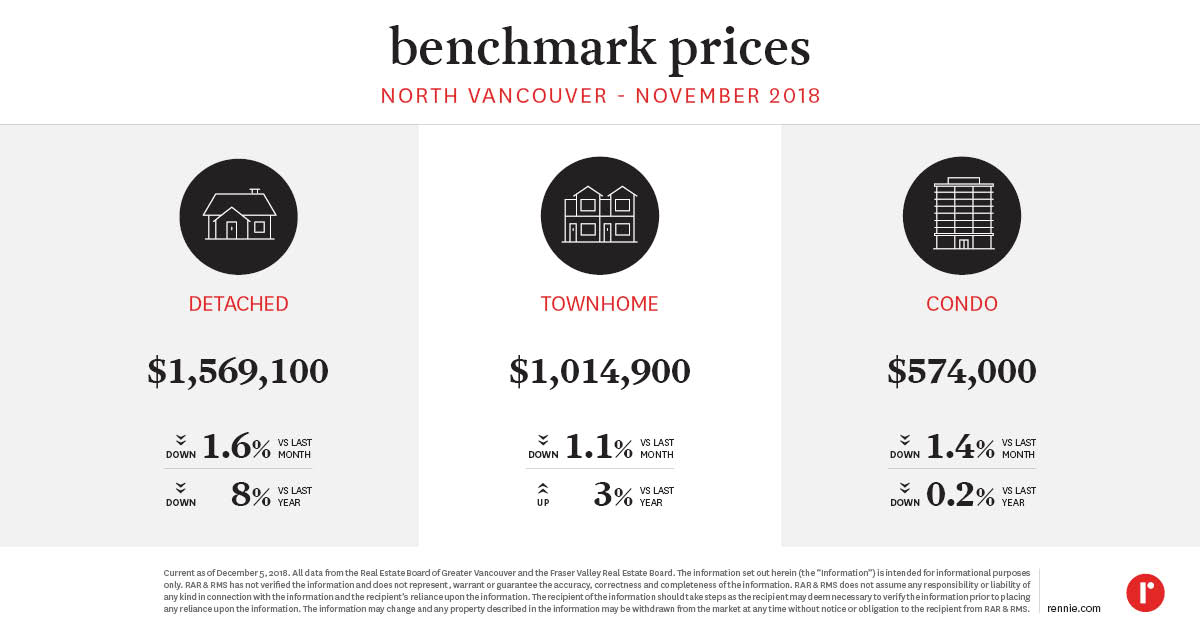 Richmond
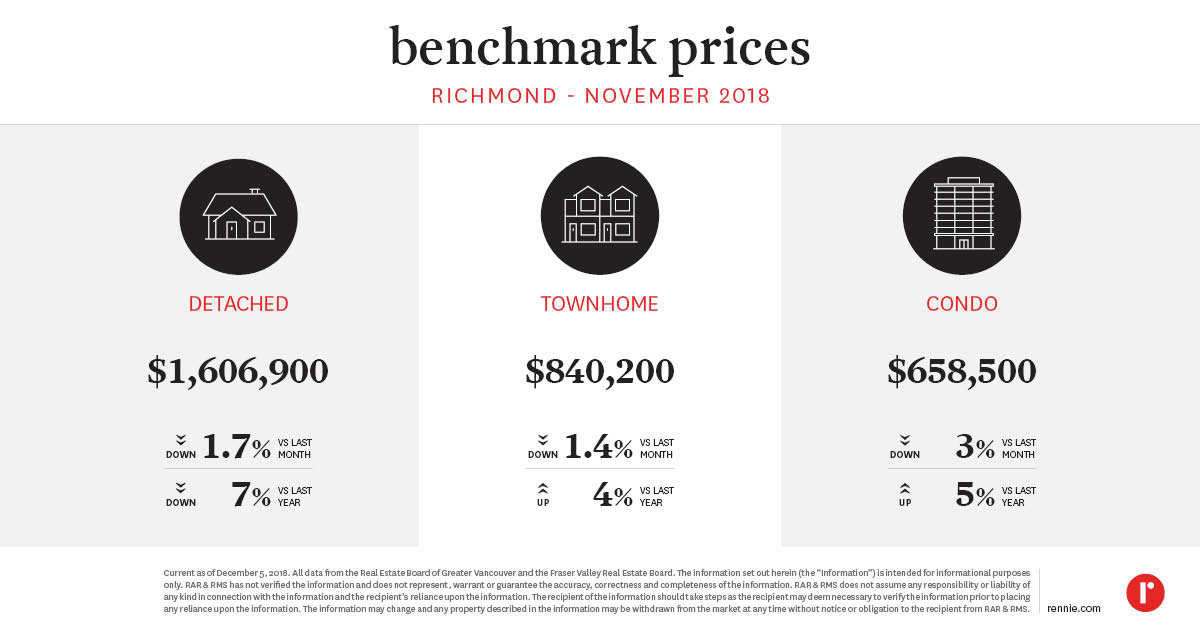 Vancouver East
 Vancouver West
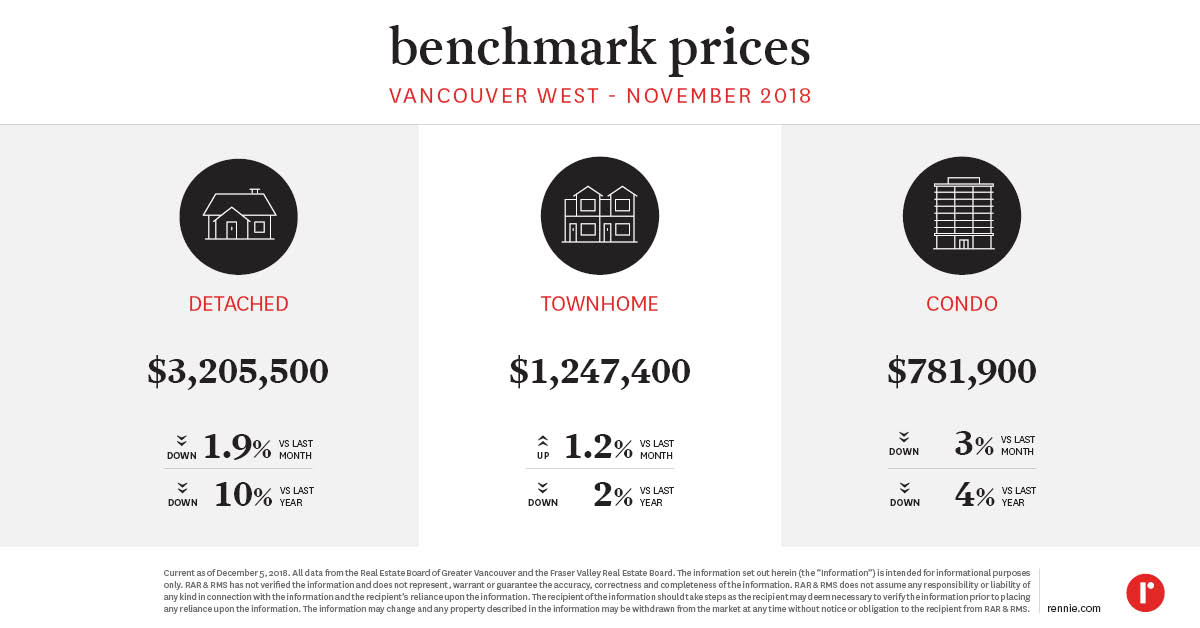 West Vancouver
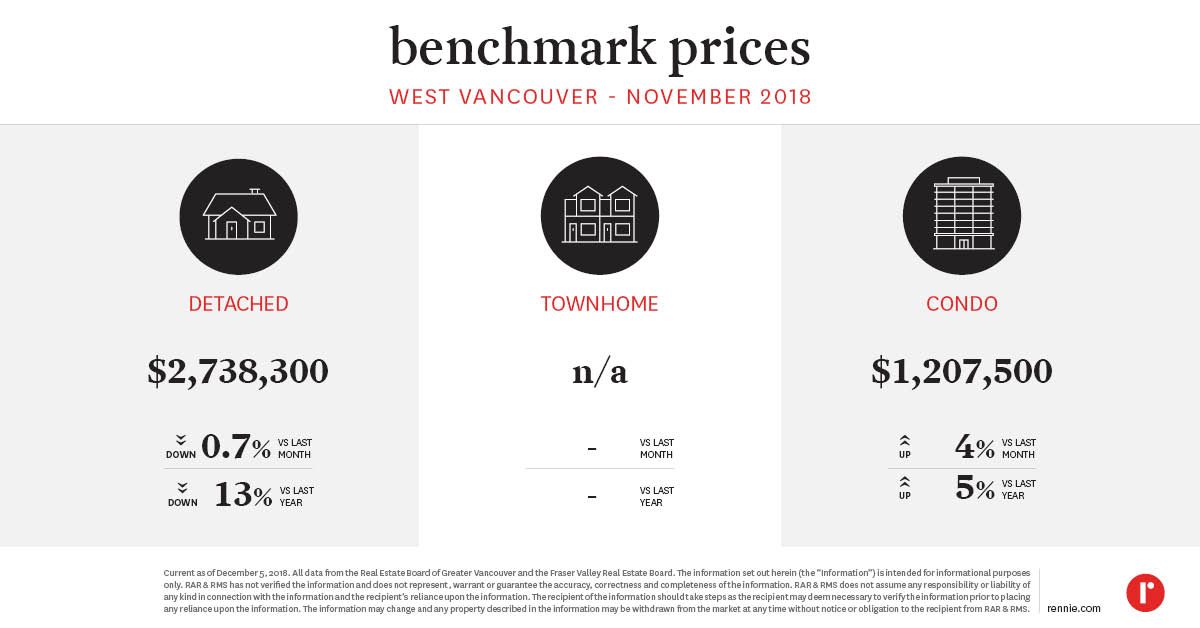 Squamish
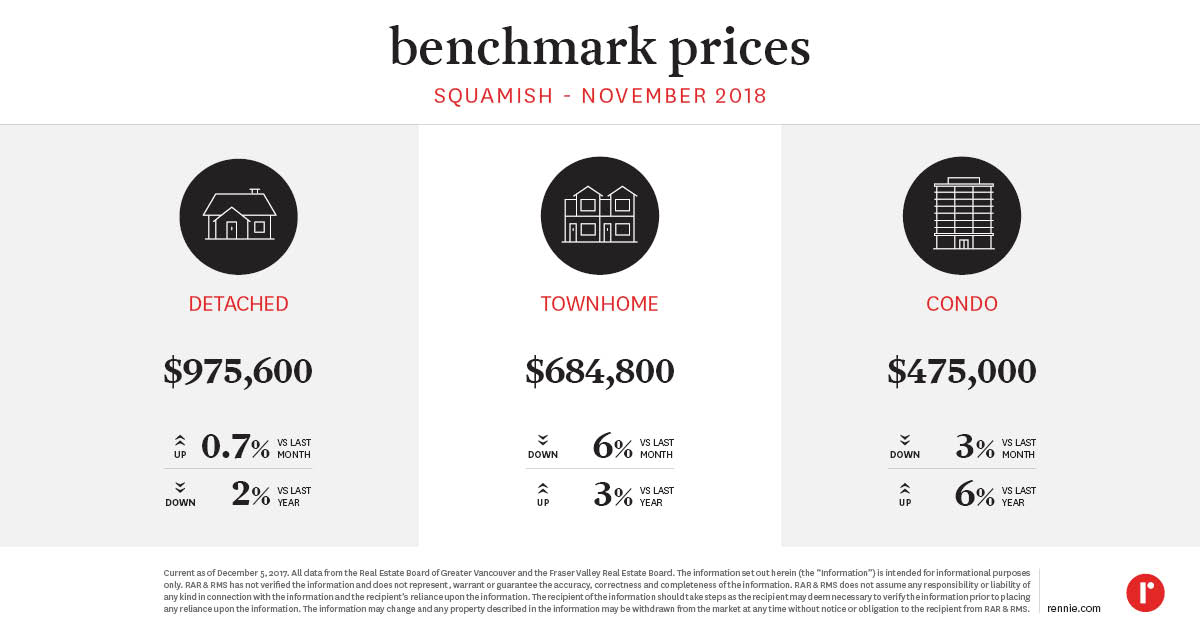 Tsawwassen
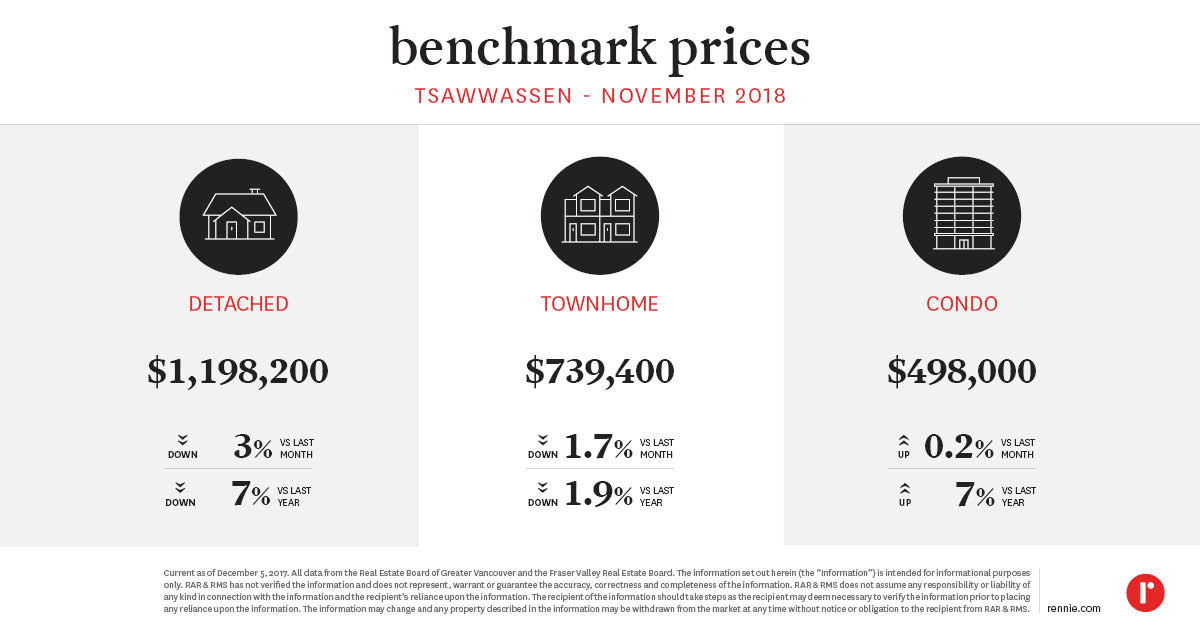 Port Coquitlam
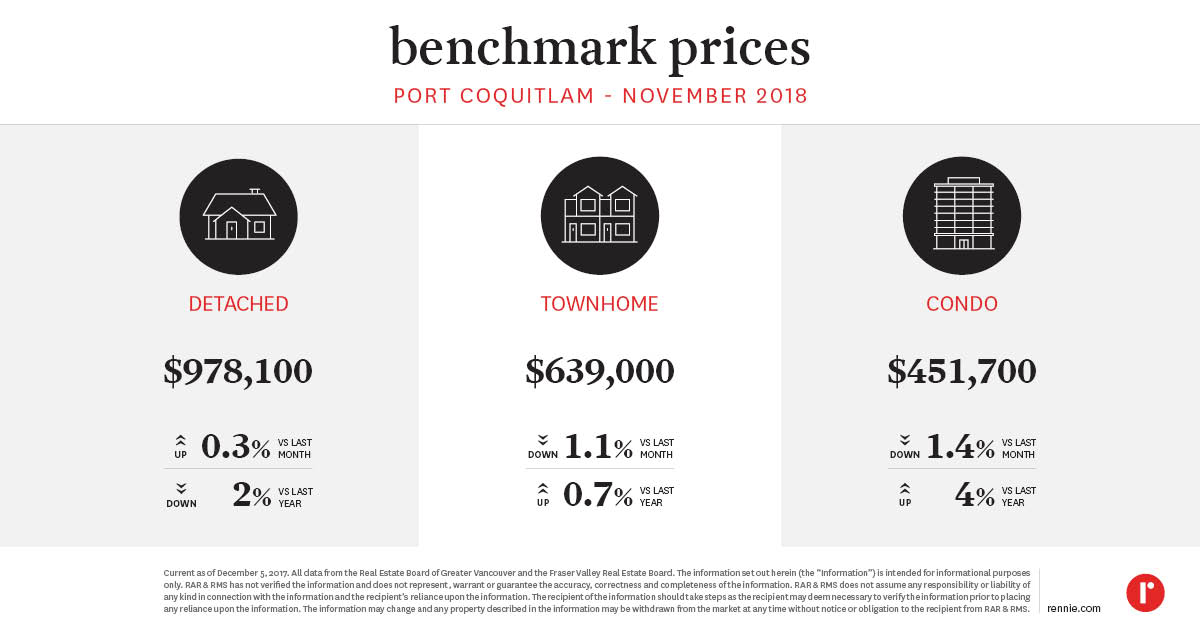 Port Moody
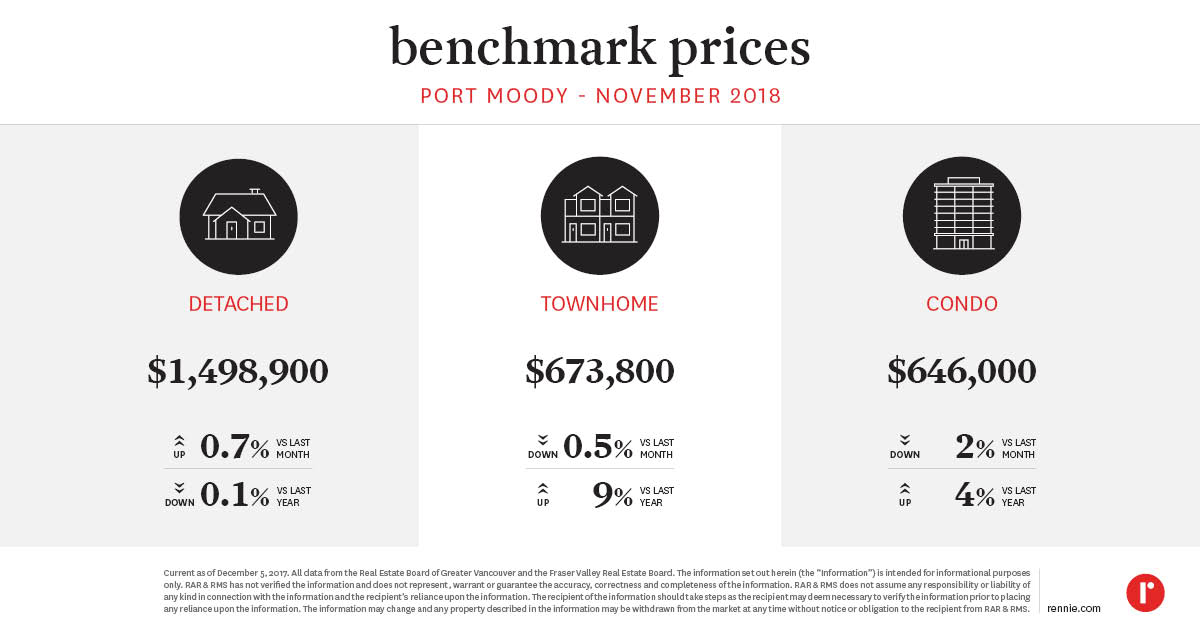 New Westminster
 Surrey
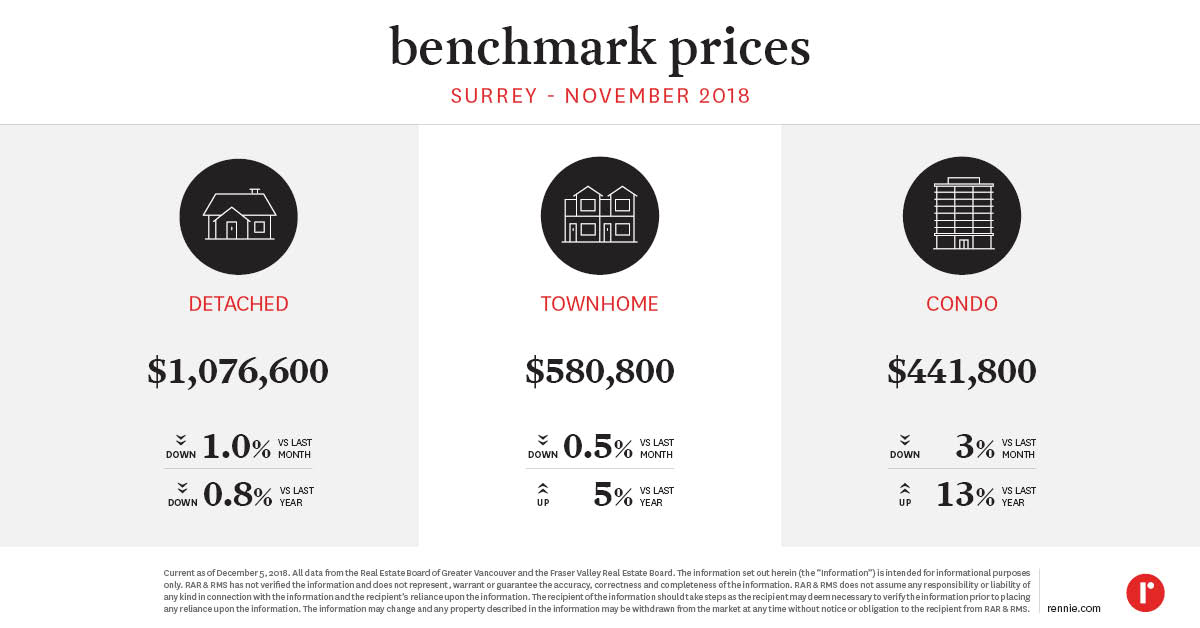 Langley
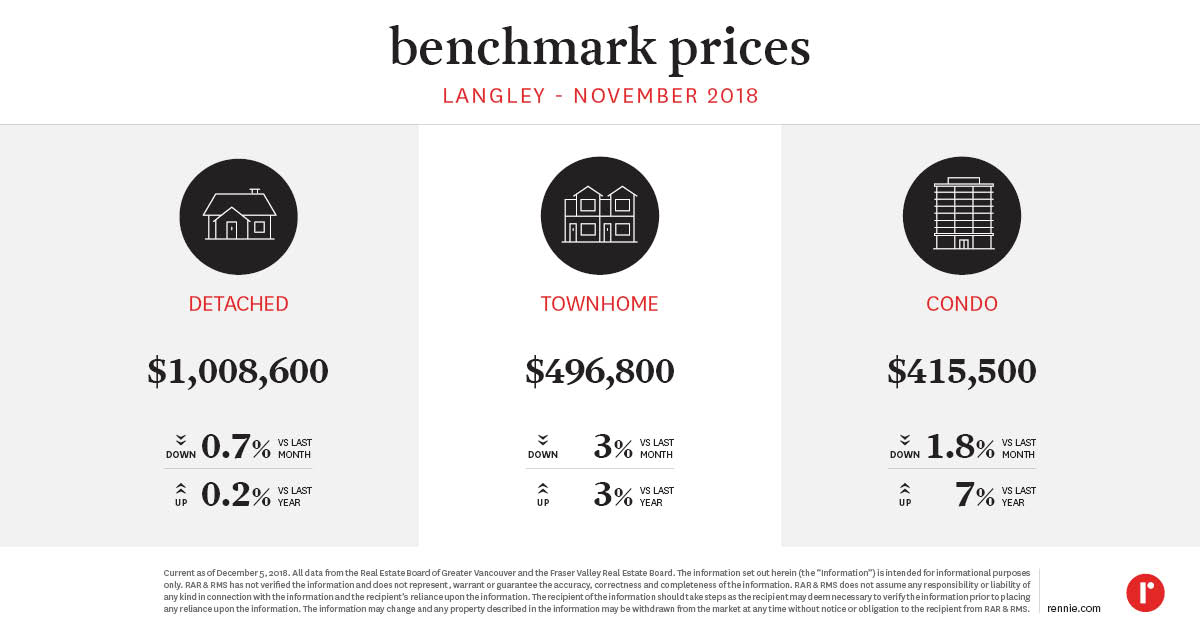 Pitt Meadows
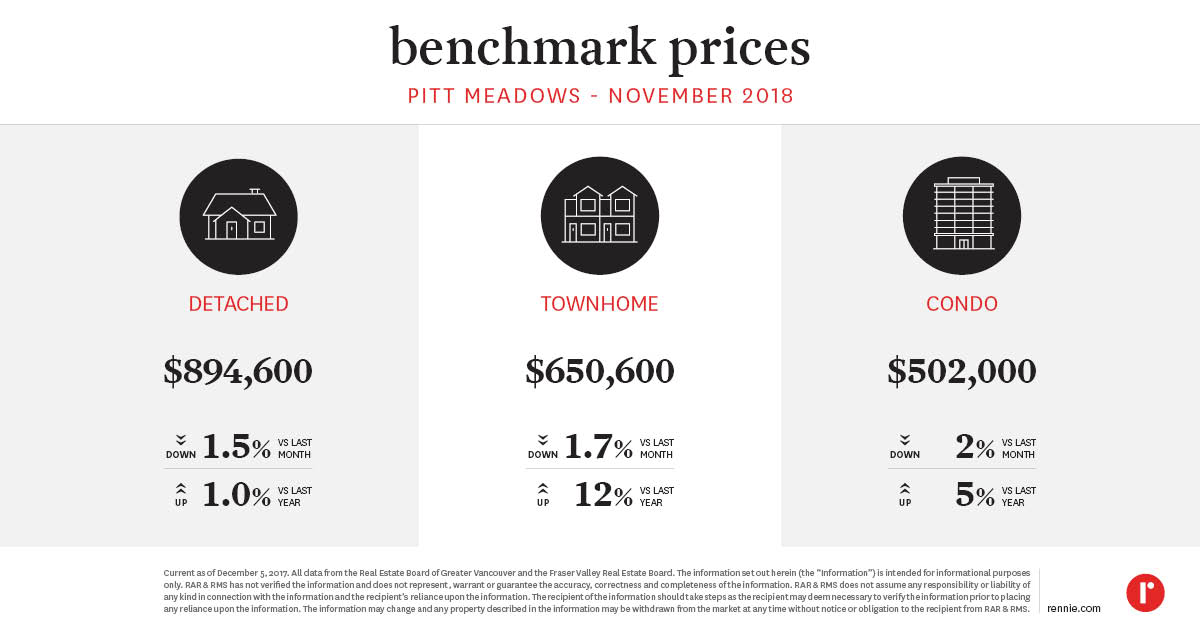 Maple Ridge
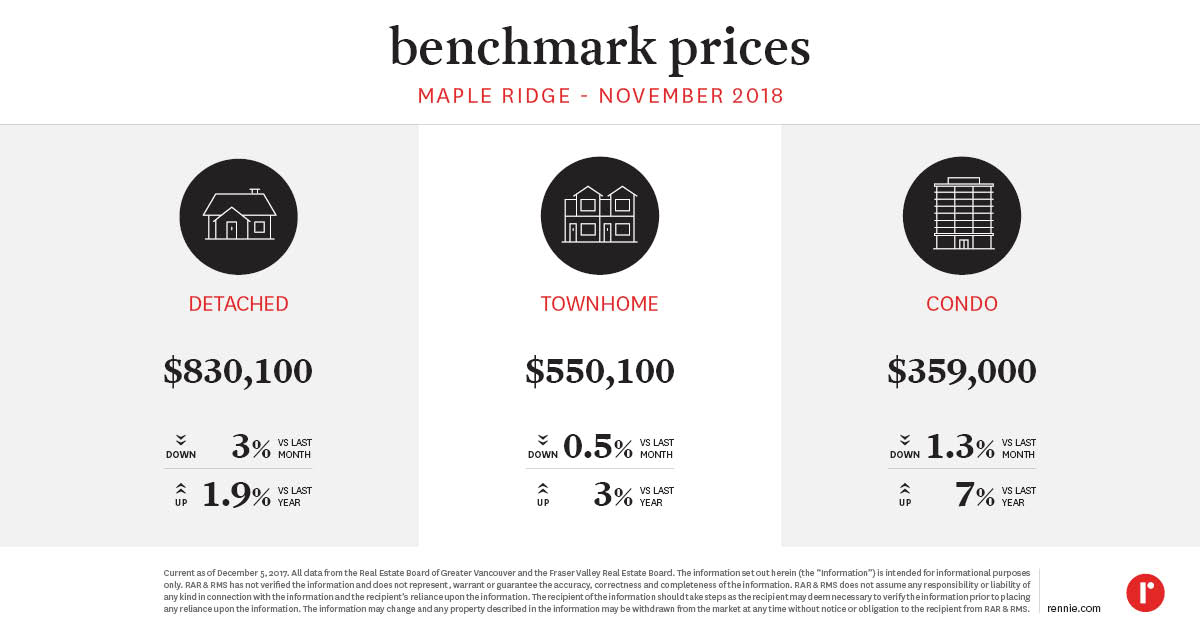 White Rock
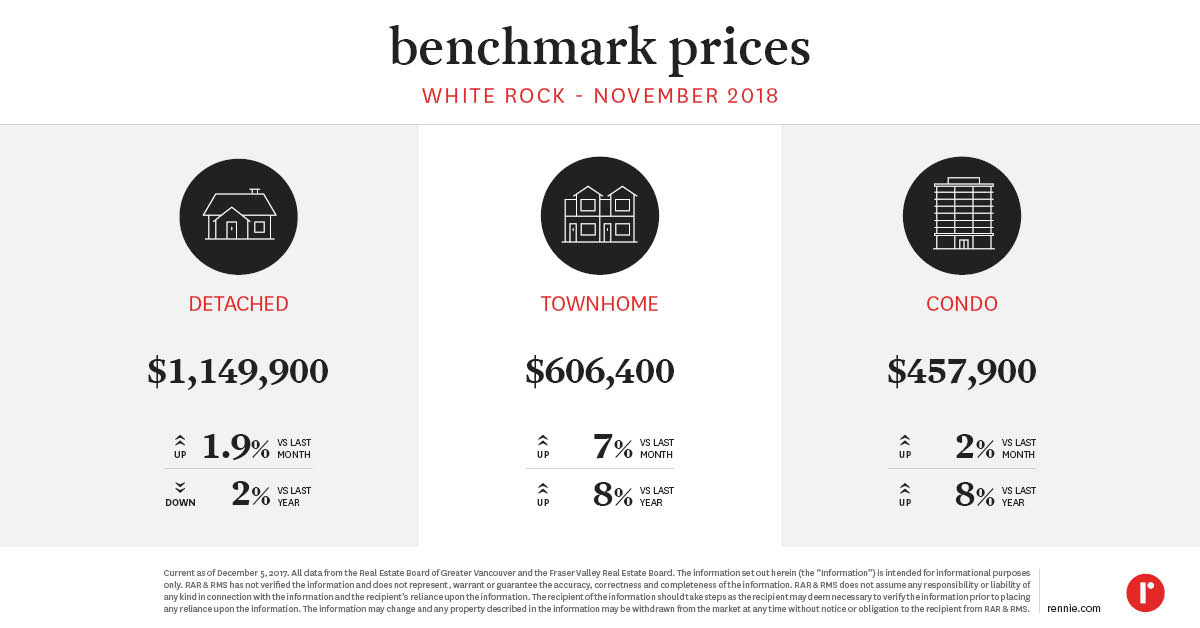 Abbotsford
 Our rennie intelligence division empowers individuals, organizations, and institutions with data-driven market insight and analysis. Experts in urban land economics, community planning, shifting demographics, and real estate trends, their strategic research supports a comprehensive advisory service offering and forms the basis of frequent reports and public presentations. Their thoughtful and objective approach truly embodies the core values of rennie.
Written by
SHARE THIS
Related
Greater Victoria’s housing market saw a slow start to spring with the lowest sales count for March in over a decade. Conversely, inventory has grown to its highest level for the month in almost as long.
Apr 2024
Report
Recent trends of lagging sales counts across the Central Okanagan carried on in March. And while overall market conditions continue to favour buyers, pockets of the market remain notably tight - particularly for lower-priced homes.
Apr 2024
Report